Molecular biology, genomics, proteomics, and mouse models of human cancer
Srinivas R. Viswanathan, MD, PhD  David A. Tuveson, MD, PhD
  Matthew Meyerson, MD, PhD
Overview
Cancer is a genetic disease. It is typified by abnormalities in genes that control cellular proliferation and lead to the unrestrained growth that characterizes a malignant cell. Thus, to gain the initiative in cancer detection and treatment, oncologists must begin to understand the molecular roots of the disease: genes, their messenger ribonucleic acids (mRNAs), and the proteins they produce. In short, oncologists should be conversant with the tools of molecular biology.
This chapter is a basic survey of molecular biology and is directed toward the clinician or trainee who wants a fundamental understanding of this discipline. It is “methods oriented” and will serve as a frame of reference for other chapters in this book. It describes the principles that underlie the procedures used most commonly by molecular biologists and provides examples of clinically relevant situations that draw on particular techniques. Molecular biology already plays an important role in clinical cancer medicine, both in terms of diagnosis (e.g., in the analysis of tumors for prognostic or pathogenetic information) and in treatment (e.g., in the production of pharmacologic and biologic agents, such as recombinant growth factors and monoclonal antibodies).
We begin with an overview of genes, gene expression, and gene cloning. Our discussion of techniques follow the flow of genetic information as we explain the procedures used to analyze gene expression at the levels of DNA, RNA, and protein. Good general overviews of these topics can be found in several books.1–3
Overview: gene structure
Genes and gene expression
The gene is the fundamental unit of inheritance and the ultimate determinant of all phenotypes. The DNA of a normal human cell contains an estimated 20,000–25,000 protein-coding genes, but only a fraction of these are expressed in any particular cell at any given time. For example, genes specific for erythroid cells, such as the hemoglobin genes, are not expressed in brain cells. The identity of each gene expressed in a particular cell at a given time and its level of expression are defined as the “transcriptome.”
According to the central dogma of molecular biology, a gene exerts its effects by having its DNA transcribed into an mRNA, which, in turn, is translated into a protein, the final effector of the gene’s action. Thus, molecular biologists often investigate gene expression or activation, by which is meant the process of transcribing DNA into RNA or translating RNA into protein. The process of transcription involves creating an RNA copy (a “transcript”) of the gene using the DNA of the gene as a template. The mRNA transcript is then translated into a protein by the ribosome, which decodes the sequence information contained within the transcript to build a corresponding protein composed of amino acids.
Functional components of the gene
Every gene consists of several functional components, each involved in a different facet of the process of gene expression (Figure 1). Broadly speaking, however, there are two main functional units: the promoter region and the coding region.
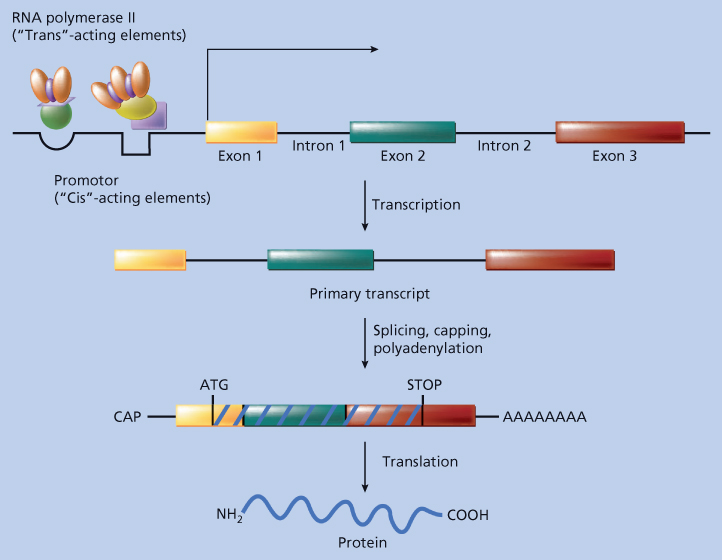
Figure 1 Gene expression. A gene’s DNA is transcribed into messenger ribonucleic acid (mRNA), which, in turn, is translated into protein. The functional components of a gene are schematically diagrammed here. Areas of the gene destined to be represented in mature mRNA are called exons, and intervening areas of DNA between exons are called introns. The portion of the gene that controls transcription, and therefore expression, is the promoter. This control is exerted by specific nucleotide sequences in the promoter region (so-called cis-acting factors) and by proteins (so-called trans-acting factors) that must interact with promoter DNA and/or ribonucleic acid (RNA) polymerase II for transcription to occur. The primary transcript is the RNA molecule made by RNA polymerase II that is complementary to the entire stretch of DNA containing the gene. Before leaving the nucleus, the primary transcript is modified by splicing together exons (thus removing intronic sequences), adding a cap to the 5′ end and adding a poly-A tail to the 3′ end. Once in the cytoplasm, mature mRNA undergoes translation to yield a protein.
The promoter region controls when and in what tissue a gene is expressed. For example, the promoter of the hemoglobin gene is responsible for its expression in erythroid cells and not in brain cells. How is this tissue-specific expression achieved? In the DNA of the gene’s promoter region, there are specific structural and sequence elements (see section titled “Structural Considerations”) that permit the gene to be expressed only in an appropriate cell. These are the elements in the hemoglobin gene that instruct an erythroid cell to transcribe hemoglobin mRNA from that gene. These structures are referred to as “cis-acting elements” because they reside on the same molecule of DNA as the gene. In some cases, other tissue-type-specific cis-acting elements, called enhancers, reside on the same DNA molecule but at a great distance from the coding region of the gene.4, 5 In the appropriate cell, the cis-acting elements bind protein factors that are physically responsible for transcribing the gene. These proteins are called trans-acting factors because they reside in the cell’s nucleus, separate from the DNA molecule bearing the gene. For example, brain cells would not have the right trans-acting factors that bind to the hemoglobin promoter and activate gene expression; therefore, brain cells would not express hemoglobin. They would, however, have trans-acting factors that bind to neuron-specific gene promoters.
The structure of a gene’s protein is specified by the gene’s coding region. The coding region contains the information that directs an erythroid cell to assemble amino acids in the proper order to make the hemoglobin protein. How is this order of amino acids specified? As described in detail later, DNA is a linear polymer consisting of four distinguishable subunits called nucleotides. In the coding region of a gene, the linear sequence of nucleotides encodes the amino acid sequence of the protein. This genetic code is in triplet form so that every group of three nucleotides encodes a single amino acid. The 64 triplets that can be formed by four nucleotides exceed the 20 distinct amino acids used to make proteins. This makes the code degenerate and allows some amino acids to be encoded by several different triplets.6 As discussed in the section titled “Nucleotide Sequencing”, the nucleotide sequence of any gene can be determined using a variety of methods (see below). By translating the code, one can therefore derive a predicted amino acid sequence for the protein encoded by a gene.
Structural considerations
Fine structure
The basic repeating units of the DNA polymer are nucleotides (Figure 2). Nucleotides consist of an invariant portion, a five-carbon deoxyribose sugar with a phosphate group, and a variable portion, the base. Of the four bases that appear in the nucleotides of DNA, two are purines, adenine (A) and guanine (G), and two are pyrimidines, cytosine (C) and thymine (T). Nucleotides are connected to each other in the DNA polymer through their phosphate groups, leaving the bases free to interact with each other through hydrogen bonding. This base pairing is specific, so that A interacts with T and C interacts with G. DNA is ordinarily double stranded; that is, two linear polymers of DNA are aligned so that the bases of the two strands face each other. Base pairing makes this alignment specific, so that one DNA strand is a perfectly complementary to the other. This complementarity means that each DNA strand carries the information needed to make an exact replica of itself.
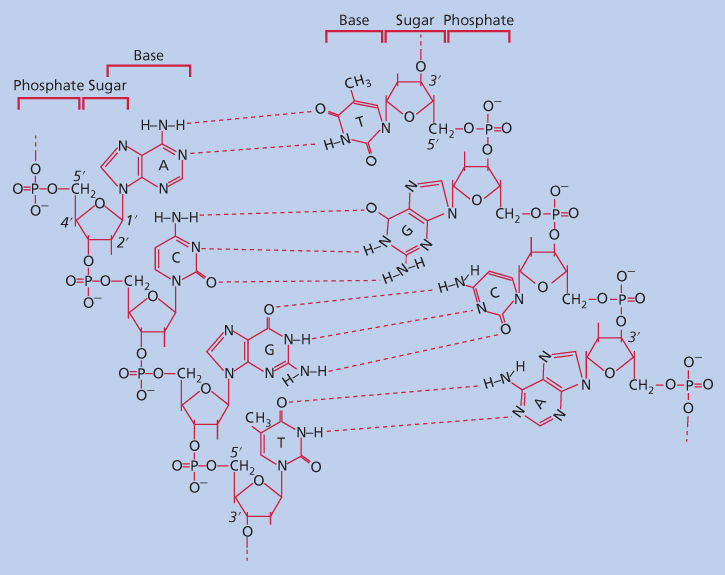
Figure 2 Structure of base-paired double-stranded DNA. Each strand of DNA consists of a backbone of five-carbon deoxyribose sugars connected to each other through phosphate bonds. Note that as one follows the sequence down the left-hand strand (A to C to G to T), one is also following the carbons of the deoxyribose ring, going from the 5′ carbon to the 3′ carbon. This is the basis for the 5′ to 3′ directionality of DNA. The 1 carbon of each deoxyribose is substituted with a purine or pyrimidine base. In double-stranded DNA, bases face each other in the center of the molecule and base pair via hydrogen bonds (dotted lines). Base pairing is specific so that adenine pairs with thymine and guanine pairs with cytosine.
In every strand of a DNA polymer, the phosphate substitutions alternate between the 5 and 3 carbons of the deoxyribose molecules. Thus, there is directionality to DNA: the genetic code reads in the 5–3 direction. In double-stranded DNA, the strand that carries the translatable code in the 5–3 direction is called the sense strand, whereas its complementary partner is termed the antisense strand.7
Gross structure
In eukaryotes, the coding regions of most genes are not continuous. Rather, they consist of areas that are transcribed into mature mRNA (exons) interrupted by stretches of DNA that do not appear in mature mRNA (introns) (Figure 1). The exact functions of introns are not known with certainty. Some may contain regulatory sequences, and certainly an important purpose is implied by their conservation across evolution. There is reason to believe that the overall physical structure of introns might be more important than their specific nucleotide sequences, because the nucleotide sequences of introns diverge more rapidly in evolution than do the sequences of exons. Overall, the DNA that ultimately encodes for protein comprises only a tiny minority of total DNA. Between genes, there are vast stretches of untranscribed DNA that are assumed to play an important structural role. There are also many regions that give rise to transcribed “noncoding” RNA species—these regulatory RNAs are transcribed and functionally active without being translated into proteins.8–10
In the nucleus, DNA is not present as naked nucleic acid. Rather, it is found in close association with a number of accessory proteins, such as the histones, and in this form is called chromatin.11 A multitude of accessory DNA proteins allow for the correct packaging of DNA. For example, DNA’s double helix is ordinarily twisted on itself to form a supercoiled structure.12 This structure must partially unwind during DNA replication and transcription.13 Accessory proteins such as topoisomerases, histone acetylases, and histone deacetylases, are involved in regulating this process.
Summary
Genes specify the sequence and structure of proteins that are responsible for their phenotype. Although the nucleus of every human cell contains 20,000–25,000 genes, only a tiny fraction of them are expressed in any given cell at any given time. The promoter (with or without an enhancer) is the part of the gene that determines when and where it will be expressed. The coding region is the part of the gene that dictates the amino acid sequence of the protein encoded by the gene. In addition to the proportion of the DNA that contains genes encoding for proteins, the genome contains vast stretches of regulatory sequences and noncoding RNA sequences. DNA is a linear polymer of nucleotides. Ordinarily, the nucleotide bases of one strand of DNA pair with those of the complementary strand (A with T, C with G) to make double-stranded DNA. In the cell’s nucleus, DNA is associated with accessory proteins and packaged into the higher order form known as chromatin
General techniques
Restriction endonucleases and recombinant DNA
In eukaryotic chromosomes, individual molecules of DNA are several million base pairs long. Because these molecules are far too large to analyze directly, scientists are usually interested in cutting DNA into fragments of more manageable size. Fortunately, for molecular biologists, bacteria have evolved a highly diverse set of enzymes, the restriction endonucleases, which cleave DNA internally within the polymer14
In nature, these enzymes have evolved to protect bacteria from invasion by foreign species, such as bacteriophages. To discriminate between “domestic” and “foreign” DNA, these enzymes recognize specific nucleotide sequences. DNA without such specific sequences is left undisturbed by the enzymes. However, when a restriction endonuclease spots a recognition site, it binds to the site and cleaves both strands of the DNA to which it has bound. Individual restriction endonucleases recognize specific sequences, usually in the order of four to six bases in length, and these sequences are often palindromes (i.e., the 5–3 sequence in the upper strand is identical to the 5–3 sequence in the lower strand) (Figure 3).15
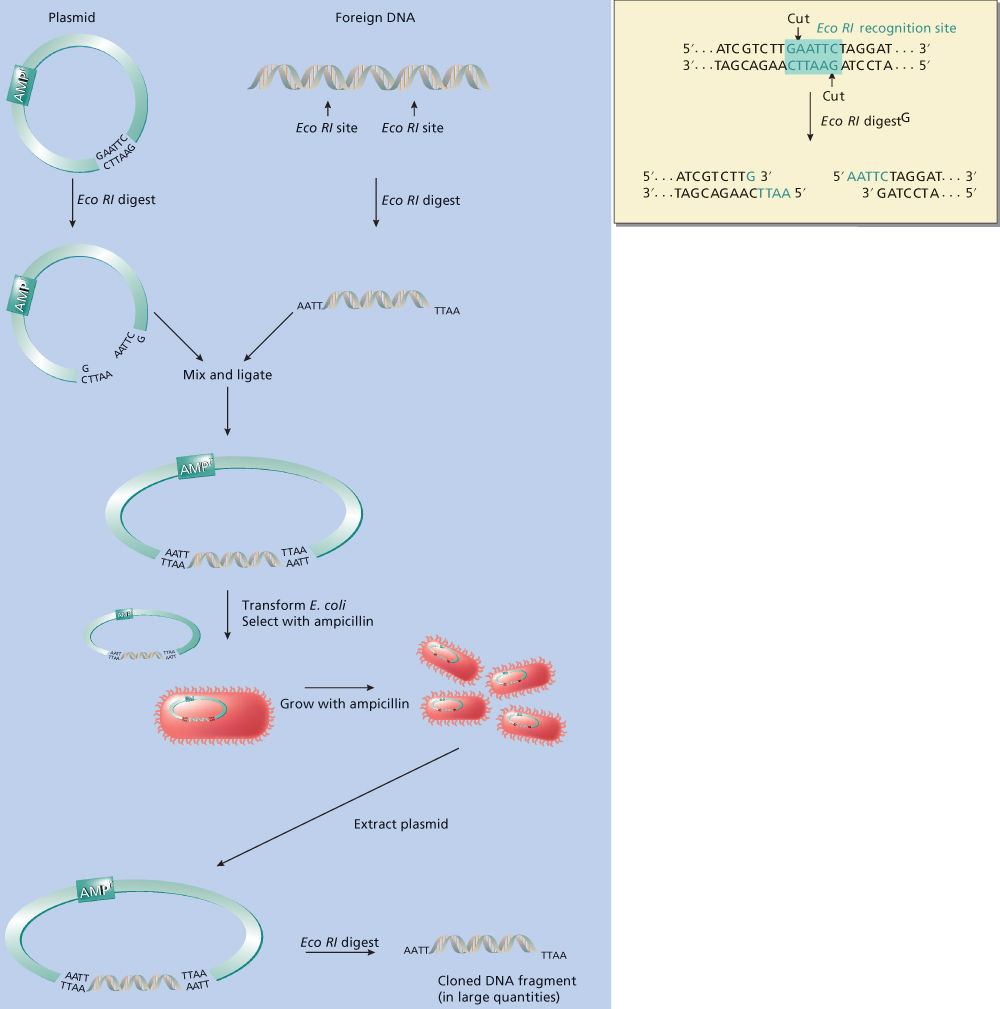
Figure 3 Digestion of DNA with the restriction endonuclease EcoRI and gene cloning. In this example, a small amount of foreign DNA (a few nanograms) is digested with EcoRI. The nucleotide sequence of this stretch of DNA contains the recognition sequence for EcoRI, GAATTC (boxed). EcoRI cuts the DNA in both strands between the indicated nucleotides, resulting in fragments with five single-stranded tails. This foreign DNA can come from any source, the only requirement being that it contains the same restriction endonuclease recognition sites as the vector. Plasmid vector is also digested with EcoRI to create a linear DNA molecule. The “sticky” single-stranded ends of the foreign DNA can align and base pair with the complementary “sticky ends” of the plasmid, after which DNA ligase covalently bonds foreign DNA to plasmid DNA. This recombinant DNA is introduced into E. coli by a process called transformation. Because the bacteria themselves are not resistant to ampicillin, growth in ampicillin will select only those bacteria that have taken up the plasmid DNA (which carries an ampicillin resistance gene). The plasmid contains a bacterial origin of replication so that as the bacterial culture grows, plasmids replicate, resulting in several copies in each bacterium. When the culture has grown to sufficient size, plasmid DNA can be isolated biochemically, foreign DNA can be cut from the plasmid using EcoRI, and the resulting yield will often be milligrams of DNA, that is, greater than a 106-fold amplification.
Although restriction endonucleases cut DNA into smaller fragments, there is a lower limit to the size of useful fragments. One would not want to cut DNA into such small pieces that the informational content of each piece is negligible. Statistically, the longer a restriction endonuclease’s recognition sequence, the less frequently this sequence will occur in a stretch of DNA. Therefore, the enzymes most commonly used to cut DNA into usefully large fragments are those that recognize a 6-nt recognition site (so-called six-base cutters). For example, an endonuclease isolated from Escherichia coli, called EcoRI, recognizes the sequence GAATTC, and wherever this occurs in double-stranded DNA, it will cleave between the G and A (Figure 3). (Note that the antisense strand, which reads CTTAAG in the 3′–5′ direction, will also read GAATTC in the 5′–3′ direction. This is what is meant by a palindromic sequence.)
Gene cloning
Mechanics
The most powerful technique available for gene analysis, and the one technique that is the cornerstone for all others, is gene cloning (Figure 3). In the gene cloning process, a discrete piece of DNA is faithfully replicated in the laboratory. Cloning provides quantities of specific DNA sufficient for biochemical analysis or for any other manipulation, including joining to a foreign piece of DNA. In the early 1970s, Cohen et al.16 drew on two fundamental properties of bacteria and their viruses (phages) that made this innovation possible: plasmids and DNA ligases.
Plasmids are circular molecules of DNA that replicate in the cytoplasm of bacterial cells, separate from the bacteria’s own DNA. In nature, plasmids often carry genetic information useful to the host bacterium, such as genes that confer resistance to antibiotics. For the purposes of gene cloning, plasmids are important because they contain all of the information necessary for directing bacterial enzymes to replicate the plasmid DNA, in some cases, to many thousands of copies per bacterium.
DNA ligases are enzymes produced by bacteria (and some phages when they infect bacteria) that can link or ligate together separate pieces of DNA. The nucleotide sequence in a piece of DNA does not influence the activity of a DNA ligase so that a DNA ligase can join any two pieces of DNA together, even ones that are not ordinarily connected to each other in nature. Indeed, the power of cloning comes in the ability to “mix and match” segments of DNA in a fashion tailored to the desired use.
Cloning with restriction endonucleases
In the traditional form of gene cloning, one uses a restriction endonuclease to cut open the circular plasmid DNA in a region of the plasmid not necessary for replication (Figure 3). Suppose, for example, that the enzyme EcoRI cuts open the plasmid in such a nonessential area. EcoRI recognizes the sequence GAATTC and cuts both DNA strands between the G and the A nucleotides. Protruding from the cut ends will be single-stranded DNA “tails” with the sequence AATT. (Note that the tail’s sequence in the sense strand is the same as the sequence in the antisense strand when the nucleotides are read in the 5′–3′ direction.) Any other piece of DNA that has been cut with EcoRI will also have single-stranded AATT tails, and the AATT tails on this foreign piece of DNA can base pair with the complementary TTAA tails (reading 3′–5′) on the cut plasmid. When this happens, the foreign DNA piece physically closes the gap in the plasmid, forming a closed circular plasmid again (which is necessary for plasmid propagation).
Although the nucleotides at the ends of the plasmid and foreign DNA now abut each other, they are not covalently connected. This is an unstable situation that the DNA ligase rectifies. The DNA ligase covalently joins the plasmid and foreign DNA to create a recombinant plasmid, which still has all of the information needed to be replicated in a bacterium but which also contains a foreign DNA insert. Obviously, the EcoRI-cut ends of the plasmid can also base pair with themselves again to reform the native plasmid, but molecular biologists have developed a number of tricks to suppress this phenomenon. It should be pointed out that single-stranded tails are not always necessary for making recombinant DNA. Under certain conditions, the DNA ligase can join together two fragments of blunt-ended DNA without these tails.
When a recombinant plasmid is reintroduced into a host bacterium (by a process called transformation), the plasmid will replicate normally. Now, however, its foreign DNA insert is replicated along with the plasmid into which it was inserted. The transformed bacteria can then be grown to large numbers in liquid culture. With each bacterial cell division, the progeny bacteria contain plasmid molecules that continue to replicate. When the bacterial culture contains the desired quantity of this plasmid (this may be milligrams of plasmid DNA in a 1 L culture), it can be reisolated as pure DNA. The cloned foreign piece of DNA can then be cut out (with EcoRI, in our example) for further analysis or manipulation. One can also use bacterial viruses (or phages) in the same manner by infecting host bacteria with recombinant phage-bearing foreign DNA sequences. In all of these experiments, the plasmid or phage that houses the foreign DNA is called a vector because it is the vehicle that directs the foreign DNA into the host bacterium.
These extraordinarily powerful tools, which are now part of the standard armamentarium of all molecular biology laboratories, have been responsible for the development of nearly all of the analytic techniques described later. Several excellent manuals that describe these techniques in detail have been published.17, 18
Gateway cloning
Gateway cloning is a proprietary commercial system that has gained widespread popularity for the ease with which it allows researchers to transfer DNA fragments between plasmids. In Gateway cloning, a DNA fragment of interest is first appended with specific Gateway sequences on the 5′ and 3′ ends (termed “attB1” and “attB2”, respectively). A proprietary recombinase named BP Clonase that recognizes these Gateway sequences is then used to recombine the fragment into a so-called Gateway Donor vector, to generate a clone in which sequences termed “attL1” and “attL2” flank the fragment of interest. Once in the Gateway Donor vector, the fragment (now termed an “entry clone”) can be transferred to any one of thousands of available Gateway Destination vectors using another recombinase mix termed “LR Clonase”.19 This recombinase-based technology therefore allows gene fragments to be easily shuttled between plasmids without the need for restriction digestion and purification steps (Figure 4a).
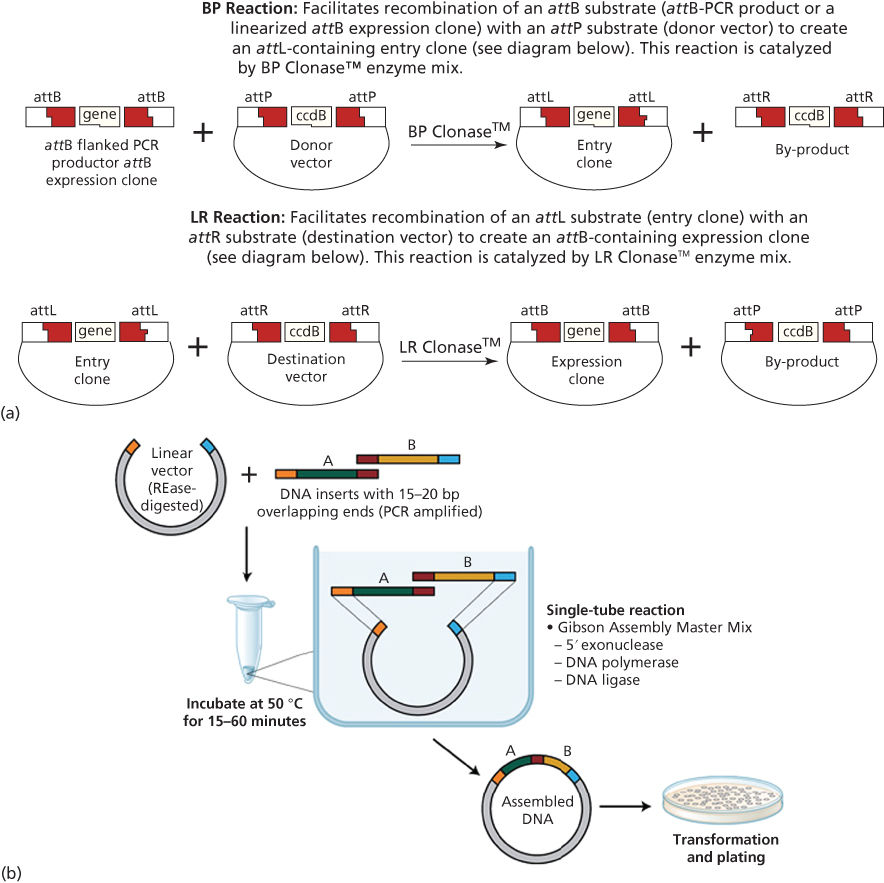
Figure 4 (a) Gateway cloning. Source: Gateway Technology Manual from: http://www.thermofisher.com/us/en/home/life-science/cloning/gateway-cloning/gateway-technology.html, page 16. ccdB, negative selection cassette included in donor and destination vectors. (b) Gibson cloning.
Source: Gibson (NEB). https://www.neb.com/applications/cloning-and-synthetic-biology/dna-assembly-and-cloning/gibson-assembly.
Gibson cloning
A recent development in cloning has been termed the Gibson Assembly method. This allows for the facile assembly of multiple overlapping DNA fragments. In this method, two or more fragments to be assembled are mixed together with a combination of three DNA enzymes—an exonuclease, a polymerase, and a ligase. The exonuclease removes the 5′ ends of the fragments to be joined, thereby exposing a 3′ single-stranded DNA overhang. Overlapping fragments then anneal via their 3′ overhangs, and the gaps and nicks are filled in by the DNA polymerase and DNA ligase, respectively. These fragments can be joined together in a one-step isothermal reaction. This powerful synthetic biology method can be routinely used to enzymatically assemble multiple DNA fragments of up to several hundred kilobases.20 For example, it was recently applied to synthesize the complete mouse mitochondrial genome, a size of 16.3 kilobases, using 600 overlapping fragments (Figure 4b).21
Gene probes and hybridization
We shall see in the following sections that what lies at the heart of gene analysis is the ability to identify a specific gene (or mRNA) in a complex mixture of all of the DNA (or RNA) in a cell or tissue. This can be done only when one already has a cloned fragment of DNA from the gene of interest. Such fragments are usually obtained from gene libraries constructed from genomic DNA or complementary deoxyribonucleic acid (cDNA) or generated using polymerase chain reaction (PCR, to be described below). These DNA fragments can be almost any size, from a fraction of the size of the gene (a few hundred or even fewer nucleotides) to the size of an entire gene (several thousand nucleotides). These cloned gene fragments are called probes because they are used to probe native DNA or RNA for the gene of interest.
To be useful, a gene probe must contain a sufficient number of nucleotides so that it will recognize the sequences of its corresponding gene. Recognition occurs by a process called nucleic acid hybridization, in which two pieces of DNA can align themselves (or “anneal”) by base pairing. Hybridization occurs by the specific pairing of A to T bases and of G to C bases (Figure 2). Perfectly matched sequences pair more tightly than sequences containing mismatches, and long-matched sequences pair more tightly than shorter matched sequences. Hybridization is the concept that underlies many molecular biology methods, such as Southern blotting, Northern blotting, microarray analysis, PCR, and others (see below).
Summary
Total genomic DNA can be cut into smaller pieces using restriction endonucleases that recognize specific nucleotide sequences. Individual genes can be captured from total genomic DNA and replicated in bulk for detailed analysis. This process is called cloning and employs bacterial plasmids and viruses (phage) as carriers for the cloned genes. Enzymes called DNA ligases join foreign DNA to plasmid or phage vectors, which can then replicate within bacterial cells to create gene libraries. Using nucleic acid hybridization, cloned genes can be used as probes to detect the presence of their native counterparts in complex mixtures of DNA or RNA.
Gene analysis: DNA
Southern blotting
One of the most useful techniques for analyzing a gene at the level of genomic DNA is Southern blotting, named for its inventor, E. M. Southern.22 In general, it allows one to determine whether specific nucleotide sequences in a cloned probe are present in a sample of genomic DNA. The presence of these sequences usually means that the gene itself is present in the genomic DNA. Figure 5 diagrams the technique. Purified genomic DNA is digested with a specific restriction endonuclease, which, as described earlier, will produce an array of differently sized DNA fragments. Electrophoresis through an agarose gel then separates these fragments according to size. (Because the phosphate groups in DNA make the molecules negatively charged, they will migrate toward the anode in an electric field. The semiporous agarose will allow molecules of DNA to pass with varying degrees of ease, at a rate inversely proportional to their size. At any time after electrophoresis begins, smaller molecules will be closer to the anode than larger molecules.)
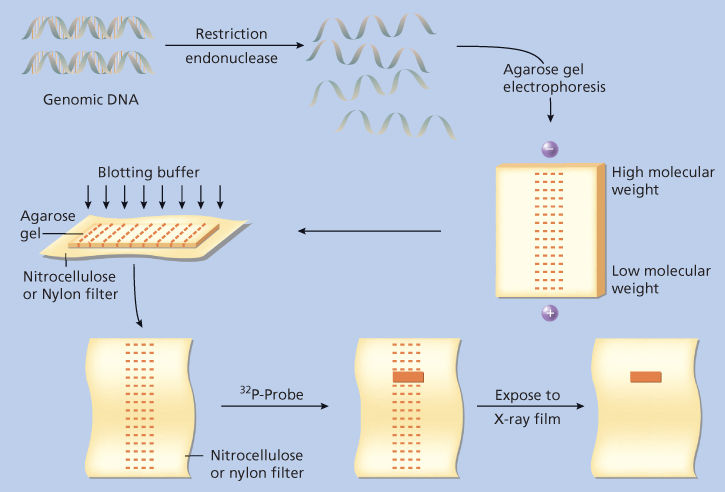
Figure 5 Genomic Southern blotting. Genomic DNA is digested with a single-restriction endonuclease, resulting in a complex mixture of DNA fragments of different sizes, that is, molecular weights. Digested DNA is arrayed by size using electrophoresis through a semisolid agarose gel. Because DNA is negatively charged, fragments will migrate toward the anode, but their progress is variably impeded by interactions with the agarose gel. Small fragments interact less and migrate farther; large fragments interact more and migrate less. The arrayed fragments are then transferred to a sheet of nitrocellulose- or nylon-based filter paper by forcing buffer through the gel as shown. The DNA fragments are carried by capillary action and can be made to bind irreversibly to the filter. Now the DNA fragments, still arrayed by size on the filter, can be probed for specific nucleotide sequences using a 32P-radiolabeled nucleic acid probe. The probe will hybridize to complementary sequences in the DNA, and the position of the fragment that contains these sequences can be revealed by exposing the filter to X-ray film.
The final goal of Southern blotting is to identify specific fragments of cut DNA using nucleic acid hybridization. Because the agarose gel used in electrophoresis is thick and the DNA fragments can move within it, DNA in the gel is not in a suitable form for further analysis. The DNA fragments must therefore be transferred to a solid support to which they are irreversibly bound to carry out nucleic acid hybridization studies. Thus, after electrophoresis, a paper-thin membrane microfilter (made of nitrocellulose or nylon) is placed over the flat portion of the gel. Liquid is then forced through the agarose gel in a direction perpendicular to the direction in which the DNA moved during electrophoresis. As the liquid perfuses the gel, it carries DNA fragments with it, depositing them on the membrane filter, to which the DNA sticks. After transfer, the DNA fragments are arrayed by size on the solid support.
At this point, a fragment of cloned DNA (the probe) is radiolabeled by using any of a variety of techniques. The membrane containing the transferred DNA is then soaked in a solution containing the radiolabeled probe. If there are any sequences in the genomic DNA that are complementary to those in the probe, the probe will hybridize to those sequences on the filter. The unbound probe can be washed away, and the remaining specifically hybridized probe can be visualized by exposing the filter to X-ray film.
What results from these studies is a pattern of one or more bands on an X-ray film. Each band corresponds to a restriction endonuclease-generated DNA fragment containing nucleotide sequences complementary to those in the radioactive probe. For any particular gene probe, the size (i.e., length) of the band it identifies will be the same from individual to individual (see below for a discussion of restriction fragment length polymorphisms [RFLPs], an important exception). Therefore, if a gene has undergone a structural rearrangement, the pattern may change.
As an example, suppose that the c-abl probe ordinarily recognizes a 2000-base EcoRI fragment in normal genomic DNA. If the translocation break point in a chronic myelogenous leukemia (CML) patient occurs within that fragment, part of the c-abl gene and one of its EcoRI sites will move to chromosome 22 from chromosome 9. Southern blot analysis of the patient’s DNA may now detect either (1) a larger fragment than normal if the recipient chromosome has an EcoRI site farther away than the old EcoRI site or (2) a smaller fragment if it has an EcoRI site closer than the old one. Southern blotting is thus a sensitive technique for detecting large structural rearrangements in the genome, such as those that are occasionally associated with malignancy.
Because the amount of the radiolabeled probe that hybridizes to a Southern blot is proportional to the number of copies of the specific gene present in the target DNA, this technique can also be used quantitatively. For example, in an analysis of primary breast cancer tissue, Southern blotting was used to determine that 30% of these samples contained multiple copies of HER-2/neu oncogene DNA—that is to say, the gene was amplified.23
Polymerase chain reaction (PCR)
To detect gene sequences by Southern blotting, at least 1–2 mg of genomic DNA are required. This translates into several milligrams of tissue that must be used fresh or freshly frozen. PCR is a powerful technique that can be used to amplify specific fragments of DNA, thus lowering the theoretic limit of detectable DNA sequences in a sample to a single molecule of DNA. With some advance knowledge of the nucleotide sequences in the DNA to be detected, microscopically small amounts of tissue, even a single cell, contain enough DNA to be amplified, and the amplified DNA can be easily used for downstream analysis. Even fixed tissue in paraffin blocks or on slides can yield sufficient DNA for analysis using PCR.24 The concepts underlying PCR are diagrammed in Figure 6. Two short single-stranded DNA fragments, called primers, are designed with sequences complementary to those that flank the stretch of DNA to be amplified. Primers and target DNA are mixed, the mixture is heated to dissociate the paired double strands of target DNA, and the temperature is then lowered to permit hybridization, or annealing, of the primers to their complementary sequences on the target DNA. A DNA polymerase enzyme is added to the mixture, which will add nucleotides to the 3′ end of the primers using the target DNA as a sequence template. This step generates one copy of each strand of one target DNA molecule. The mixture is heated again to dissociate the strands and then cooled to allow more primers to anneal to the target sequences on both the original and new pieces of DNA. DNA polymerase is added again and now generates four copies of the target sequences. These steps are repeated, resulting in a geometrically increasing amount of target DNA, that is, a chain reaction. With the discovery and cloning of the DNA polymerase from the thermophilic bacterium Thermus aquati (the “Taq polymerase”), which retains activity after being heated to 95°C, heating and cooling steps could be carried out on the same mixture without adding a new enzyme for each cycle.25, 26 This allowed the PCR procedure to be automated. There are now automated thermal cyclers in every molecular biology laboratory and in many clinical laboratories; these thermocyclers can take PCR mixtures through 20 to 50 cycles, producing large amounts of synthetic DNA from a tiny quantity of starting sample, to be used for subsequent analysis.
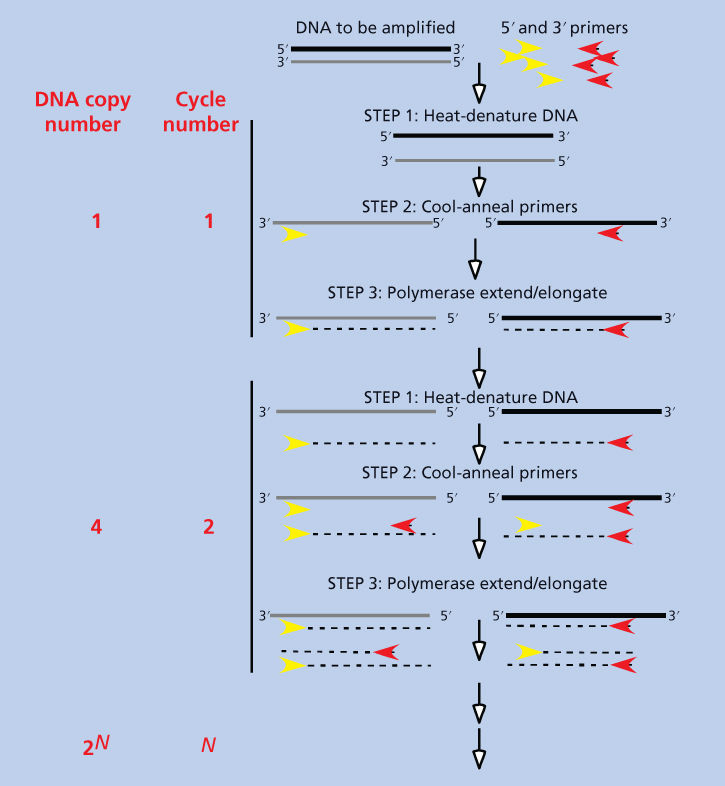
Figure 6 Polymerase chain reaction. DNA is mixed with short (10–20 base) single-stranded oligonucleotide primers that are complementary to the 5′ and 3′ ends of the sequence to be amplified. The mixture is heated to denature or “melt” all double-stranded DNA and then cooled to permit the primers to anneal to their complementary sequences on the DNA to be amplified. Note that the 5′ primer will anneal to the lower strand and the 3′ primer will anneal to the upper strand. A heat-resistant (thermostable) DNA polymerase (Taq polymerase; see text) was present in the original mixture, and it now synthesizes DNA by starting at the primers and using the strands to which the primers are annealed as a template. This results in the formation of two double-stranded DNA copies for every molecule of double-stranded DNA in the original mixture. The reaction is then heated to melt double-stranded DNA and cooled to allow reannealing, and the polymerase makes new double-stranded DNA again. There are now four double-stranded DNA copies for each original DNA molecule. This process can be repeated times (usually 20–50) to result in 2n copies of double-stranded DNA.
DNA polymorphisms
A genetic polymorphism (which literally means “many forms”) is defined as the occurrence of two or more relatively common normal alleles for a single locus. The difference between a polymorphism and a mutation is that a polymorphism occurs more commonly and is associated with a normal variant phenotype. The usual distinction is that a gene is polymorphic when its least frequent manifestation appears in at least 1% of the population. Examples include blood types and major histocompatibility complex molecules.
Polymorphisms need not necessarily be associated with an obvious phenotype. For example, changes in nucleotide sequence within introns or in regions between genes would not necessarily result in altered proteins and could therefore be “silent.” However, if these changes are polymorphic and frequent enough, then there is a high probability that an individual might be heterozygous for the polymorphism. In other words, it would be possible for the two chromosomes of a diploid pair to each carry a different version of the polymorphism. Then, if the chromosomal position of the polymorphic change were known, it could be used as a marker for mapping other genes. There are several varieties of DNA polymorphisms, and they provide the basis for gene mapping techniques that have identified the genomic locations of several important cancer genes.
RFLPs appear as differences among individuals in the pattern of bands on a Southern blot probed with a single cloned DNA. There are two mechanisms whereby DNA polymorphisms are detectable by Southern blotting. First, a single nucleotide change might either create or destroy the recognition site for a restriction endonuclease. This would cause an alteration in the Southern blot pattern of that gene when the DNA is digested with a particular restriction endonuclease. For example, if a stretch of DNA with the sequence…AGGATTTCGA…in one individual contained a single nucleotide change in a second individual so that the sequence was…AGGAATTCGA…, the recognition site for EcoRI (GAATTC) would be created in the second individual. Digesting the second individual’s DNA with EcoRI would generate two new restriction fragments and remove one old one when compared with the first individual’s DNA (Figure 3).
The second mechanism of RFLP involves one of the more mysterious features of genomic DNA in eukaryotes, namely, that it is replete with repeated sequences of unknown function. The sequences often stretch themselves along the DNA polymer, one set of sequences after the other, in so-called tandem repeats. In humans, the best known repetitive sequence is called Alu (because it contains recognition sites for the restriction endonuclease AluI); its nucleotide sequence is so specific to humans that it can be used to identify human DNA in a mixture of DNAs from many species. In many cases, the number of tandem Alu repeats varies among individuals.27 Therefore, if one does a Southern blot with a DNA probe that recognizes a restriction fragment containing tandem repeats, the size of that fragment may vary from one individual to the next. This type of RFLP is also called variable number of tandem repeats (VNTRs).
Both of these types of RFLPs are stably inherited in a Mendelian fashion, which permits them to be used in gene mapping. RFLPs occur at specific positions (loci) in genomic DNA. If all of the affected individuals in a family with a particular genetic disease inherit the same RFLP, there is presumptive evidence that the gene for the disease is close (or “linked”) to the RFLP locus. Linking a disease locus to an RFLP maps the location of the gene for that disease and is the first step toward cloning the gene responsible for the disease. These are the tools of reverse genetics, which have also led to the identification of many of the genes associated with malignant transformation. A prime example is the BRCA1 gene on chromosome 17, whose mutations are responsible for a relatively significant fraction of heritable breast cancer.28
RFLPs have also been used to demonstrate gene loss in cancer (Figure 7a). This approach relies on an individual being heterozygous for an RFLP, that is, having one polymorphism on one chromosome and another polymorphism on the other. If an individual with cancer is heterozygous for a particular RFLP (termed an informative individual), his or her tumor can be analyzed by Southern blotting, using the probe that recognizes the polymorphism, and compared with normal tissue analyzed the same way. If one of the RFLPs present in the heterozygous individual’s normal DNA is missing from the tumor cell DNA, the tumor is said to have undergone a reduction to homozygosity, or a loss of heterozygosity (LOH). This implies a loss of genetic material from the tumor, specifically the DNA that includes the missing RFLP. This is the hallmark of tumor suppressor genes, such as Retinoblastoma (Rb) or TP53.29, 30
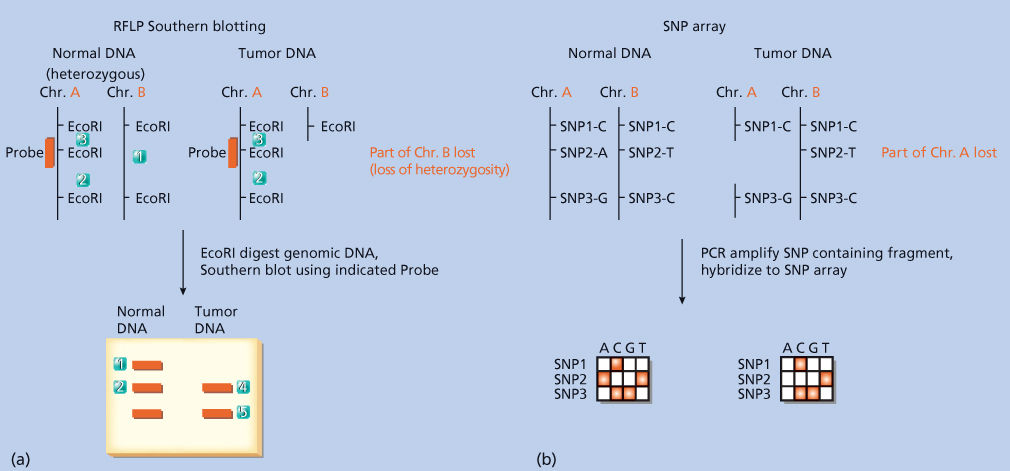
Figure 7 Methods to detect loss of heterozygosity in tumor tissue. (a) Restriction fragment length polymorphism (RFLP) and Southern blotting. In this example, an individual is heterozygous for an EcoRI recognition site: the second EcoRI site on chromosome A is absent on its diploid partner, chromosome B. The individual’s tumor is assumed to be clonal and to have arisen from a cell that lost the region of chromosome B displayed in the figure. Southern blotting can then be performed using genomic DNA from the individual’s normal DNA and tumor DNA in separate lanes of the agarose gel. Probing the DNA with the probe (indicated on the figure) reveals a heterozygous banding pattern in normal DNA (reflecting the presence of both polymorphisms, one on each chromosome pair) and a loss of that pattern in the tumor DNA. This is one of the hallmarks of a tumor suppressor gene. (b) Single nucleotide polymorphism (SNP) array. In this example, an individual is heterozygous for SNPs 2 and 3 and homozygous for SNP 1. Following the polymerase chain reaction (PCR) amplification of genomic fragments containing each SNP individually, these fragments are hybridized to an array composed of oligonucleotides complementary to the ones amplified. The loss of a heterozygous SNP signal on the array indicates loss of the chromosomal region containing this SNP.
Another type of interesting type of polymorphism is known as a microsatellite. For unknown reasons, about 50,000 copies of the repetitive sequence dC-dA (tandemly repeated 10–60 times) are dispersed throughout the human genome.31 Because the longer tandem repeats (VNTRs, as mentioned earlier) have been called minisatellite DNA, the shorter dC-dA repeats are called microsatellite DNA. (The term satellite refers to the fact that the buoyant density of repetitive DNA is different from the majority of genomic DNA. This leads to the appearance of small satellite bands distinct from the main DNA band when genomic DNA is purified by density gradient centrifugation.) The number of repeats at a particular locus varies in a polymorphic way among individuals, and because these sequences are stably inherited, they can serve as polymorphic markers. The difference in the number of repeat units between two polymorphic microsatellites can be as small as a few nucleotides. These differences cannot be detected by Southern blotting, which has a resolution of 100 nt. However, these differences can easily be resolved using PCR. Primers that flank the repeat region are used in a PCR in the presence of radiolabeled deoxynucleotides, and the products are separated on a DNA-sequencing-style polyacrylamide gel. Mini- and microsatellite polymorphic markers are much more useful in gene mapping than RFLPs because, unlike RFLPs, which usually have only two alleles, the variable number of repeats creates multiple alleles for each locus, significantly raising the likelihood that an individual will be heterozygous for the marker.
Although the number of repeats in a microsatellite marker is usually stable, in some cancers, most notably colorectal cancer, the number of microsatellite repeats in the tumors differs from that in normal colorectal tissue from the same patient. Because the variability in repeat number occurs at all positions throughout the genome of the tumor, this suggests that the tumors experience overall genetic instability.32, 33 The basis of this instability is believed to be a mutation in the human homologs of DNA “proofreading” genes that, when mutated in yeast, lead to the appearance of unstable numbers of dCdA repeats. One of these human genes, MSH2, which maps to chromosome 2, is responsible for hereditary nonpolyposis colorectal cancer.34, 35
Of course, a polymorphism need not create a restriction site, tandem repeat, or other obvious marker. Indeed, most common polymorphisms within the genome are so-called single nucleotide polymorphisms (SNPs).36 SNPs are single base variations within a coding or noncoding DNA sequence; they occur approximately once every 1350 base pairs in the average individual.37–39 Like the RFLPs and microsatellite polymorphisms discussed, analysis of SNPs can also be used to localize cancer-causing genes and to determine LOH in human cancers.
The major approach for LOH detection by SNP analysis is through the use of microarrays, or through sequencing (see below). In the microarray approach, genomic DNA is PCR amplified and hybridized to a microarray containing probes corresponding to large numbers of human SNPs. This permits the detection of chromosomal regions of LOH (i.e., regions containing tumor suppressors) as well as the detection of regions of amplification (i.e., regions containing oncogenes) (Figure 7b). SNP arrays provide a high-throughput and automatable method for large-scale copy number analysis.40, 41 Next-generation nucleotide sequencing methods (discussed in detail below) also allow for the inference of copy number alterations, which are characterized by changes in sequencing depth for a given locus in the cancer sample compared with the normal control.42 Both of these technologies can be employed on cells from paraffin-embedded tissue specimens, thereby allowing genomic studies on standard pathologic specimens.43
Nucleotide sequencing
Sanger sequencing
The nucleotide sequence within a gene’s coding region encodes the amino acid sequence of its corresponding protein. Thus, the nucleotide sequence of a gene can be used to predict the structure and function of its protein product. Historically, the major method used for sequencing DNA has been the “enzymatic chain termination” method devised by Sanger and colleagues.44 The chain termination method relies on properties of enzymes called DNA polymerases (Figure 8). These are enzymes that create new DNA polymers starting from individual nucleotides. However, for a DNA polymerase to work, it needs a template of single-stranded DNA on which to create the new polymer. DNA polymerase adds a new nucleotide to the 3′ end of a growing DNA chain, but the base of the new nucleotide must be able to base pair (i.e., be complementary) to the base on the template over which the polymerase is positioned. After the addition of that nucleotide, the polymerase moves to the next nucleotide on the template and adds a new nucleotide to the 3′ end of the growing chain. Again, the new nucleotide must be complementary to the next base in the template. When the process is completed, the DNA polymerase will have made a new DNA chain whose nucleotide sequence is completely complementary to the template DNA.
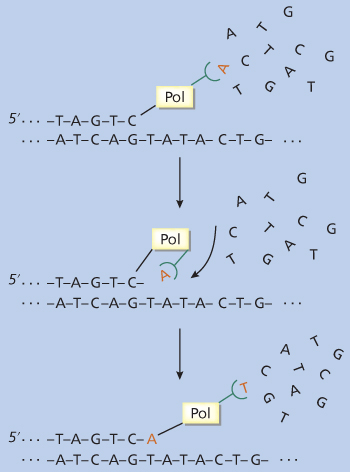
Figure 8 DNA polymerase. In this schematic, the enzyme DNA polymerase is creating a new DNA chain (upper strand) using a template (lower strand). Specific nucleotides are added from the 5′ to the 3′ direction as determined by the next nucleotide in the template.
Nucleotide sequencing is based on the observation that when DNA polymerase adds a synthetic abnormal nucleotide to a growing chain, the polymerization stops. The synthetic “terminating” nucleotides used most commonly are dideoxynucleotides that have no alcohol substitutions on the 3′ carbon of their deoxyribose groups and thus cannot be joined by a phosphate bridge to the next nucleotide (Figure 2). For example, in the presence of dideoxyadenosine triphosphate (ATP), chain termination will occur wherever an A appears in the new DNA sequence (a T in the template) (Figure 9). These reactions are performed in vitro in a test tube, where millions of new DNA molecules are being made at once. If normal deoxy-ATP is mixed with dideoxy-ATP in the proper proportion, only a few of these molecules will terminate at each T in the template. This will generate a series of new DNA polymers, each one stretching from the beginning of the chain to the position of an A (i.e., a T in the template). If the newly formed DNA is fluorescently labeled, the products can be separated electrophoretically in a polyacrylamide gel or capillary gel (see below). Each step of the ladder is a fragment of DNA that stretches from the start of the new polymer to the position of an A. Four separate reactions are performed using each of the four dideoxynucleotides, each coded with a distinct fluorescent color. The four reactions are run together in a capillary gel, and the order of nucleotides is read by the order of the different colors.
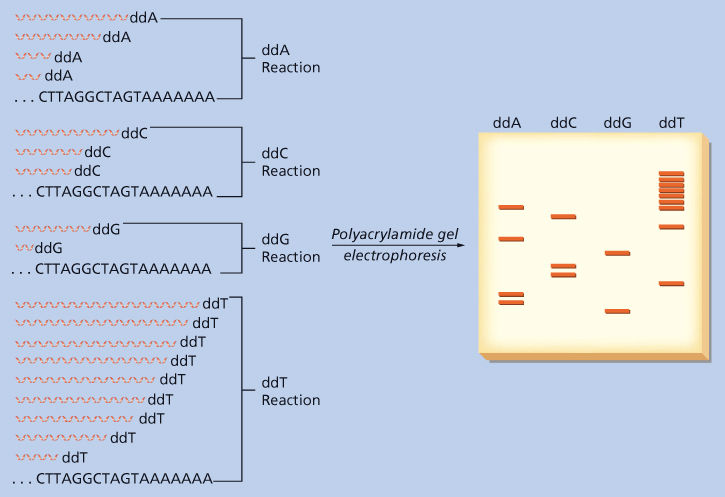
Figure 9 DNA sequencing using the chain termination method. In this example, DNA ending with the sequence CTTAGGCTAGTAAAAAAA is being analyzed. Four reactions are performed, each using this DNA as a template for a DNA polymerase reaction and each containing one of the four dideoxynucleotides (dideoxyadenosine triphosphate [ddA], dideoxycytidine triphosphate [ddC], dideoxyguanosine triphosphate [ddG], and dideoxythymidine triphosphate [ddT]). In each reaction, chain elongation will terminate when the dideoxynucleotide is incorporated at the position of its complementary nucleotide in the template. This will result in a family of chains of differing lengths that correspond to the position at which polymerization terminated. In this example, these chains can be resolved by electrophoresis through a urea-containing polyacrylamide gel, in which longer chains run near the top of the gel and shorter chains near the bottom. Each new chain is radioactively labeled, and after autoradiography, the pattern of bands can be read from X-ray film. By noting the order in which bands appear, starting at the bottom of the gel, one can read the sequence of the template by substituting the complement of each dideoxynucleotide at every position. Reading from the bottom yields GAATCCGATCATTTTTTT, and substituting the complementary base at each position yields CTTAGGCTAGTAAAAAAA, the sequence of the template. The use of fluorescent labels in capillary gel electrophoresis is conceptually similar.
Sanger sequencing has served as the backbone for a generation of biological discovery, and was instrumental to the Human Genome Project, which launched in 1990 and was completed in 2003. Following the successful assembly of the human genome sequence, genome researchers shifted their efforts from de novo to comparative sequencing. These studies have aimed to sequence the genome in both its normal and diseased states, with the aim of understanding the genomic changes associated with disease.
Perhaps the most active area of comparative sequencing has been in cancer genomics. Early sequencing studies targeted to particular genes or gene families identified key differences between the cancer and normal genomes; in many cases, these discoveries provided the rationale for targeted therapeutics. For example, the discovery of mutations in the c-kit protein tyrosine kinase gene by DNA sequencing of gastrointestinal stromal tumors (GISTs)45 led to the successful treatment of GIST with the c-kit inhibitor STI-571 or Gleevec.46 In lung adenocarcinoma, activating mutations in the epidermal growth factor receptor (EGFR) tyrosine kinase gene are common, especially in East Asian populations.47–49 These activating mutations have been shown to predict response to the kinase inhibitors gefitinib and erlotinib.47–49 Activating mutations in the BRAF serine-threonine kinase gene have been found in over half of all melanomas50 and subsequently in other cancer types, including colorectal, lung, and thyroid carcinomas. The BRAF inhibitor Vemurafenib leads to improved overall survival in patients with metastatic melanoma harboring an activating BRAF V600E mutation.51 Mutations in the phosphatidylinositol 3-kinase catalytic subunit gene PIK3CA mutations have been discovered in colorectal carcinoma, glioblastoma,52 and breast carcinomas. And in myeloproliferative diseases such as polycythemia vera, the JAK2 V617F activating mutation is a pathognomonic finding.53–55
Next-generation sequencing
More recent cancer genomics studies have employed “next-generation” sequencing technologies, which far surpass traditional Sanger sequencing in throughput, scale, and resolution. Next-generation sequencing methods allow for millions of short-fragment sequencing reactions to proceed in parallel.56–59 One of the biggest advantages of next-generation sequencing with respect to cancer genomics is the ability to effectively detect the numerous mutations present in a heterogeneous cancer sample,60 without the need for purification of a clonal DNA template. Indeed, next-generation sequencing assays have become the technology of choice for cancer mutation detection in the research arena and are beginning to be incorporated in clinical diagnostic testing as well.
Next-generation sequencing was employed to sequence the first cancer genome, acute myeloid leukemia, in 2008.61 Since then, the coding regions (exomes) or whole genomes of a number of other tumor types have been sequenced. Many of these efforts have been coordinated through the Cancer Genome Atlas (TCGA) and the International Cancer Genome Consortium (ICGC) initiatives.64
Most commercially available sequencing platforms fall under the category of “cyclic array sequencing.” This term refers to iterative cycles of enzymatic-based sequencing and imaging-based sequence detection, done in parallel on a large array of DNA molecules.58 A number of cyclic array sequencing methods currently exist, including those by Illumina (Solexa), Pacific Bio, 454/Roche, SOLiD, and Ion Torrent.
In all of the above approaches, the DNA sample to be sequenced is initially sheared into a library of small DNA fragments. Common adapter sequences are then ligated to each of the fragments, and these adapters are used as the initiating points for PCR-based amplification. This ultimately results in spatially clustered clonal amplicons of each fragment. The amplicons are then sequenced by synthesis, with imaging done at the end of each cycle across the entire array. In this manner, a large number of DNA fragments can be sequenced in parallel in a high-throughput fashion.58
Each of the cyclic array sequencing approaches differs in the method used to generate spatially-clustered PCR amplicons of DNA fragments and in the biochemistry underlying the sequencing process. There are also variations in read length, throughput, cost, and accuracy between the different methods. Currently, the Illumina sequencing platform is the most widely used for a majority of applications.62 Illumina sequencing generates clonal amplicons through a method known as “bridge PCR.” In this method, forward and reverse primers complementary to the adapter sequences are immobilized to a glass slide. PCR-based amplification results in a spatial cluster of approximately 1000 copies of each DNA fragment. Cyclic sequencing then occurs. In each cycle of sequencing, a DNA polymerase incorporates fluorescently labeled dNTPs with a reversible 3′ termination moiety. Similar to the Sanger sequencing concept, the 3′ termination moiety allows only a single base to be added to each fragment. All fragments (or “features”) are then imaged in four colors, with each color corresponding to one of the dNTP species. The reversible 3′ termination moiety is then cleaved, and then next cycle of sequencing begins anew. At the end of this process, one is able to obtain the DNA sequence for each of the many fragments, all sequenced in parallel (Figure 10).58
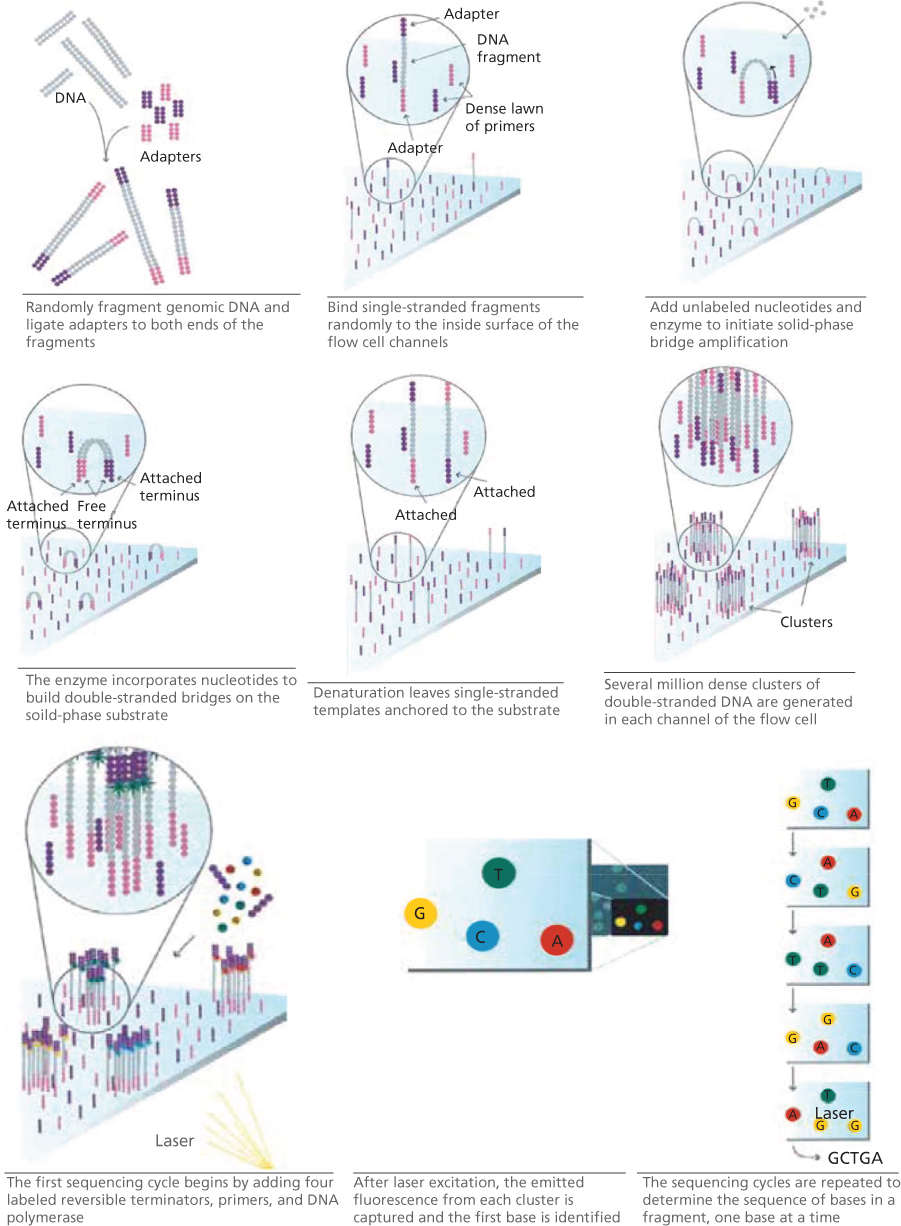
Figure 10 Next generation sequencing using Illumina platform. Source: http://openwetware.org/images/d/de/Illumina_sequencing.pdf. Used under CC BY-SA 3.0 http://creativecommons.org/licenses/by-sa/3.0/.
Target enrichment and clinical panel testing
While the methodology described above can be used to sequence an entire genome, this is not always technically or computationally feasible, cost-effective, or necessary. “Target enrichment” refers to the process whereby a nucleotide library is enriched for particular genomic regions of interest prior to sequencing. Target enrichment can be performed through a variety of methods, including PCR, molecular inversion, and hybrid capture; hybrid capture has emerged as the most popular method in most situations. An excellent review is available on this topic.63
In hybrid-capture target enrichment, oligonucleotide probes for genomic regions of interest are hybridized to a fragmented DNA library, and nonbinding fragments are washed away. The hybridization reaction may occur either on a surface (i.e., a slide) or in solution. In cancer genomics, hybrid capture technology is commonly used to reduce a full genome library to only those fragments that correspond to “exomes,” or the protein-coding genomic regions. So-called whole-exome sequencing reduces the total amount of DNA to be sequenced from 3 Gb to 30 Mb. This reduces computational demands, cost, and sequencing time while still elucidating the majority of somatic mutations likely to occur in human cancers.63, 64
As next-generation sequencing has decreased in cost and increased in reliability, it is being increasingly incorporated into clinical testing. Several institution-specific and commercially marketed targeted gene panel tests are currently available. These panels use target enrichment and next-generation sequencing technologies to sequence a selected set of cancer-driving genes with the aim of providing genomic data likely to influence prognostication or choice of therapy.
Bioinformatics approaches
Perhaps equally important as the sequencing technologies described above are the bioinformatics approaches for analyzing the data generated by those technologies. Once DNA sequences are obtained from a tumor sample and a matched germline control, the first step is to quality control the raw reads by removing low-quality sequences (usually at read ends) and removing the sequences corresponding to the adapters. The tumor and normal sample reads are then aligned to the reference genome using one of several available sequence alignment algorithms, and differences from the reference sequence are identified. In general, bioinformatics tools are then used to assess for three major types of alterations: single nucleotide substitutions or small insertion-deletions, copy number alterations, and structural rearrangements (Figure 11).42, 64
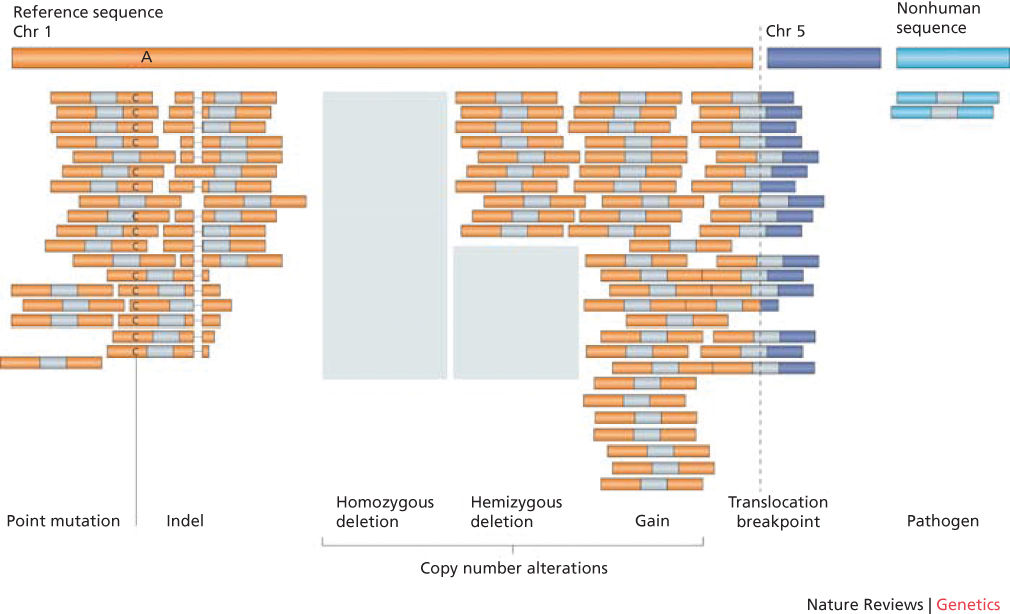
Figure 11 Types of genome alterations that can be detected by second-generation sequencing.
Source: Meyerson 2010.42 Reproduced with permission of Nature Publishing Group.
Single-nucleotide substitutions and small insertion-deletions
A single-nucleotide substitution or small insertion-deletion (“indel”) is detected as a change in the tumor sequence that varies in frequency from the germline control and from the reference genome. For example, germline mutations are generally found in a frequency of either 50% (if heterozygous) or 100% (if homozygous), but single-base substitutions within a tumor sample may be found at a range of frequencies, depending on the mutant allele fraction within the tumor tissue, the purity of the tumor sample, and the ploidy of the tumor. Ultimately, mutation calling is a statistical task and is based in the statistical significance of the number of mutation counts in the cancer sequence compared with the matched normal.42, 64 A number of somatic mutation calling tools exist, including MuTect,65 Varscan2,66 JointSNVMix,67 and MutSigCV.68 These and other mutation callers differ in their precise methodologies, but the general goal of all of them is to apply statistical methods to detect somatic mutations with low allele fractions with a high degree of specificity. The major causes of missed mutation calls include tumor admixture with normal tissue, intratumoral heterogeneity, and differences in ploidy. A fundamental advantage of next-generation sequencing over Sanger sequencing is that it is digital, rather than analog. This means that the same stretch of DNA can be read multiple times, allowing for “oversampling” or sufficient depth of coverage necessary to confidently call somatic alterations at a statistically significant level.42, 64
Copy-number variations
Next-generation sequencing affords the ability to interrogate copy-number changes at single-nucleotide levels, a significant increase in resolution over array-based technologies. In simplistic terms, copy number can be inferred from next-generation sequencing data by comparing the number of reads at a locus in the tumor sample to that in the normal control. Several bioinformatics tools for inferring copy number from next-generation sequencing data exist. These tools take into account the fact that copy-number reads within a given window must be normalized for sequence coverage in that region. This is critical, since coverage can vary across the genome based on GC content, ambiguously mapped reads, and other factors.64, 69
Structural rearrangements
Typically, sequence reads are obtained from both sides of a sequence. So-called paired-end sequencing allows one to determine whether the two ends of a sequenced fragment map to the reference genome at an expected distance from each other. When reads are “split,” the two ends of the read map to distinct parts of the genome. Interrogation of split reads can be used to identify intra- and interchromosomal rearrangements, inversions, duplications, and other structural changes.42, 70, 71
Summary
Genomic DNA is too large to be analyzed easily in the laboratory, but it can be cut into manageable fragments using restriction endonucleases isolated from bacteria. Electrophoresis through an agarose gel can separate these fragments by size. Fragments that carry nucleotide sequences corresponding to a gene of interest can then be detected by Southern blotting. Specific nucleotide changes (mutations) that give rise to stable genetic differences can be determined by DNA sequencing, which can be performed via either the traditional “Sanger” method or through next-generation methods. PCR technology permits the detection of specific genes in extremely small amounts of tissue. There are various types of polymorphic sites throughout genomic DNA; some create or destroy restriction endonuclease sites leading to RFLPs; others contain a variable number of tandemly repeated sequences and are called microsatellites; a third group, SNPs, represents single base variations. Nucleotide polymorphisms can be interrogated by microarray technology or next-generation sequencing methods to allow for gene mapping and cancer diagnostics. Next-generation sequencing can be used for high-throughput and high-resolution sequencing of cancer samples, thus allowing for the detection of low-frequency mutations, copy-number alterations, and structural rearrangements in heterogeneous tumor tissue.
Gene expression: mRNA transcript analysis
Structural considerations
The first step in gene expression is transcription of the genetic information from DNA into RNA. The individual building blocks of RNA, ribonucleotides, have the same structure as the deoxyribonucleotides in DNA, except that: (1) the 2′ carbon of the ribose sugar is substituted with an -OH group instead of H and (2) there are no thymine bases in RNA, only uracil (demethylated thymine), which also pairs with adenine by hydrogen bonding. Just like the DNA polymerases described earlier, the enzyme RNA polymerase II uses the nucleotide sequence of the gene’s DNA as a template to form a polymer of ribonucleotides with a sequence complementary to the DNA template.
For transcription to be “correct,” RNA polymerase II must (1) use the antisense strand of DNA as a template, (2) begin transcription at the start of the gene, and (3) end transcription at the end of the gene. The signals that ensure faithful transcription are provided to the RNA polymerase II by DNA in the form of specific nucleotide sequences in the promoter of the gene. After reading and interpreting these signals, the RNA polymerase generates a primary RNA transcript that extends from the initiation site to the termination site in a perfect complementary match to the DNA sequence used as a template. However, not all transcribed RNA is destined to arrive in the cytoplasm as mRNA. Rather, sequences complementary to introns are excised from the primary transcript, and the ends of exon sequences are joined together in a process termed splicing.72 In addition to splicing, the primary transcript is further modified by the addition of a methylated guanosine triphosphate “cap” at the 5′ end73 and by the addition of a stretch of anywhere from 20 to 40 adenosine bases at the 3′ end (poly-A tail).74 These modifications appear to promote the translatability75, 76 and relative stability of mRNAs and help direct the subcellular localization of mRNAs destined for translation.
Northern blotting
The fundamental question in the analysis of gene expression at the RNA level is whether RNA sequences derived from a gene of interest are present in a cell type of interest under conditions of interest. Detecting specific RNA sequences can be accomplished by Northern blotting, the whimsically named RNA analog of Southern blotting. RNA can be isolated from cells in its intact form, free from significant amounts of DNA.77 mRNA is much smaller than genomic DNA, so it can be analyzed by agarose gel electrophoresis without the enzymatic digestion steps that are necessary for the analysis of high-molecular-weight DNA.
RNA is single stranded and has a tendency to fold back on itself. This allows complementary bases on the same stretch of RNA to base pair with each other and to form what is termed secondary structure. Because secondary structure can lead to aberrant electrophoretic behavior, RNA is electrophoretically separated by size in the presence of a denaturing agent, such as formaldehyde or glyoxal/dimethyl sulfoxide. After electrophoresis through a denaturing agarose gel, the RNA is transferred to a nitrocellulose or nylon-based membrane in the same manner as DNA for Southern blotting (Figure 5). Hybridization schemes and blot washing are essentially the same for Northern blotting as for Southern blotting. In this manner, specific RNA sequences corresponding to those in cloned DNA probes can easily be identified.
There is a lower limit to the sensitivity of Northern blotting so that only moderately abundant mRNAs can be detected using this technique. One way to increase the sensitivity of Northern blotting is to enrich the RNA preparation for mRNA. Ordinarily, mRNA makes up <10% of the total RNA content of a cell or tissue; the remainder is made up primarily of ribosomal RNA and transfer RNA. An RNA preparation can be enriched for mRNA species by removing all RNA molecules that lack the 3 poly(A) tail.78 This can be done by exposing the RNA preparation to a tract of poly(U) or poly(T) bound to an immobilized support, such as a plastic bead. The poly(A) portion of mRNA will bind to the poly(U) or poly(T) material, and non-poly(A)-containing RNA can be washed away. After washing, the poly(A)-containing mRNA can be recovered from the solid support and used in Northern blot analysis. This procedure improves the sensitivity of Northern blotting by nearly two orders of magnitude.
A dramatic use of Northern blotting in cancer research has been the demonstration of oncogene expression in some human tumors. RNA was isolated from human tumor samples and analyzed by Northern blotting using cloned DNA probes derived from various oncogenes. The earliest observations included expression of c-abl and c-myc in human tumor cell lines and leukemic blasts.79, 80 Since these early discoveries, a large number of proto-oncogenes have been shown to be transcribed in primary human tumor tissue.
Complementary deoxyribonucleic acid
The flow of genetic information usually runs from DNA to RNA to protein, according to the so-called central dogma of molecular biology. There are, however, exceptions to this rule, the most prominent of which involves the life cycle of retroviruses. These viruses encode their genetic information in RNA rather than in DNA. When they invade a susceptible host cell, they direct the synthesis of a DNA intermediate that is a complementary copy of their genomic RNA. The enzyme that accomplishes this task, reverse transcriptase, is a DNA polymerase (see above) that uses RNA, rather than DNA, as a template to form a cDNA copy of the RNA.81, 82 This enzyme can be used in vitro to make cDNA copies of any available RNA.
One important application of cDNA synthesis has been the construction of cDNA libraries, which are basically gene libraries consisting only of the genes that are expressed in a cell or tissue of interest.83, 84 Most of the time, one is not really concerned with all of the DNA in the genome, as a large proportion of the cell’s DNA is composed of intronic sequences, promoters, and vast regions of “noncoding” DNA that lies between genes. Therefore, one way to construct a library comprising only tissue-specific expressed genes is to clone all of the mRNA in a specific cell or tissue of interest. Practically speaking, this is done by using all of the mRNA in a cell as a template for making double-stranded cDNA, which can then be inserted into a cloning vector.
To make a cDNA library, one isolates all of the mRNA from a cell or tissue. Then, using this mRNA as a template, reverse transcriptase is used to make cDNA copies of each mRNA molecule in the mixture. The cDNA is ligated into a plasmid or phage vector as described earlier (Figure 3), and the recombinant vectors are introduced into bacteria. After growth on agar plates, each bacterial colony or phage plaque of a cDNA library houses a unique recombinant vector containing the cDNA copy of a single mRNA transcript. Desired clones can be detected by nucleic acid hybridization to the plaques or colonies using a radiolabeled gene probe.85, 86 Alternatively, if the vector containing the cDNA molecules can direct transcription of mRNA by host bacterial cells, mRNA will be synthesized, and that mRNA will be translated. In this case, each bacterial colony or plaque will produce a different protein, and each protein will have been encoded by an mRNA from the original cell or tissue being investigated. If an antibody directed against a protein of interest is available, the cDNA clone corresponding to the mRNA that encodes that protein can be identified by binding the antibody to the colonies or plaques of the cDNA library. This technique, called expression cloning, often employs the bacteriophage λgt11 as the cloning vector.87
cDNA libraries can be used to clone cDNA for a known gene to discover the sequence of the mRNA it encodes. One application of this is the generation of expressed sequence tag databases by sequencing clones of various cDNA libraries. Alternatively, cDNA libraries can also be used to identify previously unknown genes. In a process called differential screening, cDNAs that owe their existence to a particular differentiation or activation state in the cell of origin can be discovered. For example, this technique has been used to identify genes whose expression is turned on by hormones or by growth factors.88
Sequence-based gene expression profiling
The most comprehensive way to display a unique pattern of gene expression that determines the identity of a cell or tissue would be to construct a cDNA library from it and sequence every clone. This was originally thought to be an impossible task and, historically, a technique called serial analysis of gene expression (SAGE) was developed to approximate this goal. In SAGE, the investigator sequences a small and unique fragment (10–17 nucleotides in length) of each expressed gene (called a SAGE tag) and quantifies the number of times it appears (called the SAGE tag number). The SAGE tag numbers, therefore, directly reflect the abundance of the corresponding transcript.
The sensitivity and the quantitative accuracy of SAGE are theoretically unlimited. The generation of a SAGE library does not require any prior knowledge of what genes are expressed in the cell of interest. Therefore, SAGE is able to detect and quantify the expression of previously uncharacterized genes.
The generation of a SAGE library used to be a technically challenging multistep procedure that has been described in detail elsewhere.89 However, it has become much more feasible with (and, in many cases, has been replaced by) the emergence of single-molecule sequencing platforms.56 Figure 12 outlines the essence of the method.
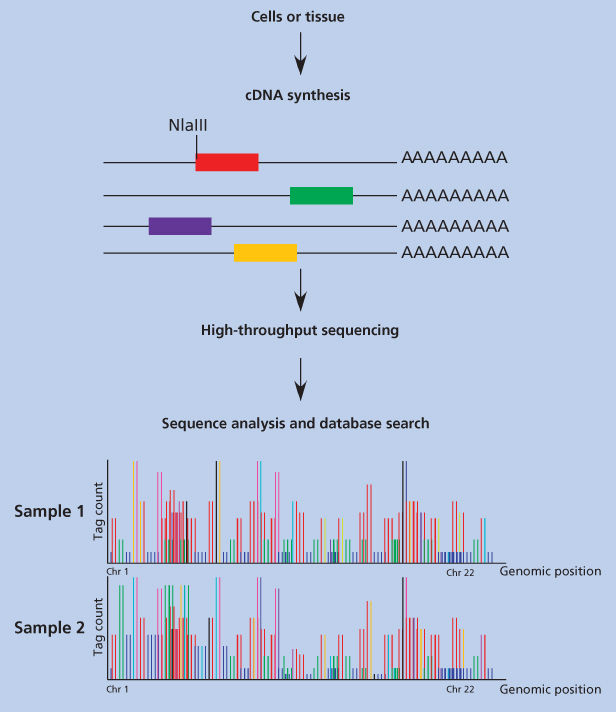
Figure 12 Construction and analysis of serial analysis of gene expression (SAGE) libraries. In step 1, a complementary deoxyribonucleic acid (cDNA) library is constructed from the cells or tissue of interest, and the cDNAs are immobilized on magnetic beads at their three ends. In step 2, the cDNAs are subjected to restriction enzyme digestion with a so-called anchoring enzyme. This anchoring enzyme is a frequent cutter restriction endonuclease (usually NlaIII) that ensures that all of the cDNAs are cut at least once. Subsequently another linker that contains a recognition site for a tagging enzyme is ligated to the cDNA ends. This tagging enzyme is a type two restriction endonuclease (usually MmeI) that cuts at some distance to the three sides of the actual recognition site. These tags are then directly processed for single-molecule DNA sequencing platform. Data are analyzed by using software that reads the sequence obtained, derives the tags, matches them to their cognate cDNA, and gives the gene expression profile in a numeric format.
SAGE has been used for the comparison of gene expression profiles of different cell types from normal and tumor tissue90 and is one of the techniques that was used by the National Cancer Institute–funded Cancer Gene Anatomy Project (CGAP),91 an international database aimed at cataloging the genes expressed in various normal and cancerous tissue types. SAGE libraries generated as part of the CGAP project are deposited on the National Center for Biotechnology Education/CGAP SAGE map Web site (http://cgap.nci.nih.gov/SAGE).91, 92
DNA microarray analysis
Another approach to comparative gene expression profiling employs the use of DNA microarrays, often referred to as DNA chips. Two basic types of DNA microarrays are currently available: oligonucleotide arrays93, 94 and cDNA arrays.95, 96 Both approaches involve the immobilization of DNA sequences in a gridded array on the surface of a solid support, such as a glass microscope slide or a silicon wafer. In the case of oligonucleotide arrays, 25-nt-long fragments of known DNA sequence are synthesized in situ on the surface of the chip using a series of light-directed coupling reactions similar to photolithography. Using this method, as many as 400,000 distinct sequences representing over 18,000 genes can be synthesized on a single 1.3 × 1.3 cm microarray. In the case of cDNA microarrays, cDNA fragments are deposited onto the surface of a glass slide using a robotic spotting device. For both microarray approaches, the next step involves the purification of RNA from the source of interest (e.g., from a tumor), enzymatic fluorescent labeling of the RNA, and hybridization of the fluorescently labeled material to the microarray. Hybridization events are then captured by scanning the surface of the microarray with a laser-scanning device and measuring the fluorescence intensity at each position in the microarray. The fluorescence intensity of each spot on the array is proportional to the level of expression of the gene represented by that spot. This process is illustrated in Figure 13.
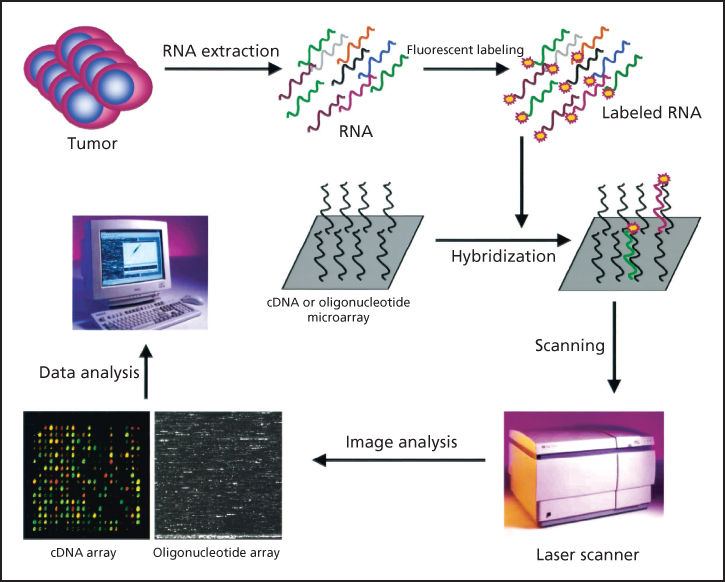
Figure 13 DNA microarray analysis. In this example, RNA extracted from a tumor is end labeled with a fluorescent marker and then allowed to hybridize to a chip derivatized with complementary DNA (cDNAs) or oligonucleotides, as described in the text. The precise location of RNA hybridization to the chip can be determined using a laser scanner. Because the position of each unique cDNA or oligonucleotide is known, the presence of a cognate RNA for any given unique sequence can be determined.
Microarray analysis has proved to be a powerful method for the analysis of gene expression patterns in human cancer and for cancer classification. Gene expression profiles have been used for class prediction, for determining which samples belong to which tumor class, and for class discovery of new tumor types. The first proof of principle for gene expression analysis in cancer was the demonstration that acute myeloid leukemias and acute lymphoid leukemias could be accurately distinguished on the basis of their gene expression profile97 Since then, new cancer classes have been discovered in leukemias,98 lymphomas,99, 100 brain cancer,101 breast cancer,102, 103 prostate cancer,104, 105 lung cancer,106, 107 and others.
The challenge in interpreting microarray data is in recognizing meaningful gene expression patterns and in distinguishing those patterns from noise. Such noise (random gene expression levels) can be generated by (1) variability among microarrays, (2) variability in RNA labeling and hybridization methods, and, perhaps most importantly (3) biologic variability among samples. It is likely that all of the above sources of variability are significant. Many of the problems associated with array-based technologies are eliminated with the use of sequence-based methods described below in the section titled “Transcriptomic Sequencing”. Thus, as sequencing technologies have improved and become more affordable and widely available, microarray technology has become less used.
Reverse-transcriptase polymerase chain reaction (RT-PCR)
Another important use of cDNA technology has allowed PCR to be applied to RNA. Because the Taq polymerase is a DNA polymerase (see above), it cannot use RNA as a template. Therefore, simply adding primers and Taq polymerase to an RNA preparation will not result in amplification. However, if an RNA of interest is made into cDNA, then PCR can proceed as usual.
The first step in this analysis is generating a cDNA copy of the mRNA of interest using reverse transcriptase. This can be done using a primer consisting of Ts (complementary to the poly(A) tail) or of another sequence complementary to some portion of the 3′ region of the mRNA. Once the single-stranded cDNA is produced, it can be amplified in a standard PCR reaction using Taq polymerase as described earlier (Figure 6). In one of the first applications of this technique, Philadelphia-chromosome-positive leukemias were diagnosed by identifying chimeric bcr-abl mRNA species in clinical material using PCR. Since then, so-called reverse transcriptase polymerase chain reaction (RT-PCR) has come into widespread clinical and laboratory use.108
One inherent problem in using standard PCR to monitor mRNA expression is quantitation of the amplified PCR products. In Northern blotting analysis, the intensity of the hybridization signal is directly proportional to the amount of target RNA in the sample. Thus, one can compare the number of RNA molecules in one sample with another. With PCR, however, a slight change in the efficiency of polymerization in an early cycle in one sample will lead to a geometrically increasing discrepancy between the amount of amplified product in that sample compared with another sample, and the amounts of PCR product when the reaction reaches saturation can also differ significantly. Fortunately, a number of techniques have been described for normalizing the products of PCRs to allow quantitative comparisons.
Most notably, quantitative real-time PCR109 is a method for continuous monitoring of amplification. This method makes quantitative comparisons of amplifications during the unbiased linear range in which each cycle gives a constant increase in amplification. In one common method of quantitative real-time PCR, a fluorogenic probe that contains a fluorescent tag on one end and a quencher on the other end is designed within the amplified region. Amplification leads to digestion of the probe, thus liberating a free fluorescent molecule; the increase in fluorescence with each cycle is measured, and it is proportional to the amplification.
Transcriptomic sequencing
A major advance in analysis of the transcriptome has been the development of RNA-sequencing technology. RNA-sequencing (RNA-Seq) allows for precise characterization of the transcripts present in a cell at single-nucleotide resolution. While microarray analysis, SAGE, quantitative RT-PCR, and Northern blotting can all be used to quantify known transcript abundance, RNA-Seq also allows for novel transcript discovery. This affords the ability to discover new classes of RNA species, to analyze alternative-splicing patterns, and to interrogate RNA-editing and other RNA-processing events.
To perform RNA-Seq, total RNA is first isolated from a sample of interest. Most commonly, polyadenylated RNA is then selected from the total RNA population, although other types of enrichment for different RNA species (i.e. small RNAs, as shown in Figure 14) can also be performed. Once the RNA subtype of interest has been selected from the total RNA population, this RNA is then fragmented and reverse transcribed into cDNA using a reverse transcriptase. Once cDNA is produced, it can be amplified and sequenced using the next-generation platforms described above. Typically, 50–200 million short reads are produced from an RNA-Seq run, with most read lengths in the 50–250 bp range (Figure 14).110
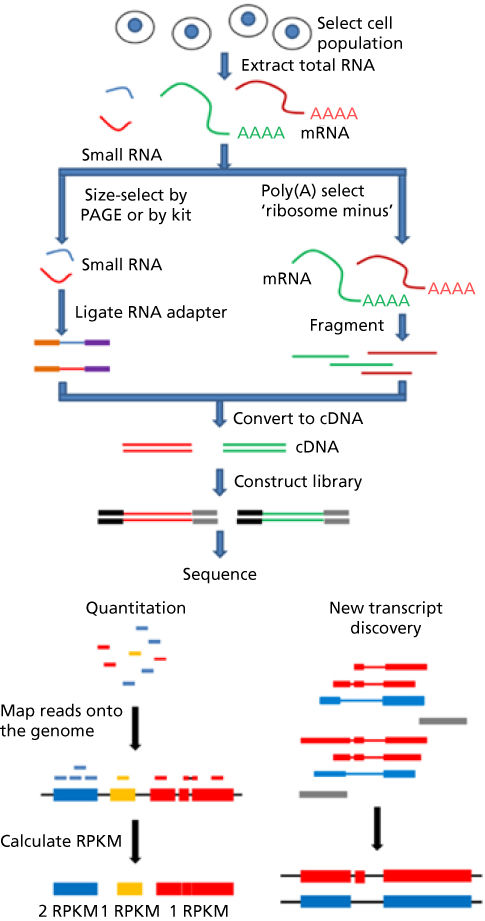
Figure 14 RNA-seq work flow.
Source: Zeng 2012.110 Reproduced with permission of Nature Publishing Group. RPKM, reads per kilobase per million mapped reads.
After these short RNA sequences have been obtained, they must be “assembled” to reconstruct the transcripts that comprise the transcriptome. This is usually done by aligning the reads to a reference genome. The use of paired-end reads—or fragments that are sequenced from both ends—allows for higher quality sequencing data, and is more likely to produce faithful alignments to the reference genome. Read alignments are then assembled into transcript models using computational methods, and expression levels of individual transcripts are then quantified. A common unit used to quantify transcript expression level is “RPKM,” or reads per kilobase per million mapped reads.111–113
RNA-Seq offers the ability to quantify transcript abundance, as well as the opportunity to identify unannotated transcripts, splice variants, gene fusions, nonhuman transcripts, and somatic mutations, among other events. This is a significant advantage over microarray analysis, which is limited by a defined set of predesigned probes.110 Therefore, RNA-Seq has begun to supplant microarray technology as a method for studying transcriptomes.
Clinical application of gene expression profiling
A number of gene-expression-profiling-based diagnostic tests have been approved by the Federal Drug Administration (FDA), and these are increasingly being incorporated into the clinical management of patients diagnosed with early-stage breast cancer.114, 115 Examples include the Oncotype DX,116 Mammaprint,117 PAM50,118 and the H : I ratio Breast Cancer Index.119 Each of these tests uses the expression level of a set of genes (ranging in number from two genes in the Breast Cancer Index to 70 genes in the Mammaprint assay) to provide prognostic information about a patient’s breast cancer recurrence risk. These and other expression-based tests vary in their clinical utility, indications, and diagnostic validity. Of these tests, the Oncotype DX, or 21-gene recurrence score, is the most widely used and has been incorporated into management guidelines from the American Society of Clinical Oncology (ASCO).
The Oncotype DX score was developed on the basis of testing of the expression of a candidate gene set (250 cancer-related genes) by quantitative real-time PCR in fixed tissue from a large number of patients collected from three different datasets. The score was then validated in an independent dataset derived from samples banked on the NSABP B-14 trial, a large prospective randomized trial designed to test the benefit of adjuvant tamoxifen in hormone-receptor-positive, node-negative breast cancer.116 It was found that a gene signature composed of 21 genes predicted 10-year breast cancer recurrence. The expression levels of these 21 genes measured by quantitative RT-PCR are fed into an algorithm and used to produce a number between 0 and 100, which is termed the recurrence score. The recurrence score is categorized into low (score <18), intermediate (score >18 but <30), and high (score ≥30). Several follow-up studies in various cohorts have confirmed that the Oncotype DX recurrence score is among the best-validated prognostic assays available. It is currently used to guide prognosis in women with node-negative, estrogen receptor (ER)-positive breast cancer, and to inform the decision about whether these women are likely to glean benefit from adjuvant chemotherapy. In practice, those women with a low recurrence score have a favorable prognosis and are unlikely to derive a significant absolute benefit from adjuvant chemotherapy.
As more and more genomic and transcriptomic data is generated and curated, there has been increasing effort placed on developing molecular prognostic tests for a variety of tumor types. It is important to carefully consider the clinical utility, exact indications, and precisely defined patient population for application of these tests. At present, the molecular prognostic profiles available can supplement, but not replace, clinical prognostic factors.
Summary
The genetic information in DNA is copied, or transcribed, into mRNA by the enzyme RNA polymerase II. Before being transported to the cytoplasm, primary transcripts in the nucleus are modified by splicing out introns, adding a 5′ cap and adding a 3′ poly(A) tail. A retroviral enzyme called reverse transcriptase can be used to make cDNA copies of mRNA transcripts. These cDNAs can be cloned into cDNA libraries, which are useful for isolating and analyzing expressed genes. The expression level of cytoplasmic mRNA can be interrogated using a variety of techniques, including Northern blotting, RT-PCR, microarray analysis, and transcriptomic sequencing (RNA-Seq). Rapid developments in microarray and RNA-Seq technologies have made clear that the successful elucidation of genetic networks through expression profiling requires the expertise of a new generation of scientists, namely, computational biologists. Gene expression profiles of tumors may be used to guide treatment planning of individual cancer patients in a personalized fashion.
Epigenetic regulation
In recent decades, the search for genes implicated in tumorigenesis focused on genes that are genetically altered in tumors. However, recent progress in understanding the role of epigenetic regulation of tumor suppressor genes and oncogenes suggests that epigenetic modifications are also likely to play a role in tumorigenesis. Epigenetic modifications affect the expression of genes without causing any alterations in DNA sequence. Epigenetic regulatory programs depend on DNA methylation, chromatin (histone) modification, and noncoding RNAs. Each of these mechanisms has been shown to play a role in regulating cellular differentiation and tumorigenesis. For example, DNA methylation has been demonstrated to play an important role in silencing gene expression, imprinting, and X-chromosome inactivation.120–122 Inherited defects in DNA methylation and imprinting result in developmental defects and increase the risk of tumorigenesis. Recent data also implicate DNA methylation and chromatin changes as initiating events in neoplasia preceding the occurrence of genetic alterations.123–125 This was experimentally proved in mice by introducing into the germline a hypomorphic allele of the DNA methyltransferase gene DNMT1, which led to 90% decrease in DNA methylation and subsequently to cancer development.126
The increased interest in analyzing epigenetic modifications led to the development of novel technologies that allow the analysis of these changes in a comprehensive manner and at a genome-wide scale. Methylation-sensitive arbitrarily primed polymerase chain reaction (MS-AP-PCR),127 methylated CpG island amplification followed by restriction difference analysis (MCARDA),128 CpG island arrays coupled with differential methylation hybridization (DMH),129 restriction length genome scanning (RLGS) using methylation-sensitive enzymes,130 methyl-CpG-binding domain affinity chromatography,131 and gene expression profiling following demethylation/deacetylation treatment,132 all have been successfully used for the identification of novel methylated loci in different cancer types.133 Methylation-specific digital karyotyping (MSDK) is a sequence-based technology that enables comprehensive and unbiased genome-wide DNA methylation analysis.134 Using a combination of a methylation-sensitive mapping enzyme (e.g., EagI) and a fragmenting enzyme (e.g., NlaIII), short sequence tags can be obtained and uniquely mapped to genome location. The number of MSDK tags obtained from a sample reflects the methylation status of the mapping enzyme sites.
DNA methylation and chromatin modification are interrelated processes and noncoding RNAs may link the two processes together.133, 135 In the past several years, the number and type of known histone modifications increased dramatically, and a large set of enzymes that play a role in mediating these processes has been identified. The four core histones (H2A, H2B, H3, and H4) have been found to subject to various posttranslational modifications, including acetylation, methylation, phosphorylation, ubiquitination, sumoylation, ADP ribosylation, deimination, and proline isomerization. Most of these modifications regulate transcription by influencing the recruitment of other proteins, and a few of them are also involved in DNA repair and chromatin condensation. Using antibodies specifically recognizing methylated histone H3-lys9 and the recently developed ChIP-on-chip,136 GMAT (genome-wide mapping technique),137 and ChIP-Seq138 technologies, it is now possible to analyze heterochromatin changes at a genome-wide scale.
Several recent studies suggest that cancers display a profound genome-wide epigenetic dysregulation.139 Interestingly, several large-scale cancer genome sequencing projects have also revealed somatic mutations in epigenetic modifier proteins. Examples include mutation of the DNA methyltransferase DNMT3A in acute myeloid leukemia,140, 141 mutation of enzymes involved in DNA demethylation (e.g., TET2, IDH1, IDH2) in myeloid leukemias and gliomas,142–144 mutation of the histone methylatransferase SETD2 in renal cell carcinoma,145 mutation of the histone demethylase KDM6A in bladder cancer,146 and many others. This highlights the fact that tumorigenesis is likely promoted through cooperation between aberrant epigenetic modifications and genetic mutations, with the genetic mutations at times occurring in the epigenetic modifiers themselves.
Summary
The role of epigenetic programs in tumor initiation and progression is becoming increasingly clear. It is likely that epigenetic alterations may precede genetic events and promote the acquisition of genetic changes. Rapidly evolving technology now allows for analysis of epigenetic marks on a genome-wide scale. Cancer genome sequencing initiatives have identified recurrent mutations in a number of epigenetic modifier proteins. Because epigenetic programs are reversible and targetable with inhibitors of DNA and histone modifier enzymes, the efficacy of epigenetic therapy is currently being tested in several different cancer types.
Gene expression: protein analysis
Structural considerations
Proteins are polymeric molecules consisting of amino acids linked by peptide bonds. The sequence of amino acids in a protein is dictated by the sequence of nucleic acids in the mRNA that encodes the protein. Because amino acids are joined to each other in a linear polymer, there is directionality to proteins, just as there is to DNA and RNA. The 5′ end of the mRNA corresponds to the amino end of its cognate protein and the 3′ end corresponds to the carboxy end (Figure 1).
For many proteins, the linear polymer of amino acids must undergo a number of alterations to be functional. These alterations are referred to as posttranslational modifications. For example, proteins destined to be secreted from a cell initially exist as propeptides with a 20- to 30-amino acid sequence at their amino ends. This highly hydrophobic tail, called a leader sequence, remains embedded in the membranes of the endoplasmic reticulum and secretory granule until the protein is to be secreted, at which point, the leader sequence is cleaved. There are many examples of propeptides that undergo cleavage of specific amino acids before they become mature, functional proteins.
Other posttranslational modifications include the addition of various nonpeptide substituents to the side chains of amino acids. These include simple and complex carbohydrate chains, sulfate groups, and phosphate groups. Phosphorylation of intracellular proteins, usually on serine, threonine, or tyrosine residues, plays an important regulatory role in protein function. For example, many of the cell surface receptors for growth factors, such as the platelet-derived growth factor (PDGF) receptor147 and the receptor for macrophage colony-stimulating factor (M-CSF)148, 149 are themselves protein tyrosine kinases. When this type of receptor binds its ligand, the receptor undergoes a conformational change that activates its kinase activity. The activated receptor then adds phosphate groups to some of its own tyrosine residues and to tyrosines in other proteins. These phosphorylations are part of the signal transduction process, whereby a message is sent from the cell surface receptor to the nucleus. The importance of tyrosine phosphorylation in cell growth may be reflected in the fact that tyrosine kinases form the largest functional subset of oncogenes. Tyrosine kinase inhibitors, such as imatinib mesylate or Gleevec, which blocks the action of the c-abl and c-kit tyrosine kinases, have been proved as effective anticancer chemotherapeutic treatments.46, 150
Sodium dodecyl sulfate-polyacrylamide gel electrophoresis
As with nucleic acids, the most common analytic technique applied to proteins is separation by size using electrophoresis. However, unlike nucleic acids, not all proteins are anionic, and they do not have a uniform charge-to-mass ratio. In the presence of an electric field, a mixture of unmodified and uncharacterized proteins would migrate in an unpredictable way, providing little or no information about their structures. This problem has been overcome by performing protein electrophoresis in the presence of the anionic detergent sodium dodecyl sulfate (SDS). SDS binds to proteins in a uniform way, at approximately one molecule of SDS for every two amino acids. Thus, all proteins become polyanions in the presence of SDS, and the number of negative charges (supplied by the sulfate group in SDS) is directly proportional to the size, or molecular weight, of the protein.
Because proteins are generally smaller than the most commonly analyzed nucleic acids, electrophoresis is performed through a solid support made of polyacrylamide, which resolves low-molecular-weight molecules better than agarose. In the presence of an electric field, proteins in SDS will migrate toward the anode at a rate inversely proportional to the log of their molecular weights.151 Proteins can be analyzed by sodium dodecyl sulfate-polyacrylamide gel electrophoresis (SDS-PAGE) in the presence or absence of β-mercaptoethanol (β-ME), which reduces sulfhydryl groups on the side chains of cysteines that can bind two separate protein chains together. Electrophoresis in the presence of β-ME permits the analysis of protein subunits, whereas electrophoresis in the absence of β-ME can reveal multimeric protein associations. SDS-PAGE is routinely employed to test the purity of a protein preparation. It is also an integral component of the techniques of immune precipitation and Western blotting, discussed below.
Immunoblotting
One of the most valuable immunologic identification techniques is immunoblotting (Figure 15a).152 A mixture of proteins can be electrophoretically separated by SDS-PAGE, and the separated proteins can be transferred to a nitrocellulose or nylon-based filter by electrophoresis in a direction perpendicular to that of the first electrophoresis. The proteins will remain bound to the membrane support. By analogy to Southern blotting for DNA and Northern blotting for RNA, this technique for protein transfer has been called Western blotting. The protein blot can be soaked in a solution that contains a specific antibody that binds to the protein of interest. The presence of the bound antibody on the blot can then be detected if the antibody is labeled. The label can be an enzyme that reveals its presence by catalyzing a color or light-emitting reaction, or it can be a radionuclide, such as 125I, that can be detected by autoradiography. Alternatively, an unlabeled antibody can be detected by washing the blot in a solution that contains a labeled anti-immunoglobulin antibody. This technique has been used to demonstrate overexpression of the HER2/protein in some breast cancers in which Southern blotting revealed no gene amplification.23 Because the protein is the effector of gene function and the determinant of phenotype, overexpression of the protein can be highly significant and a Western blot is often considered to be the “gold standard” technique for detecting overexpression.
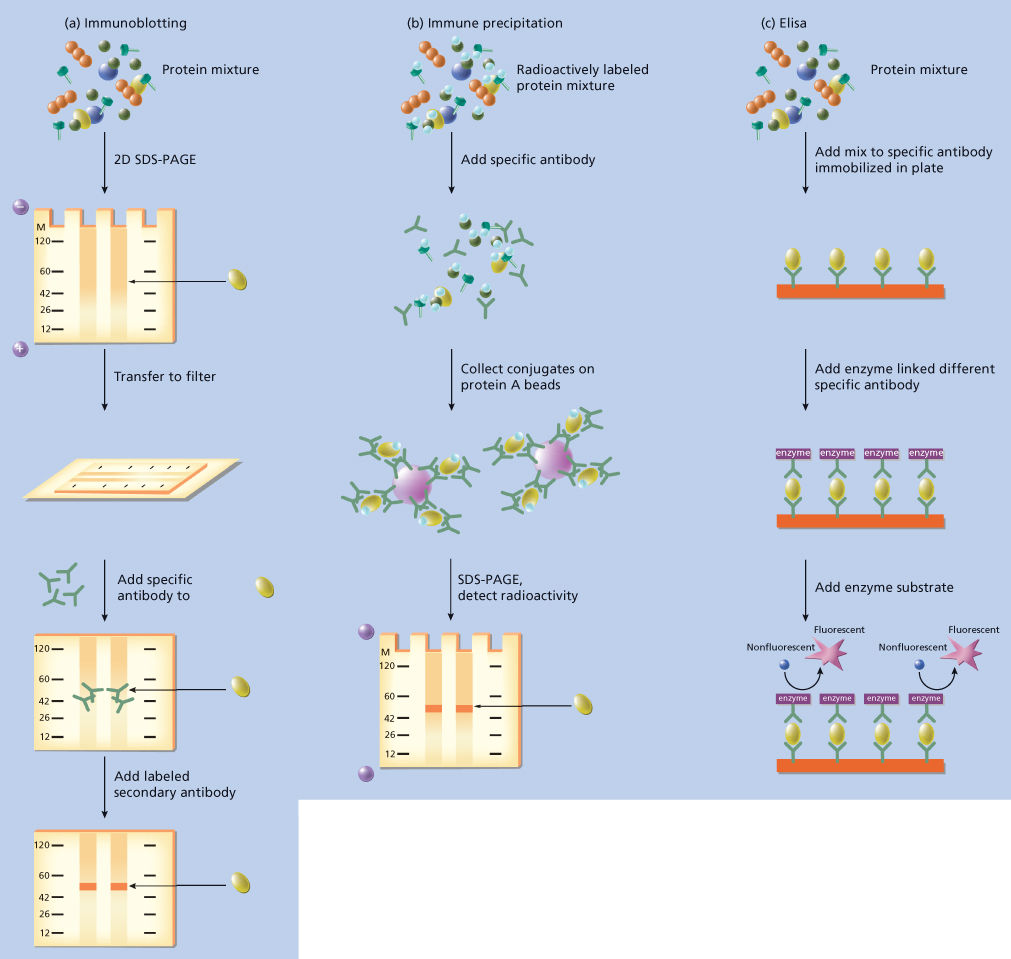
Figure 15 Methods of protein identification and detection. (a) Immune (Western) blotting. A complex mixture of proteins can be separated by size using electrophoresis (SDS-PAGE). The separated proteins are then transferred to a nitrocellulose or nylon filter in an electric field, maintaining their size-specific spatial orientation on the filter. Antibodies directed against one specific protein (in this case, the gray ellipsoid) in the original mixture are added to the filter and bind to the specific protein. Bound antibodies can be radiolabeled or enzymatically labeled themselves, or they can be visualized by incubating the filter with labeled anti-immunoglobulin antibodies. (b) Immunoprecipitation. A complex mixture of radiolabeled proteins (indicated by different geometric shapes) is incubated with antibodies specific for one of those proteins (in this case, the gray ellipsoid). After the antibodies have bound to their protein, small polystyrene or agarose beads containing staphylococcal protein A are added to the mixture. Protein A binds to the antibodies, and when centrifuged, the beads to which the protein A is bound will sediment to the bottom of the centrifuge tube, taking along the antibodies and the specific protein to which they have bound. The unbound proteins remain in the supernatant and can be removed. After boiling to dissociate the protein A/antibody/protein complex, specifically precipitated radiolabeled protein can be visualized by electrophoresis (SDS-PAGE) and autoradiography. (c) Enzyme-linked immunosorbent assay (ELISA). To perform ELISA, one needs to develop two independent antibodies that bind to the protein to be detected (gray ellipsoid in this example) with high specificity and affinity. One of these antibodies is then coupled to a plate, which is then incubated with the protein mix to be analyzed (this can be tissue, blood, or another body fluid). The specifically bound protein is retained on the plate and is detected with the second antibody generated against it, which is coupled to an enzyme or isotope, allowing quantitation of the bound protein. ELISAs are usually very sensitive and can detect picomolar amounts of proteins.
Immune precipitation
A primary goal of molecular biology is to use gene probes to detect the presence of a particular gene in a complex mixture of DNAs or RNAs. In a similar way, a specific antibody can be used as a probe to detect the presence of a particular protein in a complex mixture of proteins. An antibody directed against a protein of interest can be added to a mixture of proteins under conditions that allow the antibody to bind to its target protein (Figure 15b). One can then collect all of the immunoglobulins in that mixture by adding a protein that binds to immunoglobulins, such as anti-immunoglobulin antibodies or staphylococcal protein A. These proteins are often bound to a solid support, such as polystyrene beads, which can be removed from the solution by gentle centrifugation. As the beads collect at the bottom of the centrifuge tube, their attached immunoglobulin and target proteins collect there as well. When boiled in SDS and β-ME, the protein complexes dissociate, and they can be electrophoretically separated by SDS-PAGE. This process is called immune precipitation. To document the specificity of the antibody, a second immune precipitation is usually performed with a control antibody that does not bind the protein of interest. The two precipitations can be run side by side on SDS-PAGE, and the protein of interest can be identified by its presence in the experimental lane and its absence from the control lane. The proteins can be identified by staining reactions or, if the protein preparation is radiolabeled, by autoradiography.
An important application of this technique was the demonstration that the protein product of the retinoblastoma susceptibility gene (Rb) binds to proteins encoded by DNA tumor viruses. Antibodies directed against adenovirus proteins were used in an immune precipitation of proteins from cells transformed or infected by adenovirus. In addition to the adenovirus proteins, the precipitated proteins contained another protein that was proved to be the protein encoded by the retinoblastoma susceptibility gene.153Similar experiments using antibodies directed against the large T antigen of SV40 revealed an interaction between the T antigen protein and the RB protein.154 In both cases, these interactions appear to be central to the mechanisms whereby these viruses oncogenically transform susceptible host cells.
Enzyme-linked immunosorbent assay
Measurement of serum protein levels can be a valuable tool in cancer screening, cancer diagnosis, and monitoring the results of therapy. One of the most important applications of this approach is the measurement of prostate-specific antigen (PSA) levels for the detection and follow-up of prostate cancer.155, 156 The method used to measure PSA and other serum protein levels is ELISA.157 This method is diagrammed in Figure 15c. The principle is essentially the same as immune precipitation, except that instead of binding the antibody to protein A beads, the specific antibody is immobilized onto the surface of a transparent plastic plate. The specific test protein then binds to the antibody (i.e., the immunosorbent part of the assay), and other proteins are washed away. A second antibody, which recognizes a distinct epitope or antigenic region of the same antigenic protein, is then added. This antibody is covalently coupled to an enzyme (hence the enzyme-linked part). Specific binding of the second antibody leads to an enzyme concentration proportional to the amount of protein. The addition of a substrate for a fluorescent, chemiluminescent, or colorimetric reaction then gives a signal proportional to the amount of enzyme and hence the amount of antigenic protein. Small molecule concentrations (i.e., drug levels) can be measured in the same way if there are two independent antibodies, both of which can bind to the molecule at the same time.
Protein sequencing
The ultimate in protein identification is direct determination of amino acid sequence. Automated sequenators that have considerably simplified this technically demanding analysis are now available. In addition, recent advances in protein chemistry have permitted sequencing to be performed on mere picomoles of protein. In fact, Western blotting can be used to purify small amounts of protein, and the fragment of the blot containing the stained protein of interest can be used directly in an automated sequenator.158
Direct protein sequencing was responsible for ushering in the modern era of molecular oncology. The protein encoded by the oncogene v-sis, the transforming gene of the simian sarcoma virus, was found to be nearly identical to the empirically determined amino acid sequence of the B chain of human PDGF.159, 160 This was the first demonstration of a connection between oncogenes and the components involved in normal cellular proliferation.
Mass spectrometry
Dramatic advances in mass spectrometric methods in recent years have made mass spectrometry a preferred method for protein analysis and offer promise for use in diagnostic analysis as well. Mass spectrometry is a technique to convert molecules into ions and then to measure their mass. The distinct mass of a given protein is a method to identify that protein in a mixture. Furthermore, proteins can be identified unambiguously by tandem mass spectrometry, in which the proteins are first fragmented into peptides and separated, and then the peptides are fragmented further for sequencing.161, 162 Mass spectrometry is summarized briefly in Figure 16. A recent application of mass spectroscopy has been a technique known as SILAC,163 or stable isotope labeling by amino acids in cell culture. In SILAC, cells are cultured in the presence of medium containing either a normal or a heavy (nonradioactive) amino acid. As the cells grow, the amino acids are incorporated into proteins synthesized by the cell. The samples are then combined and subjected to mass spectroscopy. Chemically identical proteins containing either heavy or light amino acid can be distinguished on the basis of their mass. This allows for a quantitative assay of protein abundance between the two samples. SILAC has emerged as a powerful means to perform quantitative proteomics in cancer biology. Excellent reviews of mass spectroscopy164 and SILAC are available.165
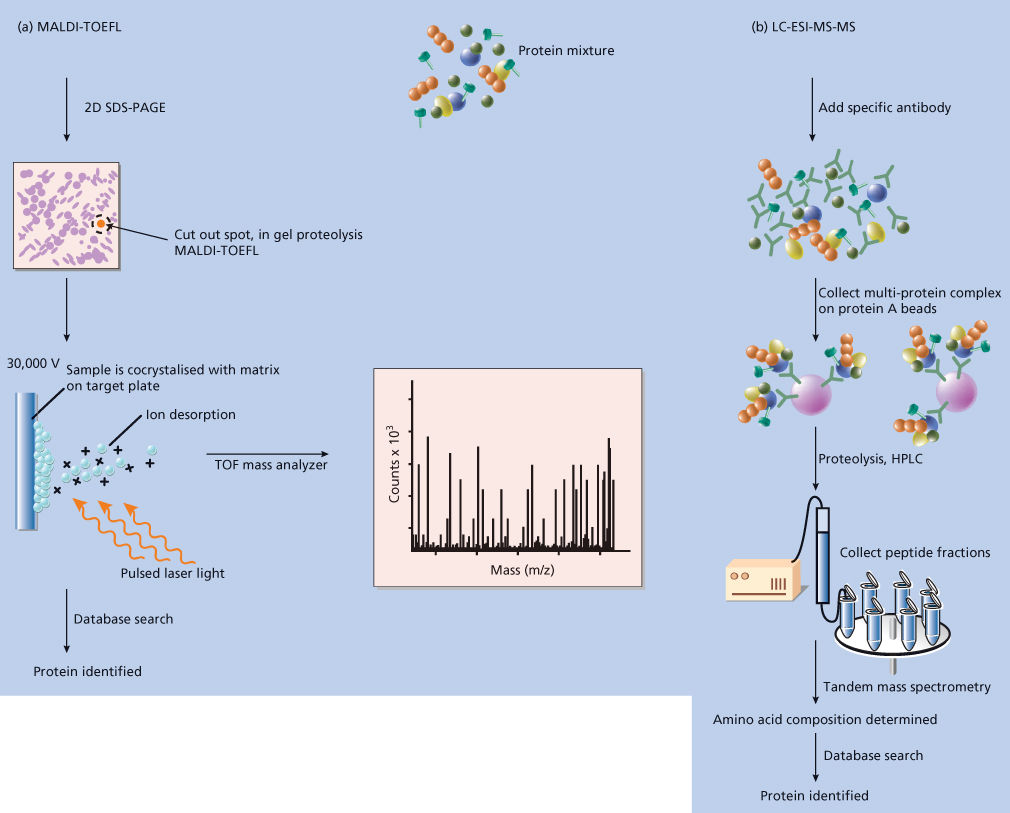
Figure 16 Mass spectrometry. (a) Matrix-assisted laser desorption ionization time-of-flight mass spectrometry (MALDI-TOF). For organisms whose genome sequence is known, the identification of “interesting” protein spots from a two-dimensional gel is routinely performed using MALDI-TOF. A complex mixture of proteins is separated by size and charge using two-dimensional electrophoresis. Protein spots are excited from the gel, digested with a protease, mixed with a matrix solution, and allowed to cocrystallize on a target plate. When a laser is fired at the target plate, the matrix absorbs the laser light’s energy and vaporizes, carrying some of the sample with it into a vacuum space. At the time the laser is fired, a high voltage is applied to the target plate to accelerate the ionized sample’s movement toward the time-of-flight (TOF) mass analyzer. The resulting peptide fingerprint can then be used to search databases to determine the identity of the protein. (b) The liquid chromatography electrospray ionization tandem mass spectrometry (LC-ESIMS-MS) can be used to obtain amino acid sequence information, allowing highly refined database searches. The approach employs capillary high-performance liquid chromatography (HPLC), which allows very slow (submicroliter/min) flow rates that are essential for obtaining high-sensitivity ESI-MS-MS of peptides. Following the liquid chromatography and electrospray ionization, the ions are analyzed by linearly linked tandem mass spectrometers that yield amino acid composition information.
Engineered protein expression
The final goal of many experiments in molecular biology is the use of biologic systems to synthesize the protein encoded by the gene being studied. This process, called engineered protein expression, can be an experimental end in itself. When the expressed protein synthesized by recombinant DNA methods can be shown to have all of the properties of the natural protein, this is considered to be proof that the proper gene has been cloned. Alternatively, expression can be an end in itself when one wants to produce large amounts of a particular protein that might be difficult to obtain from natural sources.
In vitro translation
One very simple expression method is in vitro translation, in which translation occurs entirely in a test tube. All of the components necessary for translating mRNA can be obtained from cells that are highly efficient in protein synthesis, such as reticulocytes (usually from rabbits) or wheat germ. Under the appropriate conditions, and in the presence of all 20 amino acids, a synthetic or purified RNA added to such a system will be efficiently translated into protein. If a radioactive amino acid, such as [35S]methionine, is included in the mix, the reaction products can be analyzed by SDS-PAGE and autoradiography. Demonstrating an appropriately sized protein or one that is recognized by a specific antibody constitutes good evidence that the mRNA in hand is the one the investigator desires.
Large-scale production of recombinant proteins
In vitro translation can be applied only at a small-scale analytic level. To produce large amounts of protein, one must turn to in vivo expression systems. One of the simplest involves cloning the cDNA for the desired protein into a bacterial plasmid or phage that contains a transcriptional promoter active in bacteria. When introduced into the appropriate bacterial host, large amounts of mRNA will be transcribed, which, in turn, will be translated into protein. The recombinant protein can then be purified away from all of the bacterial proteins. This is the way in which some clinically available interferons166–168 have been produced.
As noted earlier, many eukaryotic proteins require posttranslational modifications for maximal activity. Bacteria do not have the machinery required to accomplish complex modifications, such as the addition of specific carbohydrate groups. Moreover, the interior milieu of a bacterial cell is a reducing environment so that disulfide bonds essential to the structure and function of many eukaryotic proteins cannot form. When these modifications are required, mammalian cells can be used for expression. The basic concept is the same as in bacterial systems: a cDNA is cloned into a vector with a eukaryotic transcriptional promoter, and the resulting recombinant DNA is introduced into mammalian cells.169 However, there are still significant disadvantages in the use of mammalian cells for large-scale recombinant protein production. Mammalian cells are expensive to grow in vitro because they require a medium rich in nutrients and growth factors. Yeast cells, insect cells, and even plant cells are being exploited as an attractive compromise between mammalian cell culture and bacterial culture for protein expression. These eukaryotic cells can execute most of the posttranslational modifications required by mammalian proteins, including disulfide bonding. At the same time, these cells are easier and more economical to grow in vitro. A number of expression vectors analogous to those described here for bacteria and animal cells have been developed for these alternative eukaryotic hosts. Interested readers are referred to other sources for in-depth descriptions.170, 171
Methods for analyzing protein–protein interactions
An important and challenging task in post-genomic biology is to understand the function of proteins encoded by the genome and to determine their involvement in signaling pathways and cellular networks. One approach to understanding protein function is to investigate its interaction with other proteins of known function. By performing such analysis at a genome-wide level, one can create protein–protein physical interaction networks.172 These networks can be combined with gene expression or other genomic data to generate regulatory and signaling networks at the cellular level. Several methods allow the characterization of protein–protein interactions at a genome-wide scale. These include comprehensive protein pull-down assays, protein chips, and two-hybrid screens. Comprehensive protein pull-down assays use the combination of immunoprecipitation and mass spectrometric methods discussed earlier, whereas protein chips are the application of the microarray technology originally used for DNA or RNA profiling (see above) for protein interaction analysis.
The classic two-hybrid screen is performed in yeast and is based on the Gal4 system. Gal4 is a yeast transcriptional factor with well-defined and functionally distinct DNA binding (DB) and trans-activator (TA) domains and a DNA target sequence. In the two-hybrid screen, the two proteins to be analyzed are fused to the DB and TA domains of Gal4, respectively. The resulting fusion proteins are referred to as “bait” and “prey.” If the two proteins interact, then the DB and TA domains are brought into close proximity and create a functional transcriptional activator, the activity of which can be monitored using various reporter genes. The two-hybrid screen can be performed at three different levels: (1) testing the interaction of two known proteins, (2) testing the interaction of a known protein with all proteins, and (3) testing the interaction among all proteins. Unlike other approaches used for analyzing protein–protein interactions, the yeast two-hybrid screen does not require the expression and purification of any recombinant proteins. Thus, it is fairly straightforward to perform at a genome-wide scale and is applicable for nearly all protein interaction studies. A few such genome-wide studies were recently performed, and the resulting “interactome” maps greatly facilitate the functional annotation of the genome.173–175
Summary
The genetic information in DNA is transcribed into RNA, and the information in RNA is ultimately translated into protein. Like DNA and RNA, proteins are also directional. The amino and carboxy termini of proteins are specified by the 5′ and 3′ ends, respectively, of their cognate mRNAs. After translation, proteins may require further modification to be fully functional.
Proteins can be fractionated by size using electrophoresis through polyacrylamide gels in the presence of the anionic detergent SDS (SDS-PAGE). SDS-PAGE is an integral component of the analytic techniques of immune precipitation and Western blotting. Automated analyzers that can directly determine the amino acid sequence of a protein using vanishingly small amounts of material are now available. Mass spectroscopy using methods such as SILAC allows for large-scale quantitative proteomics.
The mRNA that encodes a protein can be translated in vitro using cellular extracts of rabbit reticulocytes or wheat germ. For expressing larger quantities of protein, bacterial cells are a simple and economical option, but they cannot perform many of the posttranslational modifications required by mammalian proteins. Vectors that permit mammalian cells to express foreign proteins with great efficiency and fidelity have been designed. Eukaryotic expression systems using yeast cells, insect cells, or plant cells also provide excellent alternatives.
Global analysis of protein interactions is used for the generation of interactome maps that reveal regulatory and functional networks, greatly facilitating our understanding of cellular function at the systemic level.
Functional screens for the identification of therapeutic targets in cancer
One consequence of the sequencing of the human genome is that we now have a comprehensive catalog of all of the genes that can be expressed. Cancer genome sequencing efforts have also given us a catalog of the genes most commonly mutated in cancer. The challenge going forward is to integrate this data with functional studies, and to systematically compile a list of genes whose mutation or aberrant expression drives cancer initiation or maintenance. Recent technical advances provide the means to search systematically for genes involved in cancer development. Broadly, these efforts can be divided into loss-of-function approaches (i.e., assessment of cellular phenotype after inhibition of gene expression) or gain-of-function approaches (i.e., assessment of cellular phenotype after enforcement of gene expression).
Loss-of-function approaches
RNA interference
RNA interference (RNAi) refers to an ancient biological pathway by which small (18–21 nt), double-stranded RNA (dsRNA) molecules can catalytically induce degradation of complementary mRNA molecules in a sequence-specific manner. There are two flavors of dsRNA capable of inducing RNAi. In plants and some other lower eukaryotes, so-called short interfering RNAs (siRNAs) may be endogenously processed from longer dsRNA substrates; in the laboratory, siRNAs can be synthesized and delivered into cultured cells.176, 177 MicroRNAs (miRNAs) represent a second flavor of small dsRNAs; miRNAs are components of the eukaryotic genome, and many are deeply conserved across evolution (including in humans).178, 179 miRNAs are transcribed from the genome, much like mRNAs, and are processed into a mature form that is about 22 nt in length. In their final processed forms, siRNAs and miRNAs function similarly, as sequence-specific negative regulators of gene expression.
Soon after the discovery of miRNAs and the report of sequence-specific endogenous silencing by dsRNAs, it became clear that siRNAs could be designed to inhibit the expression of any gene of interest.180 Indeed, over the past 15 years, RNAi technology has become a staple of loss-of-function analyses in research laboratories. RNAi has been widely adopted for applications ranging from inhibiting the function of single genes in cell culture to developing gene therapy techniques in vivo to specifically target disease-associated alleles.
In mammalian cells, RNAi-mediated gene suppression can be induced by the transfection of chemically synthesized siRNAs, or by the use of plasmids expressing short hairpin RNAs (shRNAs), which get processed to siRNAs endogenously by the Drosha and Dicer ribonucleases.181, 182 The shRNAs can be either expressed from a plasmid containing an RNA polymerase III promoter, or can be expressed from within a miRNA-like context as part of a longer transcript, under the control of an RNA polymerase II promoter.183 In either case, the siRNA becomes incorporated into the RNA-induced silencing complex (RISC) and directs sequence-specific degradation or translational suppression of the target mRNA, resulting in decreased protein expression.184 Athough siRNAs are easily synthesized and highly effective in inducing gene knockdown, such oligonucleotide reagents are relatively expensive and can only be used for transient loss-of-function experiments. Vector-based systems offer the possibility of adding selectable markers, such as drug resistance, stable expression of the RNAi construct, as well as being a renewable resource through propagation in bacteria. More recently, inducible RNAi vectors have also been developed, allowing fine temporal and spatial regulation of RNAi-induced gene knockdown.185
Both siRNA and shRNA libraries have been used successfully in transfection-based arrayed screens looking at phenotypes that develop shortly after gene suppression, such as apoptosis, cell signaling events, or cell cycle distribution.186–188 For many other cancer-related phenotypic assays, such as anchorage-independent colony formation, bypass of senescence, or tumor xenografts, long-term gene suppression is essential, requiring stable integration and expression of the RNAi vector. An additional significant advantage of the retroviral-based libraries is the ability to work with cells that are refractory to transfection. This is particularly true for the lentiviral-based systems, which can even be used to infect post-mitotic and other difficult-to-transduce cells, including primary cells or differentiated cells.189, 190
CRISPR/CAS9
A major discovery in the past 5 years has been the observation that aspects of the microbial adaptive immune system can be exploited to engineer changes into the genomes of mammalian cells. It had been observed for many years that microbial genomes contain clusters of repeat elements with intervening spacer sequences.191, 192 These clusters were termed CRISPR, or clustered regularly interspaced short palindromic repeats. Adjacent to these repeat elements, were CRISPR-associated (Cas) genes. It had also been observed that many of the spacer sequences that intervene CRISPR repeats are of phage origin, suggesting that the CRISPR-Cas system represents a form of bacterial adaptive immunity against phage infection. Indeed, mechanistic studies have now shown that the CRISPR array is transcribed as a noncoding RNA transcript known as a crRNA, which is then processed and associated with a Cas protein complex. In the most widely studied type of CRISPR/Cas system, known as the Type II CRISPR, the crRNA associates with another trans-activating RNA (known as a tracrRNA) as well as the Cas9 DNA nuclease. The crRNA and tracrRNA form an RNA hybrid that recognizes DNA containing a protospacer-adjacent motif (PAM) sequence, and mediates cleavage near the recognition site. The CRISPR/Cas system has now been established as the basis for an adaptive immune system in many archaea and bacteria that protects against foreign genetic elements (i.e., bacteriophages or plasmids). Readers are directed to an excellent reviews for further detail on this rapidly evolving field.193, 194
A watershed moment in this field was the realization that the Type II CRISPR/Cas9 system could be modified and transferred to other cell types for use as an exceptionally powerful genome editing tool. The tracrRNA:crRNA hybrid can be engineered as a single RNA chimera,195 or sgRNA, and the spacer (or guide) sequence can be modified to target a desired sequence of DNA for cleavage. This allows for an RNA-programmable molecular machine that can be directed to cleave near almost any desired site in the genome. Indeed, it has been shown that CRISPR/Cas9 cleavage can be engineered in mammalian cells in a highly generalizable fashion.196, 197 The double-strand breaks induced by Cas9 are most often repaired by the error-prone process of nonhomologous end joining (NHEJ), which frequently introduces small indels (which may induce frameshifts) at the site of cleavage. Thus, CRISPR/Cas9 technology offers a powerful means of inducing loss of function of a gene of interest. In addition, when Cas9 is used in conjunction with a homology-directed repair template, the cuts induced by Cas9 can be repaired via homologous recombination, allowing for precise genome-editing.
Recent studies have reported genome-scale lentiviral libraries of sgRNAs, analogous to the genome-wide RNAi libraries discussed above.198 These CRISPR libraries allow one to target each gene in the genome and assess the effect on a phenotype of interest. As compared with shRNAs, CRISPR-mediated inhibition of gene expression is often more robust, and possibly accompanied by fewer “off-target” effects. Thus, it is likely that genome-scale screening with CRISPR/Cas9 libraries will become a cornerstone of functional genomics that builds upon and refines previous advances made by shRNA screening efforts (Figure 17).
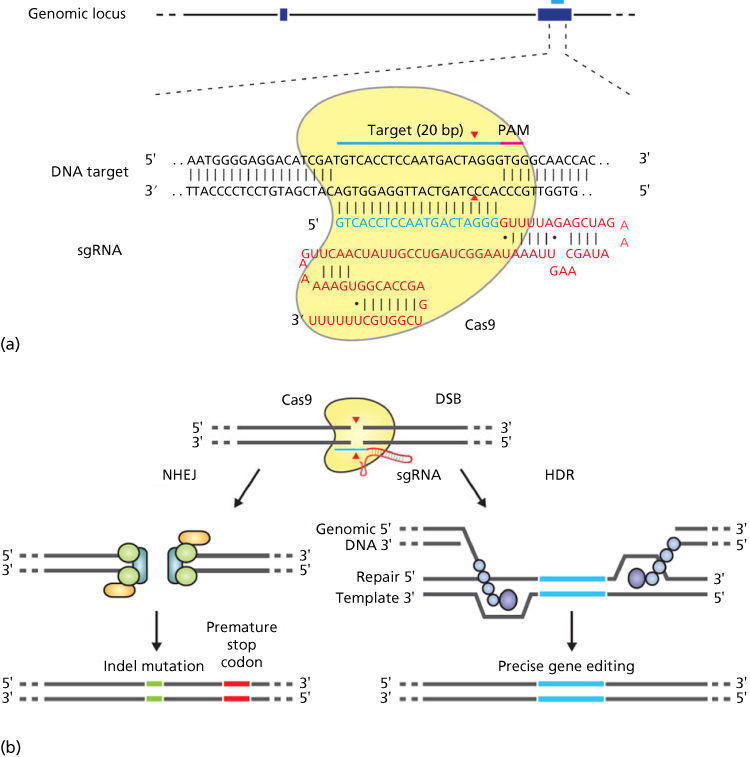
Figure 17 (a) Schematic of the RNA-guided Cas9 nuclease, which is directed to its DNA target by a 20-nt guide sequence (blue). The red triangle represents the approximate nucleotide position where Cas9 would be expected to initiate a DSB. (b) DSBs created by Cas9 can be repaired either via error-prone NHEJ or homologous recombination.
Source: Ran 2013.199 Reproduced with permission of Nature Publishing Group.
Gain-of-function approaches
Most gain-of-function screens involve introduction of a cDNA library into cells either transiently or stably, ideally resulting in the hyperactivation of pathways positively regulated by the gene corresponding to the introduced cDNA. Several large collections of cloned cDNAs have been used successfully to this end.200, 201 Several of these are compatible with recombination-mediated transfer systems, allowing shuttling of the open reading frames (ORFs) of interest into different vectors, facilitating adaptation of the system to individual needs.
Gain-of-function approaches have been used for a variety of purposes, including to identify modulators of signal transduction pathways as assessed by transcriptional reporters,202 to identify genes whose expression can bypass senescence,201 and to identify genetic programs conferring drug resistance phenotypes.203 Depending on the goal of the screen, the cDNA can either be transiently expressed by transfection (an approach that works well with transcriptional reporter-driven systems focused on short-term events) or stably integrated by using a viral cDNA expression vector (an approach that is often needed for many screens relevant to oncogenic transformation that require long-term expression and selection.)
Another type of gain-of-function approach utilizes miRNA expression libraries to screen using phenotypic assays. As discussed above, miRNAs are endogenous small RNAs that function by downregulating expression of their target genes, either through induction of transcript degradation or translational inhibition. miRNAs implicated in cancer include let-7, a negative regulator of RAS, c-Myc and other oncogenes204; the miR-17-92 cluster, which is upregulated in lymphomas and can promote lymphomagenesis205; and miR-15 and miR-16, negative regulators of BCL2, that are downregulated in chronic lymphocytic leukemia.206These examples suggest that full extent of the contribution of miRNAs to tumorigenesis is not yet known. Thus, further functional studies are necessary. For example, work using a retroviral expression library of miRNAs identified miR-372 and miR-373 in a Ras-induced senescence bypass screen, suggesting possible oncogenic function for these miRNAs.207Future applications of this approach will likely yield many more cancer-relevant miRNAs and the identification of their respective targets are also likely to provide further insight into the oncogenic process.
Summary
Increasingly, unbiased genome-wide functional screens have been used for the identification and validation of novel therapeutic targets in cancer. Most of these screens are performed in cell culture models, with the hits then validated by analysis of primary human tumor samples. RNA interference and CRISPR/Cas9 screens represent the main loss-of-function approaches while ORF screens represent the predominant gain-of-function approach. Several of these screens have resulted in the discovery of genes with key roles in tumorigenesis. Improvements in culture models and the application of these technologies in animal models increase the likelihood that the findings are validated in human cancer patients.
Mouse models of human cancer
Despite advances in our understanding of the biology of cancer at the molecular level, the application of this knowledge to the clinical management of cancer patients has been lagging. One of the factors limiting the translation of discoveries made in the laboratory to the clinic has been the availability of in vivo animal models of cancer that faithfully reproduce the human disease. Animals, particularly rodents, have been used in cancer research for decades to explore fundamental biological properties of tumors and to evaluate anti-neoplastic therapies.208 Initially, such rodent models were largely limited to spontaneous or carcinogen-induced neoplasms, or, more commonly, the ectopic or orthotopic transplantation of murine or human tumor cells into syngeneic or immunodeficient mice. Although none of these approaches accurately represents the complexity of human cancer, preclinical studies with these models are nonetheless traditionally required during the regulatory approval of investigational antineoplastic agents.
Improved animal cancer models became available with the advent of genetically engineered mouse models (GEMMs) of cancer following advances in molecular biology and embryology in the early 1980s. GEMMs enabled the direct investigation of potential tumorigenic genes in vivo, and, today, models that accurately represent nearly every major human cancer exist.209 The first generation of GEMMs was transgenic tumor-prone mice produced through the ectopic introduction of activated oncogenes. Indeed, such “oncomice” confirmed the tumorigenic properties of c-Myc, Ras, and several viral oncoproteins; mice transgenic for these oncogenes developed lymphoma, breast cancer, and pancreatic cancer.210 Although many early oncomouse models were informative, most human cancers could not be accurately modeled using this approach, likely due to the nonphysiological properties inherent in ectopic expression cassettes and tissue mosaicism. An alternative early approach to model human cancer was through the disruption or “knockout” (KO) of endogenous putative tumor suppressor alleles that were identified in cancer-prone kindreds. Indeed, KO mice confirmed Knudsen’s hypothesis of tumor suppressor gene function, although the tumor spectrum in such KO mice oftentimes was quite distinct from the cognate human condition. A detailed description of the basic methodologies required for the generation of transgenic and KO mice can be found in an excellent manual on the manipulation of the mouse embryo.211 These early mouse models were very powerful in validating the cancer-relevant role of particular genes or their combination in tumorigenesis and allowed the identification of cooperating genetic alterations by insertional mutagenesis. However, a major drawback of these early mouse models is that genetically engineered mutations are present in every cell of the mouse. This is problematic for multiple reasons. First, it can lead to embryonic lethality or abnormalities if the affected oncogene or tumor suppressor gene is required for normal development. Second, with the exception of hereditary cancer predisposition syndromes, the modus operandi of these mutational events does not reproduce the human disease because the majority of human tumors evolve owing to acquired somatic genetic changes. Third, it does not allow the interrogation of the role of cancer-relevant genes in a particular organ type or stage of tumorigenesis. Recognizing these deficiencies, investigators have been developing ever more sophisticated mouse models that more faithfully reflect the human disease.
Current state-of-the-art mouse models employ new genetic tools to address the shortcomings of classic oncomice and KO mice.212 Indeed, the advent of inducible and conditional mutant alleles enables the sophisticated spatial and temporal control of cancer gene expression. A common type of inducible cancer allele is transcriptionally regulated by variants of the E. coli Tetracycline operon, usually with the chemical analog doxycycline. It has two different variations, TET-OFF and TET-ON, depending on whether the expression of the targeted gene (regulated by a TET-responsive TA) is expressed in the presence (TET-ON) or absence (TET-OFF) of doxycycline.213 Doxycycline-sensitive alleles can include putative oncogenes, and such alleles were used to demonstrate a causal role for oncogenes in the development and maintenance of many tumor types in mouse models.209, 214 In addition, doxycycline-dependent alleles can reversibly suppress gene expression through the expression of dominant-negative tumor suppressor genes and short hairpin interfering RNA constructs.215 To control the cell lineage in which the doxycycline-dependent genetic element is expressed, cell-type-specific promoters are used to encode the tetracycline TA.213 Another inducible gene expression system utilizes chimeric proteins containing the gene of interest fused to the ligand binding portion of the estrogen receptor (ER). Such fusion proteins are held in a latent state in the cytoplasm in complex with heat shock proteins and are released following the addition of estrogenic analogs such as Tamoxifen. ER fusions with Myc and P53 have been used to generate a variety of clever mouse models of various cancer types.216, 217 Conditional mutant alleles are employed to directly modulate gene expression through either deleting putative tumor suppressor genes or expressing a single allele of an activated oncogene from its endogenous promoter. Conditional mutant alleles are controlled by the Bacteriophage P1 Cre/loxP system, whereby the Cre recombinase will direct the looping and excision of DNA elements that are flanked by 34 bp LoxP sites. Conditional tumor suppressor alleles thus consist of genes that contain exons surrounded by intronic LoxP sites, and these alleles are expressed at diploid levels until Cre recombinase is introduced and mediates the deletion of the gene with loss of mRNA and protein. Conditional oncogenes are latent alleles that are not expressed until Cre recombinase causes the removal of transcriptional silencing or “Stop” elements; and in this scenario, the gene dosage changes from haploid to diploid with half of the gene dosage consisting of the oncogenic alleles. There are additional recombinases now available for mouse modeling, and there are a variety of related strategies to control conditional gene expression. Inducible cancer alleles can be used alone, or in tandem with conditional mutant alleles such that added ligands can control the expression of Cre recombinase, enabling exquisite spatial and temporal control of cancer gene expression.218, 219 Using these state-of-the-art strategies, GEMMs that faithfully model the development of preinvasive and invasive carcinomas of the lung, pancreas, prostate, ovary, and breast have now been developed.209 Such models oftentimes demonstrate additional pathophysiological sequelae, including cachexia and metastasis, and somatic biochemical and genomic alterations that are common in the cognate human malignancy. A major advance using these GEMMs is the identification of new pathways in human cancers by cross-species comparisons.220 Investigations are now under way to determine the role of GEMMs of cancer in diagnostic and therapeutic development. Unanswered questions about GEMMs include the absence of evidence demonstrating a superior predictive therapeutic utility of GEMMs to xenografted tumor models, and whether species-specific differences in drug metabolism, the tumor microenvironment, and cell intrinsic pathways will preclude the translation of information in GEMMs to the clinical setting. Nonetheless, several publications suggest that these models will be informative in the preclinical assessment of antineoplastic agents.
Recently, developments in CRISPR/Cas9-based genome editing (see above) have also been extended to animal models. For example, a recent report used hydrodynamic injection to directly deliver CRISPR plasmids and sgRNAs to the mouse liver in order to target the tumor suppressor genes Pten and p53. The result was a loss of Pten and p53 function comparable to that achieved by genetic KO, with the mice developing liver tumors.221 In another study, CRISPR/Cas9-mediated genome editing of tumor suppressor genes was overlaid on a Kras-driven lung cancer model to functionally characterize a panel of potential tumor suppressor genes.222 In the coming years, it is likely that CRISPR/Cas9 technology will become more widely used as a complement to traditional genetic manipulation methods in an effort to create mouse models of cancer that faithfully recapitulate the human disease.
Summary
Rodent models are required components in anticancer drug development. Several GEMMs faithfully recapitulate the human disease and are useful for studying disease biology and for preclinical testing of potential therapeutics. CRISPR/Cas9 technology can complement traditional genetic manipulation methods, and will likely help further refine the degree to which current GEMMs recapitulate the human disease.
Related posts:
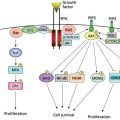
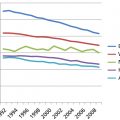


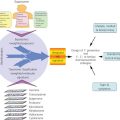
Stay updated, free articles. Join our Telegram channel

Full access? Get Clinical Tree


