A simulation model that represents an input-output relationship between insulin delivery and other external inputs such as meals or exercise, and the resulting glucose response is often referred to as a ‘virtual patient’. This type of a model constitutes an essential part of a computer simulation environment referred to as the simulator. A simulation model can utilise a single parameter set representing an ‘average patient’ or a multiple parameter set representing a population of ‘virtual subjects’.
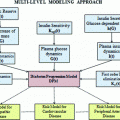
The concept of the ‘virtual population’ is illustrated in Fig. 2. The design is driven by the simulator’s intended purpose, i.e. to predict an outcome of a clinical trial conducted in a number of subjects with diabetes producing population-relevant results.
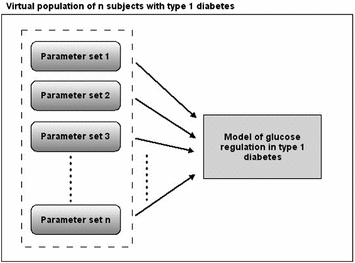

Fig. 2
A population of ‘virtual subjects’ with type 1 diabetes comprises a simulation model of the glucose regulation accompanied by n parameter sets representing n ‘virtual subjects’; virtual populations can be further subdivided into subgroups of adults, children, pregnant women etc. with type 1 diabetes
3 Models of Physiological Subsystems of Glucose Regulation
3.1 Models of Glucose Kinetics and Insulin Action
The conceptual paradigm of models representing the glucose kinetics and insulin action is illustrated in Fig. 1. The model describes the distribution, production and utilisation of glucose, and the control by insulin. The model of insulin action typically includes a remote compartment to represent the delay in insulin action.
One of the first models of the glucose-insulin system to be used in simulations was a linear model developed by Ackerman et al. [31]. Although this four-parameter, two ordinary differential equations model was a clear oversimplification of the whole body glucose regulatory system, the strength of the model was that its parameters could be identified from clinical data [32].
An early example of a low-order model is the minimal model by Bergman et al. [9]. It was developed to estimate insulin sensitivity and glucose effectiveness but the model has also found numerous applications in the domain of glucose control. The structural simplicity and the ability to estimate significant physiological parameters led to its popularity among the clinicians. The model is widely used to estimate insulin sensitivity in clinical and epidemiological studies [33–36] and is referred to in over 1,000 publications [37]. Its usefulness and popularity sparked great interest in mathematical modelling of glucose regulation. This model with two state variables describes plasma glucose dynamics based on plasma insulin feeding into a remote insulin compartment. The original model was developed using data obtained from the intravenous glucose tolerance test (IVGTT). The model has two compartments representing plasma glucose and remote insulin. The rate change of glucose in this model is the difference between the net hepatic glucose balance and the disappearance of glucose into peripheral tissues. A nonlinear regression analysis is applied to estimate four model parameters with insulin sensitivity (SI) and glucose effectiveness (SG) being the main indices of interest.
Several authors have documented the shortcomings of the minimal model [38–41] such as its inability to separate glucose production from glucose disposal. Only the net hepatic glucose balance can be described. As a consequence, the metabolic indices SI and SG measure not only the effect of insulin and glucose on glucose disposal but also their inhibitory effect on hepatic glucose production. Other concerns regarding the minimal model include poor precision of parameter estimates and unsatisfactory reproducibility of SI [41]. In order to overcome these limitations, the labelled IVGTT has been devised and tracer minimal models developed [42, 43]. The tracer models allowed the estimation of tissue sensitivity to insulin and glucose effectiveness without distortion of glucose and insulin effects on hepatic glucose production. Despite these improvements, Caumo and Cobelli [44] observed that the minimal model gives a physiologically implausible prediction of the hepatic glucose production. The source of the error is likely due to under-modelling of the glucose kinetics by a single compartment [38].
From a simulation point of view, the glucose effectiveness of approximately 0.02 per min, as estimated in healthy subjects, results in an overestimated self-regulatory capability of the glucoregulatory system especially when used in the original formulation with basal glucose set at normoglycemia. Figure 3 illustrates the exaggerated glucose self-regulation at this nominal value of glucose effectiveness. When used to evaluate glucose controllers, the overestimated self-regulatory capability provides an overoptimistic assessment of the controller as most of the control is exerted through glucose effectiveness and not through the controller directed insulin delivery. Glucose effectiveness at or below 0.01 per min is needed to represent appropriately the self-regulatory capability of the glucoregulatory system.
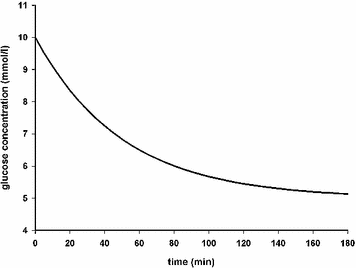

Fig. 3
Glucose concentration curve obtained using the minimal model with glucose effectiveness of 0.02 min−1, starting glucose value of 10 mmol/l, basal glucose of 5 mmol/l, and a constant insulin concentration at the basal insulin level. At this nominal value of glucose effectiveness the minimal model predicts that elevated glucose rapidly returns, with a half time of 35 min, to the ‘basal glucose level’ without the need to increase the insulin concentration. This ill fits with glucose concentration curves recorded in subjects with type 1 diabetes
Glucose kinetic models with two glucose compartments have been proposed in the last decade [44–46] to improve the minimal model. The total number of parameters increased to six and the parameters could no longer be uniquely estimated from the data. The problem can be solved by using tracer glucose bolus and physiological constraints [44, 45] or by applying the Bayesian estimation [46]. The estimation of the three insulin sensitivities of glucose uptake in the peripheral tissues, the sensitivity of hepatic glucose production and the sensitivity of glucose transport/distribution was first attempted by Ferranini et al. [47]. The partitioning of the three sensitivities was fully accomplished by Hovorka et al. [26] using a two-compartment glucose model for the dual-tracer IVGTT. The model described the steady state as well as dynamic conditions and was validated in healthy subjects.
3.2 Models of Subcutaneous Insulin Kinetics
Subcutaneous insulin absorption is a complex process influenced by factors including the associated state of insulin, its concentration, injected volume, injection site and depth, and tissue blood flow [48–51]. Several mostly compartmental models have been proposed for various insulin preparations. A comprehensive review of these models by Nucci and Cobelli [52] compares six models of the subcutaneous insulin kinetics ranging from simple compartmental models [53–56] through empirically derived [57] to complex conceptual models [58, 59]. In all models except that by Hovorka et al. [60], plasma insulin is assumed to be a single compartment. The compartmental models differ mainly in the way they consider the absorption of subcutaneous insulin.
Kobayashi et al. [53] proposed a two-compartment plasma and subcutaneous tissue model with a delay to represent insulin absorption. Kraegen et al. [54] proposed a model with two subcutaneous compartments and five parameters including the insulin degradation rate in the subcutaneous tissue. A simple three-compartment model by Puckett et al. [55] is widely used. The model’s three parameters were estimated from clinical data collected in subjects with diabetes. All three models were identified for short acting soluble insulin. Rapid acting insulin analogues were not available at the time of these publications. Few years later, Shimoda et al. [56] proposed a three-compartment model of a soluble insulin and monomeric insulin analogue to be used in the artificial pancreas. The model was fitted using a 3-h block of data obtained from ten subjects with type 1 diabetes. Contradictory to Kraegen et al. [54], the insulin degradation in the subcutaneous tissue estimated by this model was not negligible. The effect of insulin degradation was corroborated by Wilinska et al. [61] who evaluated ten alternative models of the subcutaneous insulin kinetics of varying complexity. Model selection was based on the principle of parsimony and physiological plausibility using data collected in subjects with type 1 diabetes and rapid acting insulin analogue. The selected model indicated the existence of a fast and slow absorption channel and the presence of the local insulin degradation in the subcutaneous tissue.
3.3 Models of Subcutaneous Glucose Kinetics
Understanding subcutaneous glucose dynamics is important as CGM devices employed in the closed-loop systems measure glucose concentration in the subcutaneous tissue. The ability to describe the dynamics of the relationship between the subcutaneous and plasma glucose depends on the understanding and quantification of the physiological processes in the interstitial fluid (ISF) surrounding the adipose tissue. Plasma glucose is separated from the interstitial glucose by a capillary wall, and hence changes in ISF glucose are related to changes in plasma glucose by the rate of diffusion across the capillary wall and by the rate of glucose removal from the ISF representing the glucose uptake by adipose tissue. Studies with the microdialysis [62] and open-flow microperfusion [63] have demonstrated the presence of a gradient between plasma and interstitial glucose of a varying magnitude [64]. An equilibration time delay between plasma and ISF glucose has been reported by a number of studies [65, 66]. Models of subcutaneous glucose kinetics have been postulated by Bonnecaze and colleagues [67, 68]. Wilinska et al. [69] postulated nine alternative models to account for the temporal variations of the plasma to ISF glucose gradient. All models were fitted to experimental data collected in subjects with type 1 diabetes. Model which best represented the clinical data included zero-order glucose disposal from the ISF and an insulin effect on the glucose transfer from the plasma to the interstitial fluid.
3.4 Models of Glucose Absorption from the Gut
Following a meal, glucose is absorbed in the upper gastrointestinal tract, transported to the splanchnic bed, mostly the liver, and then to the peripheral circulation. Worthington [70] postulated a simple two-compartment model of glucose absorption from the gut with identical transfer rate coefficients between the compartments. The model was shown to be adequate in representing the glucose rate of appearance from the gut. Arleth et al. [71] split the gut absorption into three terms, each one corresponding to a class of carbohydrates with different absorption rates: sugars, a fast absorbing starch, and a slow absorbing starch. More recently, Dalla Man et al. [72] proposed a three compartment non-linear model with two compartments representing the stomach (solid and liquid phase) and the third compartment representing the intestine. The model assumes a constant rate of the intestinal absorption but describes gastric emptying rate to be dependent on the total amount of nutrient in the stomach.
3.5 Models of Exercise Effect on Glucose Kinetics
Exercise has been associated with a transient increase in insulin sensitivity and insulin-dependent glucose uptake in the muscle through augmented availability of glucose transporters [73–75]. In type 1 diabetes, a higher glucose variability associated with exercise can be difficult to manage leading to an increased risk of hypoglycaemia [76]. This difficulty poses a major concern in the field of closed-loop glucose control where mathematical models able to predict dynamic changes of glucose during exercise could prove very useful.
To date very few system-level models have been proposed [77–81]. The two models with identifiable parameters and a potential to be used in closed-loop glucose control are those by Derouich et al. [78] and Breton [81]. Both models are extensions of the minimal model of glucose kinetics [82]. Breton’s novel approach was to detect and quantify exercise through changes in the heart rate. Hernandez–Ordonez [79] extended the ability of a well-known Sorensen model [25] to reproduce variations in the glucose concentration induced by exercise in type 1 diabetes. The extended model was verified using experimental data collected during a light and moderate intensity exercise. The authors found a good agreement with experimental data from the literature. The effect of high intensity exercise was simulated by extrapolation. However, the physiological differences between moderate versus intense exercise are still poorly understood [83]. Chassin et al. [84] advocate a wider use of real-time continuous glucose monitoring devices to improve current modelling efforts.
4 Simulation Models in Type 1 Diabetes
Recent technological advances in real-time continuous glucose monitoring fuel the development of a wearable artificial pancreas [23, 85–87], which consists of a CGM device to measure glucose concentration, a titrating control algorithm to compute the amount of insulin to be delivered, and an insulin pump delivering the advised insulin doses.
Algorithms for closed loop insulin delivery in subjects with type 1 diabetes can be designed and tuned empirically, and evaluated during clinical testing. However, a validated simulation model of glucose regulation in type 1 diabetes accelerates the design and the evaluation process. Recent efforts focus around the development of a simulation environment based on a validated model of type 1 diabetes and designed specifically for testing and evaluating closed-loop glucose controllers. Examples of such simulation environments and their related models are presented below.
4.1 Hovorka Simulation Model
The European Commission funded Advanced Insulin Infusion using a Control Loop (Adicol) Project which run from 2000 for 3 years and adopted an adaptive nonlinear model predictive controller (MPC) to develop a minimally invasive closed-loop system with meal announcement [88]. The development of the MPC-based glucose controller was facilitated and greatly accelerated by a metabolic simulator [89].
The simulation model described by Hovorka and colleagues [90] is based on a compartment model of glucose kinetics and insulin action published by the same author [26]. Other subsystems include two compartment models of the subcutaneous insulin and subcutaneous glucose kinetics as well as a two compartment model of the glucose absorption from the gastro-intestinal tract. An important property of this simulation environment is its ability to represent between and within subject variability. The between subject variability is represented by a population of 18 virtual subjects with type 1 diabetes. The model parameters were obtained either from clinical studies in subjects with type 1 diabetes or from informed probability distributions. The within individual variability of the glucoregulatory system was implemented by superimposing sinusoidal oscillations on a subset of model parameters. A possible weakness of Hovorka virtual patient model is its simple representation of glucose absorption from the gut which may need to be refined. In addition, the within subject variability may also require further refinement. A clear strength of this virtual population of 18 subjects with type 1 diabetes is that it was validated by comparing the simulation study predictions against a clinical study evaluating overnight closed-loop insulin delivery in young people with T1D using a model predictive controller [91]. The simulation model is being used by Hovorka’s group in the development of a prototype closed-loop insulin delivery system for children and adolescents [92, 93], adults [94] and pregnant women [95] with type 1 diabetes.
4.2 Medtronic Virtual Patient Model
Medtronic’s closed loop project adopts the proportional integral derivative (PID) approach to develop an external physiological insulin delivery (ePID) system based on the Guardian Real-Time Medtronic subcutaneous glucose monitor (Medtronic Minimed Northridge CA, USA) [96] and subcutaneous delivery of a rapid acting insulin analogue. Using data from previously completed closed-loop studies in subjects with type 1 diabetes, the Medtronic team derived a simulation model such that the original study could be recreated using the computer simulation alone [97]. The simulation model, referred to as the Identifiable Virtual Patient (IVP) model, used Bergman’s minimal model at its core interacting with two compartment models of the subcutaneous insulin kinetics and the meal absorption. Diurnal variations of minimal model parameters such as SI (insulin sensitivity), SG (glucose effectiveness at zero insulin concentration) and the endogenous glucose production were introduced whenever the root mean square error between the model-predicted and the measured glucose exceeded 222 mg/dl. Ten glucose profiles fitted in this study were identified as the ‘virtual population‘. Validation of the IVP model was carried out by simulating previously conducted clinical trials in adults and children with type 1 diabetes (independent subjects) and reproducing the outcomes of these studies [98]. Medtronic plans to use this relatively small in size virtual population to evaluate and optimise new closed loop insulin delivery algorithms. Although the time-variant parameters can be viewed as the strength of this simulation model, it is limited by the rather simplistic representation of the glucose kinetics by Bergman’s minimal model including a short duration of insulin action and overestimation of glucose effectiveness.
4.3 Dalla Man Simulation Model
Cobelli’s group in Padova, Italy, developed a simulation model of glucose-insulin interactions utilising data collected in 204 normal subjects who underwent a triple tracer meal protocol [99]. The application of glucose tracers allowed glucose and insulin fluxes during a meal to be calculated [100]. The simulation model is made up of a number of parsimonious submodels describing the various unit processes that have been identified using a forcing function strategy. There are two main subsystems in the model. The glucose subsystem is described by a two compartment model [101] as is the insulin subsystem [102]. The unit process models were identified from average data with a forcing function strategy; 35 parameters of the normal subject were estimated.
The simulation model has been employed to simulate a typical day of a normal subject with three meals. To account for diurnal variations in insulin sensitivity and beta cell responsiveness, it was assumed that insulin sensitivity is 25 % lower during the evening meal compared to the breakfast and the lunch and beta-cell responsiveness is 25 % lower during the lunch and the evening meal compared to the breakfast. The main novelty of this simulation model is a more detailed representation of glucose transit through the gastro-intestinal tract [72]. The main weakness however is that the diurnal variations of certain model parameters have not been modelled.
Although the original model was identified using data collected in normal subjects, it is also being used to simulate subjects with type 1 diabetes [37]. In this model, described by 26 parameters, the authors substituted the insulin secretion model with the model of subcutaneous insulin kinetics. In order to account for the higher basal glucose in type 1 diabetes, the endogenous glucose production was increased. Other parameters were kept identical. The virtual patient model, also known as the UVA (University of Virginia) simulator, has been accepted by the Federal Drug Administration to replace animal testing of glucose controllers.
Stay updated, free articles. Join our Telegram channel

Full access? Get Clinical Tree


