Fig. 1
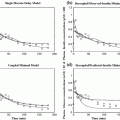
Left the collected experimental time-series data of plasma glucose (top panel), insulin (middle panel) and free fatty acids (FFAs) (bottom panel) from a fasting dog at rest over 10 hours (sampling every 3 min). Right the time-series data after mean subtraction and low-pass filtering
3 Results
Using the PDM-based modeling methodology outlined in Appendix I with three Laguerre basis functions having alpha parameter 0.4 for the insulin input and 0.8 for the FFA input (determined via a search procedure minimizing the prediction error), we obtain the model shown schematically in Fig. 2 that has two PDMs for each input and two cross-terms (one between the 1st PDM of insulin and the 2nd PDM of FFA, and the other between the 1st and 2nd PDM of FFA). The computed PDMs are shown in Fig. 3 in the time-domain. Each PDM can be viewed as the impulse response function of a linear filter that transforms the respective input epoch into a state variable (the PDM output) that has a contemporaneous nonlinear relationship with the output variable described by the respective ANF [12]. The computed ANFs are shown in Fig. 4, plotted over the abscissa range of ±1 SD of the PDM output that corresponds to the experimental data. The abscissa of the ANF plot is the PDM output and the ordinate is the corresponding component of the model output prediction (glucose) at the same time instant. Figure 5 shows the PDM-based model prediction (after the initial transient of 120 min that is roughly equal to the system memory), along with the actual glucose-output. The normalized mean-square error of this model prediction is 21 %. We view this low prediction error (relative to what can be achieved with other methods) as validating the obtained model. The specific form of the obtained PDMs and ANFs is discussed in the following section with regard to plausible physiological interpretations.
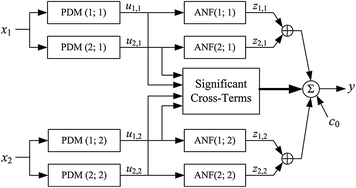
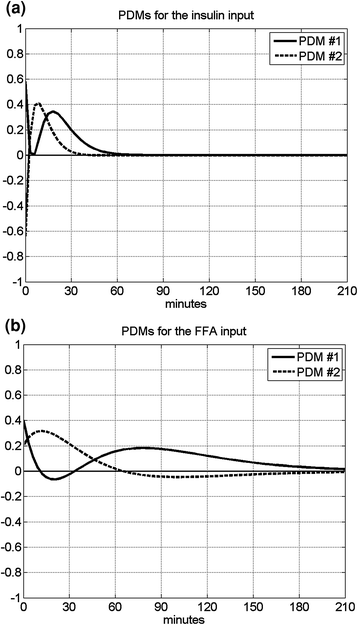
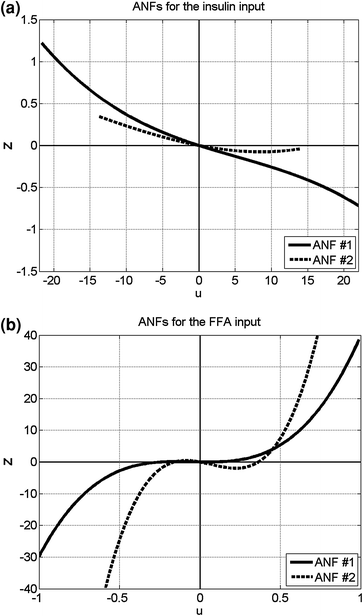
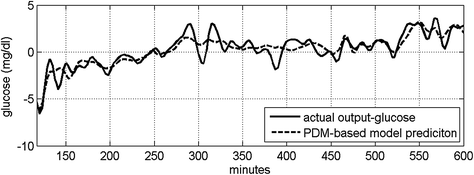

Fig. 2
Schematic of the PDM-based model, which is composed of two PDMs for each input (insulin and FFA deviations from the respective mean values) that can be viewed as impulse response functions of two linear filters receiving the respective input. Each PDM is followed by a static nonlinearity, termed Associated Nonlinear Function (ANF), which transforms the PDM output into an additive component of the model-predicted glucose output (deviation from its mean value). The model also includes the significant cross-terms that are selected on the basis of the statistical significance of their correlation with the output (see Appendix I). Two cross-terms were found significant in this system: one between PDMs of the two inputs (1st of insulin and 2nd of FFA) and the other between the two PDMs of the FFA input. The ordinate of the insulin PDMs is in mg/dl per pM, and in mg/dl per mM for the FFA PDMs. The abscissa of the PDMs is in min. The abscissa and ordinate of the ANFs are both in mg/dl

Fig. 3
The computed two PDMs for the insulin input (left) and the FFA input (right)

Fig. 4
The computed ANFs for the insulin input (left) and the FFA input (right)

Fig. 5
The PDM-based model prediction of the output (dashed line) and the actual output-glucose data (solid line) after de-meaning and low-pass filtering. The resulting Normalized Mean-Square Error (NMSE) of this prediction is 21 %
The output equation of this two-input PDM-based model is:
![$$\begin{aligned} G(t) =\,& G_{0} + f_{I,1} \left[ {P_{I,1} *I(t)} \right] + f_{I,2} \left[ {P_{I,2} *I(t)} \right] \\ & + f_{F,1} \left[ {P_{F,1} *F(t)} \right] + f_{F,2} \left[ {P_{F,2} *F(t)} \right] + \sum\limits_{j,k} {\;C_{j,k} (t)} \\ \end{aligned}$$](/wp-content/uploads/2017/04/A310669_1_En_10_Chapter_Equa.gif) where * denotes the convolution operation, G(t), I(t) and F(t) denote the de-meaned time-series data of glucose, insulin and FFA respectively, f denotes the cubic ANF and P denotes the PDM for the input and rank indicated in the respective subscript, G 0 is the model constant, and C j,k (t) denotes the significant cross-terms of the model (products of PDM outputs that have statistically significant correlation with the glucose-output signal)—in this model, the following cross-term combinations were found to be significant: (P I,1, P F,2) and (P F,1, P F,2). This model has 15 free parameters (12 ANF coefficients, 2 cross-term coefficients and the constant G 0). The PDMs are estimated separately from the kernel estimates via the Laguerre expansion technique (see Appendix I) that requires in this case the least-squares estimation of 28 free parameters (9 for the self-kernels of each of the two inputs, 9 for the cross-kernel and the constant). The available data (200 samples) are deemed adequate for the estimation of these parameters without risk of over-fitting.
where * denotes the convolution operation, G(t), I(t) and F(t) denote the de-meaned time-series data of glucose, insulin and FFA respectively, f denotes the cubic ANF and P denotes the PDM for the input and rank indicated in the respective subscript, G 0 is the model constant, and C j,k (t) denotes the significant cross-terms of the model (products of PDM outputs that have statistically significant correlation with the glucose-output signal)—in this model, the following cross-term combinations were found to be significant: (P I,1, P F,2) and (P F,1, P F,2). This model has 15 free parameters (12 ANF coefficients, 2 cross-term coefficients and the constant G 0). The PDMs are estimated separately from the kernel estimates via the Laguerre expansion technique (see Appendix I) that requires in this case the least-squares estimation of 28 free parameters (9 for the self-kernels of each of the two inputs, 9 for the cross-kernel and the constant). The available data (200 samples) are deemed adequate for the estimation of these parameters without risk of over-fitting.
![$$\begin{aligned} G(t) =\,& G_{0} + f_{I,1} \left[ {P_{I,1} *I(t)} \right] + f_{I,2} \left[ {P_{I,2} *I(t)} \right] \\ & + f_{F,1} \left[ {P_{F,1} *F(t)} \right] + f_{F,2} \left[ {P_{F,2} *F(t)} \right] + \sum\limits_{j,k} {\;C_{j,k} (t)} \\ \end{aligned}$$](/wp-content/uploads/2017/04/A310669_1_En_10_Chapter_Equa.gif)
Having obtained the PDM-based model, we can use it to advance our understanding of the dynamics of this system. Some discussion on plausible interpretations of the specific form of the obtained PDMs and the respective ANFs are provided in the following section. In this section, we illustrate the model prediction for specialized inputs (i.e. insulin impulse and FFA pulse) that can be evaluated against known physiology. We also explore one important aspect of the system dynamics that pertains to the notion of “dynamic insulin sensitivity” (DIS) by utilizing the predictive capability of the PDM-based model to compute the predicted glucose response to an insulin pulse input for a given level of FFA. The insulin and FFA values are deviations from the respective mean values of the experimental data (i.e. relative to the observed operating point of the system). The model predictions for three magnitudes of insulin impulses (0.5, 1 and 1.5 SD of the recorded insulin data) and three levels of FFA impulses (0.5, 1 and 1.5 SD of the recorded FFA data) are shown in Fig. 6 and suggest that glucose is reduced in a sub-linear manner in response to an increase of insulin (consistent with current view), and the glucose response to an FFA increase is biphasic exhibiting an early sub-linear reduction and a later phase of counter-regulation (after about 2 hr) where glucose is increased. The early phase of the glucose response to an FFA increase may be due to the reported facilitation of pancreatic beta-cell secretion (leading to an increase of insulin and subsequent reduction of glucose), whereas the late-phase counter-regulation may be due to the known inhibition of FFA to the insulin facilitation of glucose uptake by tissues and to the insulin inhibition of the processes of glycogenolysis and gluconeogenesis (both leading to glucose increase). It is posited from the different dynamic time-scales that the latter effect takes longer than the former.
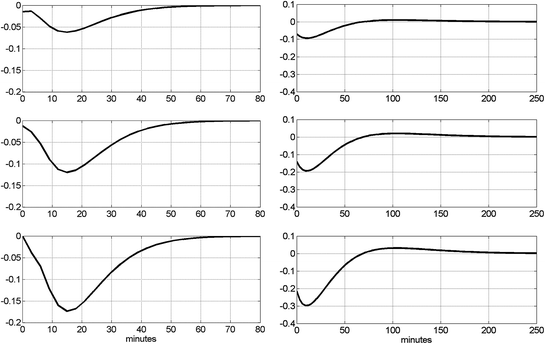

Fig. 6
Left panels, top to bottom the model-predicted glucose responses for three magnitudes of insulin impulses (0.5, 1 and 1.5 SD of the recorded insulin data). Right panels, top to bottom the model-predicted glucose responses for three levels of FFA impulses (0.5, 1 and 1.5 SD of the recorded FFA data). The units of glucose are mg/dl. Evidently, the FFA effect is much larger
As an illustration of the nonlinear interaction between the two inputs as they affect the glucose output, we show in Fig. 7 the model-predicted glucose responses to an insulin pulse input with amplitude equal to 1 SD of the experimental insulin data for four different levels of FFA equal to 0, 0.5, 1 and 1.5 SD of the experimental FFA data. It is evident that the steady-state value of the glucose output (in response to the given insulin pulse input) is smaller for higher level of FFA and, surprisingly, it is reversed from the normal (increase instead of decrease) for high levels of FFA. This surprising result must be examined with controlled experiments in the future. The observed early transient glucose response (reduction) to a non-zero FFA step input is consistent with the response profile presented and discussed in Fig. 6.
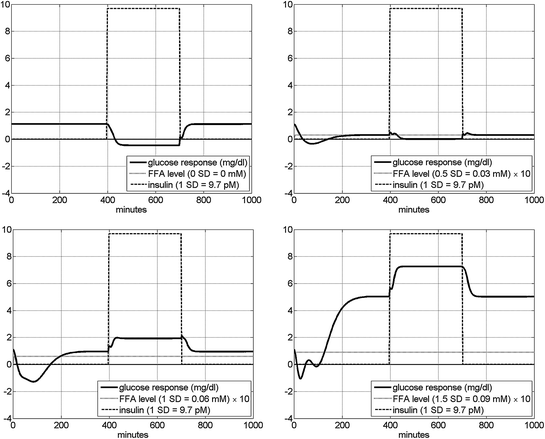

Fig. 7
The model-predicted glucose response in mg/dl to an insulin pulse input equal to 1 SD of the experimental insulin data (9.7 pM) for four different levels of FFA: 0 (top left), 0.5 (top right), 1 (bottom left) and 1.5 (bottom right) SD of the experimental FFA data. We observe that the glucose response to insulin is reversed from the normal (increase instead of decrease) for high levels of FFA. The early transient glucose response (reduction) to a non-zero FFA step input (prior to the application of the insulin pulse) is consistent with the response profile presented in Fig. 6
The Dynamic Insulin Sensitivity (DIS) is defined as the ratio of the predicted steady-state glucose response to the corresponding amplitude of an insulin pulse input (for a given FFA level). The sign is inverted, so that normal DIS (i.e. reduction of glucose for raised insulin) takes positive values. Since the model is nonlinear (3rd order), the computed DIS values will generally follow a nonlinear (cubic) function of the insulin pulse amplitude and of the respective FFA level. These DIS nonlinear functions will be generally different for different operating points of the system.
Stay updated, free articles. Join our Telegram channel

Full access? Get Clinical Tree


