Management of Hyperglycemia with Oral Antihyperglycemic Agents in Type 2 Diabetes
Harold E. Lebovitz
The management of hyperglycemia in patients with diabetes has changed significantly during the past several years as a result of numerous advances in our knowledge about the disorder and the application of this knowledge to the development of new strategies and treatments.
The quantitative relationship between glycemic control and the chronic microvascular, neuropathic, and macrovascular complications of diabetes have been defined by large long-term clinical studies in individuals with type 1 and type 2 diabetes (1,2,3). A clearer understanding of the physiologic mechanisms involved in regulating glucose metabolism has provided the basis for a more detailed analysis of the different pathophysiologic processes causing hyperglycemia (4,5,6,7). Methods for regulating fasting glycemia can be differentiated from methods for regulating postprandial hyperglycemia (8,9). New classes of antihyperglycemic agents are available that provide the means for selectively ameliorating the different mechanisms that cause hyperglycemia (10,11). Long-term follow-up data are sufficient to demonstrate that type 2 diabetes is a progressive disease and that therapy must change with disease progression (12). Combinations of oral antihyperglycemic agents or of oral antihyperglycemic agents and insulin are frequently necessary to achieve appropriate glycemic goals (13,14). The impacts of the various classes of antihyperglycemic agents on cardiovascular risk factors have been established and are an important consideration in deciding which agents to use in a particular patient (15,16).
Effective management of hyperglycemia requires utilization of all of this new information. Initial evaluation of a patient requires establishment of the goals of therapy for that patient. Diabetes education reinforces those goals and helps the patient learn techniques and behavior that can help achieve those goals. The evaluation must include an assessment of whether the patient has the metabolic syndrome and, if so, which components of the syndrome. The selection of initial pharmacologic therapy is determined by these initial evaluations. Long-term management requires intermittent re-evaluation of the progression of the disease process and modification of the therapy to adjust to this changing pathophysiology. Effective use of current therapeutic agents and techniques can result in near normoglycemic control in most patients with type 2 diabetes.
GLYCEMIC GOALS OF THERAPY
A variety of approaches are used to define the goals for glycemic control in patients with diabetes. The levels achieved and shown to decrease chronic complications in intervention studies such as the Diabetes Control and Complications Trial (DCCT) in patients with type 1 diabetes or the United Kingdom Prospective Diabetes Study (UKPDS) in patients with type 2 diabetes can define the goals (1,2,3). In those studies, the intensively treated patients achieved mean or median hemoglobin A1c (HbA1c) levels approaching 7.0%. These levels were attainable in a large cohort of patients and significantly reduced, but did not prevent, chronic complications.
Another approach in defining the goal is to determine if there is a threshold of glycemic control only above which chronic complications occur. An analysis of the relationship between the mean HbA1c and the development of retinopathy, nephropathy, or neuropathy in the entire DCCT cohort showed that there was no glycemic threshold short of normal glycemia throughout the entire range of HbA1c (17). The data for sustained progression of retinopathy (Fig. 41.1) showed a constant 39% reduction in risk for each 10% reduction in absolute HbA1c
values (17). The epidemiologic data from the entire UKPDS similarly showed no glycemic threshold for either microvascular or macrovascular complications (Fig. 41.2) (18).
values (17). The epidemiologic data from the entire UKPDS similarly showed no glycemic threshold for either microvascular or macrovascular complications (Fig. 41.2) (18).
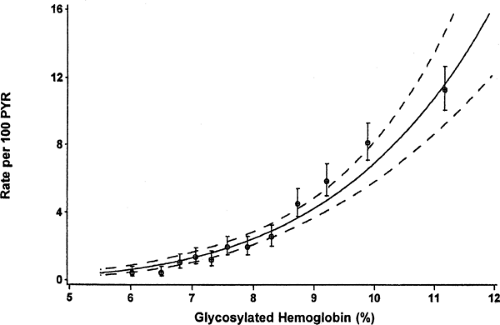 FIG. 41.1. Outcome data from the Diabetes Control and Complications Trial (DCCT) on the relationship between the risk of sustained progression of retinopathy and the mean HbA1c. There is no glycemic threshold for retinopathy development and progression. Retinopathy progression decreased 39% for every 10% reduction in mean HbA1c percentage. (Copyright © 1996 American Diabetes Association. From DCCT Research Group: The absence of a glycemic threshold for the development of long-term complications: the perspective of the Diabetes Control and Complications Trial. Diabetes 1996;45:1289–1298. Reprinted with permission from the American Diabetes Association.) |
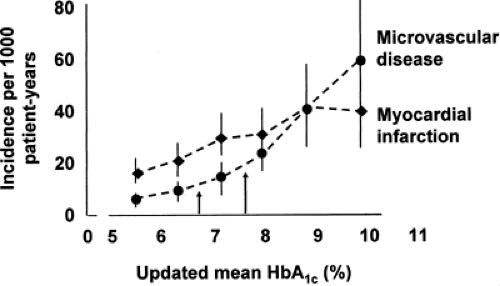 FIG. 41.2. Epidemiologic analyses of the relationships between mean HbA1c over 11 years and the incidence of microvascular and macrovascular complications in the United Kingdom Prospective Diabetes Study (UKPDS). There was no glycemic threshold for either macrovascular or microvascular complications. (From Stratton IM, Adler AI, Neil HA, et al. Association of glycemia with macrovascular and microvascular complications of type 2 diabetes (UKPDS 35): prospective observational study. BMJ 2000;321:405–412, with permission.) |
The lack of a glycemic threshold short of normal glycemia indicates that any level of increased glycemia, as well as the duration of the increase, can result in chronic complications. These data suggest that the goal for glycemic control in patients with diabetes should be levels as close to normal as possible, provided that they can be achieved without causing unacceptable side effects. For the standard HbA1cassay, normoglycemia is considered to be less than 6.0%. Obviously, other clinical factors need to be considered in determining the glycemic goal for a particular individual. The age of the individual and life expectancy are important, because the benefits of glycemic control are greatest in those who live long enough to benefit from reduced complications. The achievement of very good glycemic control requires a motivated, educated, and cooperative patient.
Although identification of the ideal glycemic goal is near-normal glycemia, it is equally important to recognize that any improvement in glycemic control decreases complication rates. Because the complication rate increases nonlinearly with the HbA1c, a 10% reduction in HbA1c from 11% to 9.9% results in a reduction in risk of progression of retinopathy of 6.57 cases per 100 patient years (17). In contrast, a decrease from 8.0% to 7.2% reduces the risk by 0.95 cases per 100 patient years (17). Table 41.1 highlights the 9-year cumulative incidence of development of retinopathy progression or microalbuminuria in patients with type 1 diabetes at mean HbA1c levels ranging from 6% to 8% (17).
TABLE 41.1. Cumulative Incidence Rates Among Patients in the Diabetes Control and Complications Trial of Developing Complications over a 9-year Period as a Function of Mean HbA1c Values | ||||||||||||||||||
|---|---|---|---|---|---|---|---|---|---|---|---|---|---|---|---|---|---|---|
| ||||||||||||||||||
In summary, the glycemic goal that can be readily achieved with an acceptable level of side effects is an HbA1cof 7.0%. However, in young patients and in those who are not limited by side effects, a goal of 6.0% would appear to be more acceptable. While any improvement in HbA1c is worthwhile, a level in the range of 7.0% or lower should be sought.
FASTING VERSUS POSTPRANDIAL HYPERGLYCEMIA
Fasting plasma glucose (FPG) levels are determined primarily by hepatic and, to a lesser degree, by renal glucose production (4,19,20). As the plasma glucose levels decrease during fasting, plasma insulin levels decrease proportionately. The decrease in plasma insulin causes an increase in adipose tissue lipolysis and skeletal muscle proteolysis and a decrease in uptake of glucose by peripheral tissue (21). At the level of the liver, the carbon skeleton from amino acids from muscle proteolysis serves as substrate and the free fatty acids from adipose tissue serve as energy source for the production of glucose. Glucose from glycogenolysis and gluconeogenesis provides the energy source for the nervous system, which has an insulin-independent requirement for glucose. Peripheral tissues use free fatty acids and ketones as their energy source. The plasma glucose level is determined by the rate of glucose production from the liver and kidney, because the rate of glucose utilization by the peripheral insulin-independent tissues is fixed. Normally, the plasma insulin level stabilizes at a level in which glucose production equals non-insulin-dependent uptake of glucose. Fasting hyperglycemia occurs when glucose production exceeds glucose utilization, as occurs with absolute or relative insulin deficiency at the level of the liver.
Postprandial plasma levels of glucose are determined in the initial phase by meal-mediated suppression of hepatic production of glucose and throughout the postprandial period by hepatic and muscle uptake of glucose (19,22). Glucose uptake requires higher plasma levels of insulin (such as those normally generated by meals) than does suppression of hepatic production of glucose. The regulation of postprandial plasma glucose therefore is highly dependent on the qualitative and quantitative aspects of meal-mediated insulin secretion, as well as by the sensitivity of muscle to insulin action (8). These phenomena account for the differential regulation of fasting and postprandial glucose that occurs in diabetes in general and in type 2 diabetes in particular.
There are many potential consequences of the differential regulation of fasting and postprandial plasma glucose levels. Postprandial hyperglycemia occurs several years before fasting hyperglycemia and is the initial phase of glucose intolerance. Contributions of postprandial hyperglycemia to the overall glycemic control, as estimated by the HbA1c, will vary with the individual and the stage of glucose intolerance (23). Some data suggest that spikes in glucose excursion may have different quantitative effects on the metabolic mechanisms involved in the pathogenesis of chronic complications (24,25). Pharmacologic agents may differentially affect fasting and postprandial hyperglycemia (10,26,27). Near-normal glycemia cannot be achieved unless both fasting and postprandial hyperglycemia are controlled.
STAGES OF TYPE 2 DIABETES
Type 2 diabetes is the end stage of a process that involves progressive loss of pancreatic β-cell function (Fig. 41.3) (12). The initial phase of this process in the majority of patients is the development of insulin resistance (28,29). Studies of low-birth-weight infants indicate that insulin resistance can be recognized in children as young as 8 years of age (30). The normal compensatory response to insulin resistance is increased insulin secretion and compensatory hyperinsulinemia. As long as the compensatory hyperinsulinemia is sufficient to overcome the insulin resistance, fasting and postprandial plasma glucose levels remain normal. If the individual with insulin resistance has the genetic predisposition to develop type 2 diabetes, the abnormalities in the pancreatic β-cell will cause a progressive loss of insulin secretory function and a loss of first-phase insulin release (31,32). This results initially in impaired glucose tolerance (IGT) and subsequently in type 2 diabetes with only postprandial hyperglycemia (23). As pancreatic β-cell function continues to deteriorate, not only does postprandial insulin secretion become inadequate, so does basal insulin secretion, and fasting hyperglycemia
ensues. During the clinical course of type 2 diabetes, insulin secretory function continues to decrease, and finally, after a number of years of clinical diabetes, many patients become severely insulin deficient and will require insulin-replacement therapy. Treatment of the abnormal glucose metabolism is determined by the stage of the disorder (Fig. 41.4).
ensues. During the clinical course of type 2 diabetes, insulin secretory function continues to decrease, and finally, after a number of years of clinical diabetes, many patients become severely insulin deficient and will require insulin-replacement therapy. Treatment of the abnormal glucose metabolism is determined by the stage of the disorder (Fig. 41.4).
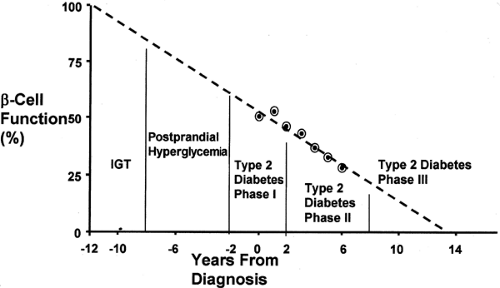 FIG. 41.3. Schematic representation of the stages of glucose intolerance as a function of pancreatic-cell insulin secretory capacity. The data points are taken from the HOMA (Homeostasis Model Assessment) calculation of percent normal-cell insulin secretory capacity as a function of time in a subset of the UKPDS population. The data are extrapolated both backward before the onset of clinical disease and forward into longer duration of disease. (Copyright © 1999 American Diabetes Association. From Lebovitz HE. Insulin secretogogues: old and new. Diabetes Rev 1999;7:139–153. Reprinted with permission from the American Diabetes Association.) |
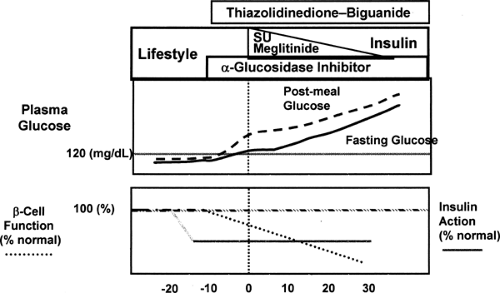 FIG. 41.4. Schematic representation of the natural history of the evolution of insulin-resistant type 2 diabetes and the matching of pathophysiology with the pharmacology of available treatments. SU, sulfonylureas. |
INSULIN RESISTANCE AND ASSOCIATED ABNORMALITIES
In the report of the American Diabetes Association Expert Committee on the Diagnosis and Classification of Diabetes Mellitus, type 2 diabetes is characterized as ranging from predominately insulin resistance with relative insulin deficiency to predominately an insulin secretory defect with insulin resistance (33). In practical terms, about 85% of patients with type 2 diabetes have significant insulin resistance, which precedes the development of type 2 diabetes by many years, as noted previously. Insulin resistance is a separate entity from type 2 diabetes. Many individuals have insulin resistance and never develop type 2 diabetes because they do not have the pancreatic β-cell abnormalities (34,35).
Insulin resistance is associated with a cluster of metabolic abnormalities, and this is referred to as the insulin resistance syndrome or the metabolic syndrome (5,36,37). All of the components of the metabolic syndrome (Table 41.2) are cardiovascular risk factors. Because macrovascular disease is responsible for a large component of morbidity and mortality in patients with type 2 diabetes, their therapy must be directed at cardiovascular risk factors as well as hyperglycemia. An important issue in any antihyperglycemic treatment regimen is the effect that regimen might have on the components of the insulin resistance syndrome that are present.
TABLE 41.2. Components of the Metabolic Syndrome | |||||||||||||||||||
|---|---|---|---|---|---|---|---|---|---|---|---|---|---|---|---|---|---|---|---|
|
PHARMACOLOGY AND USE OF CURRENTLY APPROVED ORAL ANTIHYPERGLYCEMIC AGENTS AS MONOTHERAPY
The different major classes of oral antihyperglycemic agents in current use can be divided into those that increase insulin secretion, those that decrease insulin resistance, and those that modify the rate of glucose entry from the gastrointestinal tract (Fig. 41.5). Even within these classes there are striking differences among agents. Current data on the effectiveness of newer agents on glycemic control generally are derived from the large multicenter randomized placebo-controlled phase III studies presented to regulatory agencies for approval (13,14). These studies are heavily weighted with patients who had previously received an active agent that was discontinued. In those instances, the patients randomized to placebo have a very significant deterioration of glycemic control, while the patients in the actively treated group either maintain or show improved
glycemic control. Results are reported either as treatment effect, which is the difference between active treatment and placebo treatment, or as change from baseline, which is the difference in glycemic control at the end of the treatment period compared with that before the treatment period. The difference between treatment effect and decrease from baseline is significantly less in drug-naive patients with type 2 diabetes. Recent studies with antihyperglycemic drugs have shown that the decreases in HbA1c with any treatment are directly proportional to the baseline HbA1c levels (13). In drug-naive patients with type 2 diabetes in the rosiglitazone clinical trials (Fig. 41.6), it was apparent that the same dose of the same drug resulted in a 2.2%
decrease in HbA1c compared with placebo treatment at a baseline of 10.0% but in only a 0.8% decrease at a baseline of 7.0%. These effects of the nature of the populations studied and the baseline HbA1c levels on glycemic responses are relevant because they show that it is not possible to compare the efficacy of different agents on glycemic control unless the comparison is derived from data generated from the same randomized double-blinded study.
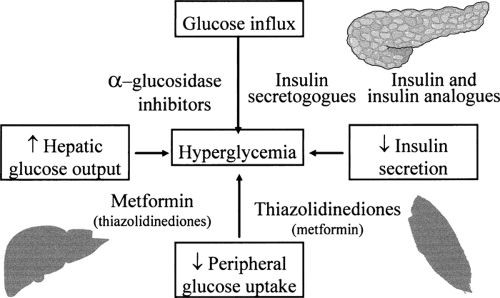 FIG. 41.5. Available pharmacologic agents ameliorate the hyperglycemia of type 2 diabetes by many different mechanisms. The antihyperglycemic effect of agents with different modes of action are additive. See Table 41.9. |
TABLE 41.9. Effect of Combination Therapy with Oral Antihyperglycemic Agents on Glycemic Control in Registration Studies | ||||||||||||||||||||||||||||||||||||||||||||||||||||||||||||||||||||||||||||||||||||||||||||||||||||||||||||||||||||||||
|---|---|---|---|---|---|---|---|---|---|---|---|---|---|---|---|---|---|---|---|---|---|---|---|---|---|---|---|---|---|---|---|---|---|---|---|---|---|---|---|---|---|---|---|---|---|---|---|---|---|---|---|---|---|---|---|---|---|---|---|---|---|---|---|---|---|---|---|---|---|---|---|---|---|---|---|---|---|---|---|---|---|---|---|---|---|---|---|---|---|---|---|---|---|---|---|---|---|---|---|---|---|---|---|---|---|---|---|---|---|---|---|---|---|---|---|---|---|---|---|---|
| ||||||||||||||||||||||||||||||||||||||||||||||||||||||||||||||||||||||||||||||||||||||||||||||||||||||||||||||||||||||||
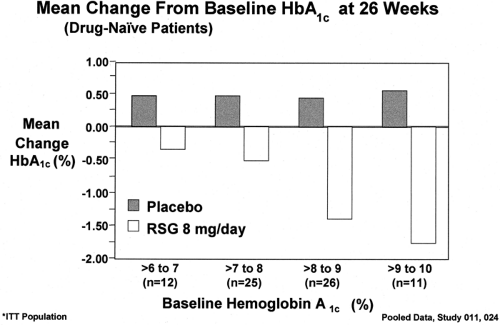 FIG. 41.6. The magnitude of glycemic response to every antihyperglycemic agent is inversely related to the baseline HbA1c. The data here are from a cohort of drug-naive patients with type 2 diabetes treated in a double-blind placebo-controlled fashion with rosiglitazone at 8 mg/day. The placebo-treated patients had the same increase in HbA1c regardless of their baseline HbA1c. |
Insulin Secretogogues
MECHANISM OF ACTION
The insulin secretogogues currently available stimulate the secretion of insulin by causing closure of the adenosine triphosphate (ATP)-dependent potassium channel (KATP) in the plasma membrane of the β-cell (38,39,40). The KATP channel is composed of two different types of subunits and is assembled from four subunits of each type (Fig. 41.7). The Kir-6.2 subunits make up the inward rectifier through which K+ is transported from the intracellular compartment to the extracellular compartment. The SUR-1 subunit is attached to the Kir-6.2 subunit and regulates whether the KATP channel is open or closed. The SUR-1 subunit contains a binding site for sulfonylurea and related molecules, as well as binding sites for ATP and adenosine diphosphate (ADP). When the ATP:ADP ratio increases, as occurs when the plasma glucose level is elevated or when sulfonylureas or the newer insulin secretogogues bind to the SUR-1 subunit, the KATP channel closes (Fig. 41.8). When the KATP channel closes, K+ accumulates at the plasma membrane and causes depolarization of the membrane adjacent to the closed channels. Depolarization of the membrane causes voltage-dependent L-type calcium channels in the microenvironment to open and for Ca2+ to enter the intracellular compartment from the extracellular compartment and increase the cytosolic Ca2+ concentration in the β-cell. The increase in Ca2+ stimulates the migration and exocytosis of the insulin granule.
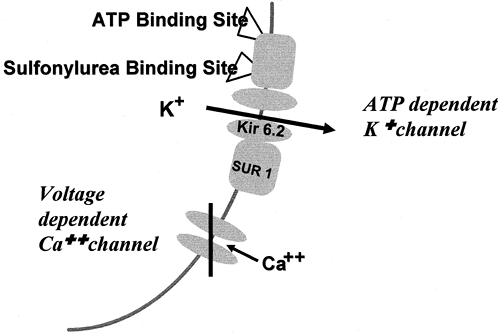 FIG. 41.7. The pancreatic β-cell KATP channel is open and extruding potassium ions when the plasma glucose level is low. The adjacent voltage-dependent calcium channel is closed. The KATP channel consists of two types of subunits: the Kir-6.2 subunit, which makes up the rectifier; and the SUR-1 subunit, which regulates opening and closing of the channel. |
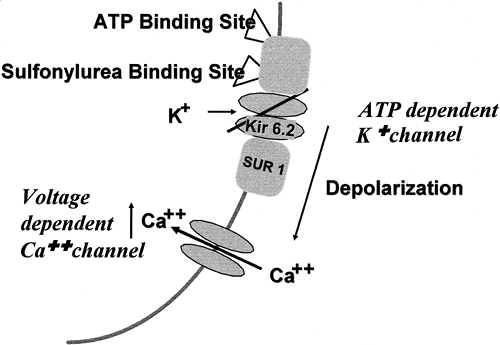 FIG. 41.8. When the plasma glucose level increases, the ATP:ADP ratio increases, causing the KATP channel to close. That initiates local depolarization of the plasma membrane, resulting in the opening of the L-type voltage-dependent calcium channels. Calcium ions enter the cell, and the rise in cytosolic calcium ion concentration stimulates insulin secretion. |
All of the sulfonylureas and the newer non-sulfonylurea insulin secretogogues, repaglinide and nateglinide, act by binding to the SUR-1 subunits of the KATP channels, causing them to
close (41,42,43). Differences in the insulin secretory characteristics of the various insulin secretogogues are dependent on their pharmacokinetic properties and the affinity and kinetics of their binding to the SUR-1 subunit (41,42,43).
close (41,42,43). Differences in the insulin secretory characteristics of the various insulin secretogogues are dependent on their pharmacokinetic properties and the affinity and kinetics of their binding to the SUR-1 subunit (41,42,43).
PHARMACOLOGY
The normal regulation of insulin secretion is tightly coupled to the plasma glucose level (44,45). Increasing plasma glucose levels, such as those that occur following ingestion of food, result in an almost immediate increase in insulin secretion. Decreasing plasma glucose levels are associated with a rapid decline in the secretion and plasma levels of insulin. Fasting is accompanied by reductions in insulin secretion sufficient to increase hepatic production of glucose to maintain glucose homeostasis. The ideal insulin secretogogue, therefore, would be one that restores to normal the defective early meal-mediated insulin secretion of type 2 diabetes, increases insulin secretion to adequately overcome the insulin resistance, stimulates insulin release only in response to elevated plasma glucose levels, and has little or no lag time in its insulin secretory response to rapidly changing plasma glucose levels. None of the available insulin secretogogues fulfills all of these properties.
Early postprandial hyperglycemia in the individual with diabetes is a consequence of delayed and inadequate early secretion of insulin (44,45,46). Late postprandial hypoglycemia in these subjects with type 2 diabetes results from an increase in drug-mediated late insulin secretion that is further accentuated if there is an early exaggerated postprandial hyperglycemia. Fasting or nocturnal hypoglycemia is more likely to occur in patients with type 2 diabetes administered insulin secretogogues that have long half-lives and stimulate insulin secretion in the presence of low glucose levels (45).
The factors determining the clinical effects of the available insulin secretogogues are listed in Table 41.3 and tabulated for each secretogogue in Table 41.4 (13,47). The major factors to consider in prescribing an insulin secretogogue are the rate of onset of its action, the duration of its action, the degree to which its action is dependent on the plasma glucose level, and its spectrum of side effects, including interaction with KATP channels in other tissues. The major complications of therapy with insulin secretogogues are hypoglycemia and weight gain, both of which are manifestations of the inability of these agents to simulate normal physiologic insulin secretion (47,48,49,50). The closer a particular insulin secretogogue can restore insulin secretory physiology to normal in the patient with type 2 diabetes, the less these two complications will occur. The effectiveness of all insulin secretogogues in stimulating insulin secretion and in reducing hyperglycemia is dependent of the presence of functioning β-cells. Insulin secretogogues are ineffective in patients with type 1 diabetes, in patients with latent autoimmune diabetes of adults (LADA), and in the later stages of type 2 diabetes when pancreatic β-cell function is markedly deficient.
TABLE 41.3. Factors Influencing the Clinical Effects of Insulin Secretogogues | ||||||||
|---|---|---|---|---|---|---|---|---|
|
TABLE 41.4. Characteristics of Specific Insulin Secretogogues | ||||||||||||||||||||||||||||||||||||||||||||||||||||||||||||||||||||||||||||||||||||||||||||||||||||||||||||
|---|---|---|---|---|---|---|---|---|---|---|---|---|---|---|---|---|---|---|---|---|---|---|---|---|---|---|---|---|---|---|---|---|---|---|---|---|---|---|---|---|---|---|---|---|---|---|---|---|---|---|---|---|---|---|---|---|---|---|---|---|---|---|---|---|---|---|---|---|---|---|---|---|---|---|---|---|---|---|---|---|---|---|---|---|---|---|---|---|---|---|---|---|---|---|---|---|---|---|---|---|---|---|---|---|---|---|---|---|
| ||||||||||||||||||||||||||||||||||||||||||||||||||||||||||||||||||||||||||||||||||||||||||||||||||||||||||||
KATP channels are present in many other tissues, including brain, myocardium, and vascular smooth muscle cells (38,39,40,51). The SUR subunit of the brain KATP channel is the same as that of the pancreatic β-cell (SUR-1), while the isoforms in myocardium and vascular smooth muscle cell are different (SUR-2A and SUR-2B). The abilities of various insulin secretogogues to interact with the different isoforms of the SUR subunit are not the same. This results in pharmacologic differences and has been postulated to produce clinical differences in side-effect profiles.
SPECIFIC CLASSES OF INSULIN SECRETOGOGUES
Sulfonylureas
Sulfonylurea drugs have been used in the treatment of type 2 diabetes since the early 1950s. Extensive literature, including many review articles, is available (13,45,47). The major new information concerning the use of sulfonylureas in the treatment of type 2 diabetes has come from the UKPDS (12,52,53,54), the development programs of the newer sulfonylureas such as glimepiride (55), and recent studies investigating the effects of sulfonylureas on myocardial and vascular responses to ischemia (56,57,58,59).
The sulfonylurea drugs do not appear to correct the defect in early insulin secretion characteristic of type 2 diabetes (60,61). Their primary action is to increase the late stage of insulin secretion. This increases the likelihood of late postprandial and fasting hypoglycemia. The sulfonylurea drugs do not increase insulin biosynthesis and, indeed, seem to inhibit proinsulin biosynthesis in vitro. There is no evidence that they are either β-cytotropic or that they facilitate β-cell exhaustion (12,47). In the UKPDS, patients treated with sulfonylureas showed an increase in β-cell function for the first year but thereafter showed the same rate of loss of β-cell function as the conventionally treated group (12). Questions have been raised concerning the possibility that sulfonylureas, because of their prolonged effects on the pancreatic β-cell KATP channels, could lead to desensitization, with diminution of their pharmacologic effects. Several clinical studies showing that higher doses of sulfonylureas may be less effective than modest doses in lowering hyperglycemia provide some support for this hypothesis (62,63). Continuous in vitro incubation of β-cells with glyburide has been shown to lead to an increase in functionally deficient KATP channels (64).
Previous studies have shown that sulfonylureas can exert a variety of extrapancreatic actions in laboratory models in vivo and in vitro (47). It has been difficult to demonstrate conclusively any of these effects in humans. Some in vivo studies in humans have shown that sulfonylureas can lower plasma glucose levels under conditions in which the peripheral plasma insulin levels are unchanged. These studies have not excluded small changes in the portal vein insulin concentrations, which influence the liver but are not measurable in peripheral blood. Two effects of sulfonylureas that occur in humans that may result in extrapancreatic effects are interactions with KATP channels in other tissues (39) and direct effects on calcium ion-mediated exocytosis (65).
KATP channels in cardiac myocytes and vascular smooth muscle cells have SUR regulatory subunits, which differ somewhat from the SUR-1 subunit in β-cells (38,39,40). These different subunits change their binding characteristics such that they may have less affinity for some ligands that cause insulin secretion than for others. Brain-cell plasma membranes contain KATP channels that have the same regulatory subunit as pancreatic β-cells. It is therefore possible that some sulfonylureas might interact with KATP channels in tissues other than β-cells and cause extrapancreatic effects. Another mechanism by which specific sulfonylureas might cause extrapancreatic effects is through direct enhancement of calcium-mediated exocytosis of other hormones that are stored in secretory granules. Presently, there is little evidence that sulfonylureas exert any clinically significant extrapancreatic effects in humans. The only exception may be effects on the myocardial and vascular smooth muscle responses to ischemia and hypoxia.
Chlorpropamide
Chlorpropamide is a first-generation sulfonylurea that has been prescribed extensively worldwide for almost 40 years. At dosages ranging from 100 to 500 mg once a day, it is highly effective in reducing hyperglycemia, but because of its very long plasma half-life, it has been associated with a significant incidence of severe and protracted hypoglycemia, particularly in the elderly (47,66). Other significant side effects are water retention with hyponatremia and alcohol-induced facial flushing (45). Chlorpropamide is unique among sulfonylureas in that it stimulates secretion of antidiuretic hormones and potentiates an antidiuretic hormone effect in the renal tubules. The effect on water balance is thought to explain the observation in the UKPDS of an increase in systolic and diastolic blood pressure as well as a greater need for antihypertensive therapy in the 619 patients treated with chlorpropamide than in patients treated with insulin, glyburide, or conventional therapy (2). In the UKPDS, chlorpropamide treatment reduced HbA1c significantly more than did glyburide or insulin; however, this was not accompanied by any greater reduction in risk for progression of retinopathy (2). Many previous studies have noted that hypoglycemia is a major risk of chlorpropamide treatment. Major hypoglycemic events occurred less frequently in the UKPDS in the chlorpropamide-treated cohort than in the glyburide-treated cohort (2).
Glyburide
Glyburide (glibenclamide) is currently the most widely prescribed sulfonylurea—but not because it is more effective or safer than other sulfonylureas. It is marketed as a formulation with poor and variable bioavailability (dosage 1.25–20 mg daily) and as a micronized formulation with relatively good and consistent bioavailability (dosage 1.5–12 mg daily) (45,47,67). Its efficacy in reducing hyperglycemia appears to be equal to that of other sulfonylureas, but it is associated with a high rate of serious side effects, including its long duration of action, with a rate of serious and fatal hypoglycemia that is significantly higher than that with other sulfonylureas, modest weight gain, and a relative lack of specificity on the different KATP channels (67,68,69). Careful evaluation of the 615 patients with type 2 diabetes treated with glyburide for a mean of 11 years in the UKPDS has clearly defined the characteristics of chronic glyburide therapy (2). It is most effective in controlling hyperglycemia in patients with newly diagnosed type 2 diabetes for the first year or 2 and then begins to lose effectiveness progressively with time (secondary failure or sulfonylurea ineffectiveness) (52,53,54). Glyburide treatment alone was relatively ineffective in controlling hyperglycemia after 4 or 5 years (54). The median decrease in HbA1c in patients treated with glyburide as compared with patients receiving conventional (diet) treatment over 10 years was 0.7% (7.2% vs. 7.9%) (2). Weight gain occurred primarily in the first 3 or 4 years of treatment and was maintained throughout the study, so that at 10 years the glyburide-treated patients had gained 1.7 kg more than the conventionally treated patients (2). Serious hypoglycemia occurred primarily during the first few years of glyburide therapy, when it had been most effective in reducing hyperglycemia. Major hypoglycemic events were noted in approximately 1.4% of patients in year 1, 1.3% in year 2, and 0.4% in year 3 (2). These rates of serious hypoglycemic events are comparable to those reported in other large series and are greater than those with other sulfonylureas (Table 41.5) (68,70,71,72).
TABLE 41.5. Serious Hypoglycemia Reported in Large Retrospective Studies | ||||||||||||||||||||||||
|---|---|---|---|---|---|---|---|---|---|---|---|---|---|---|---|---|---|---|---|---|---|---|---|---|
| ||||||||||||||||||||||||
Glipizide
Glipizide is a sulfonylurea that is available in both a short-acting formulation and in an extended-release formulation (glipizide- g astro i ntestinal t herapeutic s ystem, or glipizide- GITS) (45). The short-acting form is rapidly absorbed and is completely bioavailable. It is metabolized by oxidative hydroxylation and is eliminated with a half-life of 2 to 4 hours (45).
Its elimination is not affected by mild to moderate renal insufficiency (creatinine clearance ≥30 mL/min) (45). Glipizide is administered once or twice a day. Its efficacy is equal to that of glyburide in controlling hyperglycemia, but because of its metabolism and more rapid elimination, therapy with glipizide is associated with less hypoglycemia (45). The official maximum dosage of glipizide in the United States is 40 mg per day, although available clinical studies show little or no benefit in giving more than 15 or 20 mg per day. Glipizide should be administered before meals, as its absorption may be mildly delayed by food ingestion.
Its elimination is not affected by mild to moderate renal insufficiency (creatinine clearance ≥30 mL/min) (45). Glipizide is administered once or twice a day. Its efficacy is equal to that of glyburide in controlling hyperglycemia, but because of its metabolism and more rapid elimination, therapy with glipizide is associated with less hypoglycemia (45). The official maximum dosage of glipizide in the United States is 40 mg per day, although available clinical studies show little or no benefit in giving more than 15 or 20 mg per day. Glipizide should be administered before meals, as its absorption may be mildly delayed by food ingestion.
The extended-release formulation of glipizide provides once-a-day dosage of 5 to 20 mg (73,74). Plasma levels of glipizide 24 hours after doses of 5 mg and 20 mg of glipizide-GITS (Glucotrol XL) are 54 ng/mL and 310 ng/mL, respectively. The decreases in HbA1c in clinical trials with glipizide-GITS were 1.50% and 1.84% compared with placebo treatment. The decrease in HbA1c was maximal at 5 mg per day. FPG level was reduced 57 mg/dL to 74 mg/dL compared with placebo treatment. The extended-release form appears to have glucose-lowering effects similar to those of immediate-release glipizide, as measured by the improvement in HbA1c. In a study comparing glipizide-GITS to immediate-acting glipizide, the authors concluded that the glipizide-GITS formulation at dosages of 5 mg and 20 mg have an improved metabolic profile compared with that of immediate-acting glipizide; however, the design of the study makes such a conclusion tenuous. No increase in hypoglycemia was noted with the extended-acting form.
Glimepiride
Glimepiride is the newest of the sulfonylureas to be approved for use. It is said to be more selective for the β-cell KATP channel than for the cardiovascular tissue KATP channel (75). It appears to bind to a slightly different part of the sulfonylurea-binding site than does glyburide, although the two sulfonylureas displace each other from their respective binding sites. Glimepiride associates 2.5- to 3.0-fold faster and dissociates 8.0- to 9.0-fold faster than glyburide from its β-cell KATP-binding site (75,76). Insulin release is therefore more rapid and of shorter duration than that with glyburide. Hyperglycemic and euglycemic-hyperinsulinemic clamp studies in patients with type 2 diabetes demonstrated that glimepiride does not restore first-phase insulin secretion and that it increases second-phase insulin secretion, whole-body glucose uptake, and increases insulin sensitivity (61). Some studies have suggested that glimepiride reduces hyperglycemia with less insulin secretion than that required by other sulfonylureas, and this has led to the claim that glimepiride has an insulin-sparing action (57,77,78,79,80). The data are marginally significant, and additional studies are required to substantiate this claim. For glimepiride, as for all other sulfonylureas, there are claims that it has extrapancreatic effects. Some of the effects described are an increase in glucose uptake and utilization by an increase in the translocation of the GLUT4 transporter protein in adipose and muscle cells, an effect on the regulation of the intracellular routing of the insulin receptor complexes toward degradative pathways, and an increased association of the insulin receptor with protein kinase C isozymes (76,79). These extrapancreatic effects have been demonstrated in in vitro systems, and their relevance to glimepiride effects in humans is debatable.
Related posts:
 Cell Biology of Insulin Secretion
Biology of Skeletal Muscle
Exercise in Patients with Diabetes Mellitus
Epidemiology of Late Complications of Diabetes: A Basis for the Development and Evaluation of Preventive Programs
Management of Diabetic Kidney Disease
Joint and Bone Manifestations of Diabetes Mellitus
Cell Biology of Insulin Secretion
Biology of Skeletal Muscle
Exercise in Patients with Diabetes Mellitus
Epidemiology of Late Complications of Diabetes: A Basis for the Development and Evaluation of Preventive Programs
Management of Diabetic Kidney Disease
Joint and Bone Manifestations of Diabetes Mellitus
Stay updated, free articles. Join our Telegram channel

Full access? Get Clinical Tree


