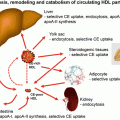
Fig. 14.1
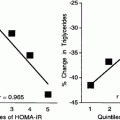
Prospective analysis of all-cause mortality in the FinnDiane cohort. Prospective analysis of all-cause mortality in the FinnDiane cohort of type 1 diabetes after an average of 7 years of follow-up. At baseline, 2,296 patients had normal AER, 504 had microalbuminuria, 579 had macroalbuminuria, and 293 had end-stage renal disease. Plot a depicts the adjusted hazard ratios with respect to normal AER. Plot b depicts the standardized mortality rate with respect to the age and sex groups in the Finnish background population (reference value was set to 1.0). The figure was adapted from [38]
The triad of poor glycemic control, obesity, and albuminuria indicates a high-risk vascular phenotype [68, 74]. All three risk factors overlap and are concurrently associated with dyslipidemia, particularly in the form of increased triglycerides and decreased HDL cholesterol. This also means that it is difficult to ascertain causal relationships between serum lipoproteins and diabetic kidney injury since both compartments may be parts of a larger complex of systemic atherogenic perturbations. Particularly in type 2 diabetes, lipid abnormalities such as high triglycerides, excessive postprandial lipidemia, small dense LDL cholesterol, and low levels of HDL cholesterol are frequently seen [106]. Hence, similar lipid abnormalities as in patients with end-stage renal disease are often observed in patients with type 2 diabetes even prior to the diagnosis of diabetes. The evidence regarding the kidney pathology is also unclear: it may be confounded by age-related phenomena and seems to be less related to urinary albumin excretion or GFR than in type 1 diabetes [32]. In this section, we primarily focus on the combined diagnostic and prognostic significance of kidney disease and lipoproteins in (type 1) diabetes and briefly discuss the biological implications to the lipoprotein composition and functionality.
Conventional Lipoprotein Lipids, Albuminuria, and Kidney Function
Patients with type 1 diabetes but without complications show no adverse changes in their clinical lipid profile (total triglycerides, cholesterol, and HDL cholesterol), and patients with good glycemic control often have more favorable lipids than the background population [21, 76, 109]. On the other hand, plasma lipid abnormalities were reported in patients with nephropathy in a number of earlier studies [49, 50, 113], and the association between dyslipidemia and diabetic nephropathy has since been confirmed in several larger studies (Table 14.1).
Table 14.1
Conventional lipid profile in patients with type 1 diabetes and diabetic nephropathy
Study | Design | Albuminuria | Kidney dysfunction | Additional details |
|---|---|---|---|---|
DCCT/EDIC [48] | Cross-sectional, N = 968 | ↑TG, ↓HDL-C, ↑TotC, ↑LDL-C | n/a | HDL-C significant only in univariate analyses |
DCCT/EDIC [24] | Progression from incident microalbuminuria to macroalbuminuria, N = 325, 13-year follow-up | ↑TG, ↑TotC, ↑LDL-C | No findings | Lower baseline TG, TotC, and LDL-C associated with regression to normal AER |
Estudio Diamante [25] | Cross-sectional, N = 1,822 | ↑TG, ↑TotC | ↑TG, ↑TotC | LDL-C not reported |
EURODIAB [65] | Cross-sectional, N = 2,205 | ↑TG, ↓HDL-C, ↑TotC, ↑LDL-C | n/a | Sex-dependent findings on HDL-C |
Progression from normal AER, N = 1,134, 7.3-year follow-up | ↑TG, ↓HDL-C, ↑TotC, ↑LDL-C | n/a | LDL-C and HDL-C significant when adjusted for diabetes duration, glycemic control, and baseline AER | |
EURODIAB [35] | Progression from microalbuminuria, N = 352, 7.3-year follow-up | ↑TG | n/a | Lower baseline TG associated with regression to normal AER |
FinnDiane [109] | Cross-sectional, N = 2,927 | ↑TG, ↓HDL-C, ↑TotC, ↑LDL-C | ↑TG, ↓HDL-C, ↑TotC, ↑LDL-C | LDL-C and HDL-C significant in macroalbuminuria and ESRD |
FinnDiane [110] | Progression to micro-, macroalbuminuria or ESRD, N = 2,304, 5.4-year follow-up | ↑TG, ↑TotC | ↑TG, ↓HDL-C, ↑TotC, ↑LDL-C | |
Pittsburgh [17] | Progression from normal AER, N = 256, 2-year follow-up | ↑TG, ↑LDL-C | n/a | TotC not reported |
Pittsburgh [77] | Progression to macroalbuminuria or ESRD, N = 485, 10-year follow-up | ↑TG, ↑TotC, ↑LDL-C | ↑TG, ↑TotC, ↑LDL-C | Lipids significant only if progression within the first 5-year period |
Nephropathy Family Study [64] | Progression from normal AER, N = 895, 2.3-year follow-up | ↑TG, ↑TotC | n/a | Higher non-HDL cholesterol associated with progression |
German Diabetes Documentation System [88] | Progression to micro-, macroalbuminuria or ESRD, N = 27,805, 2.5-year follow-up | ↑TG, ↑TotC, ↑LDL-C | ↑TG, ↑TotC, ↑LDL-C | Dyslipidemia (TotC > 200 mg/dL, LDL-C > 160 mg/dL or TG > 150 mg/dL) associated with progression |
Angers cohort [41] | Progression to micro-, macroalbuminuria or ESRD, N = 297, 7-year follow-up | ↑TG, ↓HDL-C | ↑TG, ↓HDL-C | Elevated plasma creatinine was used as an additional diagnostic category |
Steno Diabetes Center [44] | Rate of GFR decline, N = 301, 6.7-year follow-up | n/a | ↑TotC | Only TotC reported |
Steno Diabetes Center [45] | Progression to micro- or macroalbuminuria, N = 277, 18-year follow-up | See details | n/a | Lower baseline TotC associated with regression to normal AER |
Only TotC reported | ||||
Joslin Study [83] | Regression from microalbuminuria, N = 386, 6-year follow-up | See details | n/a | Lower baseline TG and TotC associated with AER reduction |
DCCT/EDIC
The Diabetes Control and Complications Trial (DCCT) was a multicenter clinical trial that compared intensive diabetes therapy with the current conventional treatment (between 1983 and 1993) in a cohort of 1,441 patients with type 1 diabetes. During the trial, the intensively treated patients had lower total triglycerides, total cholesterol, and calculated LDL cholesterol, but HDL cholesterol was unaffected [22]. At the same time, a significant reduction in the incidence of albuminuria was observed [23]. Specific analyses of urinary albumin excretion rate and serum lipoprotein lipids were made for the combined trial and follow-up period in the Epidemiology of Diabetes Interventions and Complications (EDIC) cohort of 968 patients [48]. Triglycerides, cholesterol, and calculated LDL cholesterol were increased in patients with microalbuminuria (40 < AER < 300 mg/24 h) and macroalbuminuria (AER > 300 mg/24 h) when tested for the overall trend and adjusted for age, diabetes duration, hypertension, hemoglobin A1c, body mass index (BMI), waist–hip ratio (WHR), and DCCT randomization group. A decreasing trend was observed for HDL cholesterol in women and in the full dataset, but these associations could be fully explained by the aforementioned risk factors and confounders.
The risk factors for long-term renal outcomes were examined in the 14th year of the EDIC Study in 325 patients [24] who developed persistent microalbuminuria (30 < AER < 300 mg/24 h) and were subsequently followed for regression to normal AER (36 %), progression of macroalbuminuria (30 %), and/or declining kidney function (18 %). Kidney function was determined by estimated glomerular filtration rate (eGFR). Total triglycerides, cholesterol, and calculated LDL cholesterol were associated with progression to macroalbuminuria (increased concentrations) and regression to normal AER (decreased concentration). No associations were detected for incident impaired eGFR, and HDL cholesterol failed to predict the renal outcomes altogether.
EURODIAB
Cross-sectional associations between conventional lipoprotein measures and albuminuria were also seen in the EURODIAB IDDM Complications Study [65]. The set of 3,250 patients with type 1 diabetes were recruited from 16 European countries and represent age groups from 15 to 60 years. Increased concentrations of triglycerides, cholesterol, and calculated LDL cholesterol were observed for microalbuminuria (20 < AER < 200 μg/min) or macroalbuminuria (AER > 200 μg/min) for both sexes. Increased concentrations of triglycerides, cholesterol, and calculated LDL cholesterol were observed for microalbuminuria (20 < AER < 200 μg/min) or macroalbuminuria (AER > 200 μg/min) for both sexes. Furthermore, HDL cholesterol was decreased in patients with macroalbuminuria and, overall, the lipid abnormalities were more pronounced in the macroalbuminuric group. Of note, diabetes duration was highlighted as an important factor: associations between serum lipoprotein lipids and microalbuminuria were seen only in those patients with >5 years of duration.
A set of 1,134 patients with normal baseline AER were followed for a mean of 7.3 years in the EURODIAB Prospective Complication Study. The incidence of microalbuminuria was 12.6 %, which corresponds to 18 new cases per 1,000 person-years. In a multivariate model, baseline hemoglobin A1c, AER, triglycerides, and waist–hip ratio predicted the progression to microalbuminuria [12]. A sub-study of 352 patients with baseline microalbuminuria identified increased AER, suboptimal metabolic control, excess body fat, and peripheral neuropathy as significant risk factors for the progression to macroalbuminuria [35]. During an average of 7.3 years, 51 % regressed to normal AER, 36 % remained microalbuminuric, and 14 % progressed to macroalbuminuria. Overall, the lipoprotein lipids were not associated with the progressive kidney phenotype. However, fasting triglyceride concentration at baseline was a weak predictor of progression, and the lowest concentration was seen in the group that regressed.
FinnDiane
The Finnish Diabetic Nephropathy Study (FinnDiane) represents a population-based sample of long-standing type 1 diabetes in Finland. In cross-sectional analyses of 2,927 patients, patients with normal urinary albumin excretion rate (AER < 30 mg/24 h) had the lowest, and those with macroalbuminuria (AER > 300 mg/24 h) had the highest triglyceride concentrations [109]. Glomerular filtration rate was also associated with lipid abnormalities: patients with impaired kidney function (eGFR < 60 mL/min/1.73 m2) had higher triglycerides, total cholesterol, and lower HDL cholesterol than patients with normal kidney function (eGFR > 90 mL/min/1.73 m2) or patients with mildly impaired kidney function (60 < eGFR < 90 mL/min/1.73 m2).
In the prospective part of the FinnDiane Study, 2,304 patients with type 1 diabetes, followed for a mean of 5.4 ± 2.0 years, were examined [110]. Baseline triglycerides predicted progression of kidney disease at all stages, including progression to micro- and macroalbuminuria and to end-stage renal disease. These associations could not be fully explained by conventional risk factors other than baseline AER. Several lipid variables predicted progression to end-stage renal disease, but when eGFR was included in the model, total cholesterol was the only significant lipid predictor.
The definition of the kidney disease phenotype may influence the results. In a model where normal AER and microalbuminuric groups were pooled, triglycerides predicted progression to macroalbuminuria, and the results could not be fully explained by either baseline AER or eGFR. When the patient set was divided into quartiles of triglycerides, the highest quartile had consistently higher hazard ratios for progression at all stages of nephropathy. From a practical point of view, however, no clear threshold could be observed for triglycerides and the progression of diabetic nephropathy.
Pittsburgh EDC
A total of 658 patients with childhood onset of type 1 diabetes were included in the Pittsburgh Epidemiology of Diabetes Complications Study. A 2-year follow-up study of 256 patients indicated that poor glycemic control, increased LDL cholesterol, long duration of diabetes, and high systolic blood pressure at baseline were predictive of incident microalbuminuria, defined as AER > 20 μg/min [17]. Glycemic control was a significant predictor in all subgroup analyses. In men, age and AER were also important predictors, whereas duration of diabetes and triglycerides were important in women. Calculated LDL cholesterol was significant in patients with type 1 diabetes duration <20 years, but triglycerides and systolic blood pressure predicted progression in the group with at least 20 years of duration. In a more recent study, 485 patients with or without overt nephropathy at baseline (AER < 200 μg/min) were followed for 10 years [77]. Estimated glucose disposal rate (a surrogate marker for insulin sensitivity) was predictive of overt nephropathy during the full follow-up. White blood cell count, triglycerides, calculated LDL cholesterol, non-HDL cholesterol, and systolic blood pressure predicted progression during the first 5 years of follow-up.
German Diabetes Documentation System
The German Diabetes Documentation System cohort includes children, adolescents, and adults with a largely pediatric and adolescent onset of type 1 diabetes from Germany and Austria. A set of 27,805 patients were followed for an average of 2.5 years. The study revealed that triglycerides and LDL cholesterol were significant risk factors for the development of microalbuminuria [88]. Dyslipidemia, defined as at least one lipid variable over the cutoff level of >200 mg/dL for total cholesterol, >160 mg/dL for LDL cholesterol, and >150 mg/dL for triglycerides, was associated with the development of overt nephropathy.
Nephropathy and Dyslipidemia in Type 2 Diabetes
Type 2 diabetes itself is strongly linked to similar lipoprotein abnormalities that are seen in patients with type 1 diabetes and microvascular complications, and it is therefore problematic to isolate the nephropathy-related changes from the background dyslipidemia. Nevertheless, more adverse lipid profiles are observed in patients with nephropathy, although the conventional lipids seem to hold limited prognostic utility. For instance, impaired kidney function was investigated in the Health Professionals Follow-Up Study (HPFS). In a cross-sectional sub-study of 732 men with type 2 diabetes [62], non-HDL cholesterol and triglycerides were increased from the highest (>90 mL/min/1.73 m2) to the lowest eGFR category (<60 mL/min/1.73 m2). On the other hand, a prospective analysis of 516 type 2 diabetic women from the Nurses’ Health Study showed that an estimated eGFR decline of over 25 % during an 11-year follow-up was not associated with the conventional lipid profile [63].
A dyslipidemic pattern was observed in 275 Taiwanese patients [112]: increased total cholesterol and non-HDL cholesterol, especially when combined with hypertriglyceridemia, were significantly associated with albuminuria (defined as ACR > 30). In 1,557 Italian patients with type 2 diabetes, microalbuminuria was associated with diabetes duration, glycemic control, and blood pressure, but not with the lipid measures in univariate analyses [92].
The UK Prospective Diabetes Study examined patients with newly diagnosed type 2 diabetes and followed a subset of 4,031 patients with urinary albumin < 30 mg/L and a subset of 5,032 patients (criteria not mutually exclusive) with normal creatinine clearance (>60 mL/min/1.73 m2) at baseline [90]. Increased plasma triglycerides were associated with incident micro- and macroalbuminuria, but not with declining creatinine clearance. The opposite was true for total and calculated LDL cholesterol: increased baseline concentrations predicted impaired creatinine clearance at follow-up. Decreased HDL cholesterol was also predictive of impaired creatinine clearance.
In a prospective study of 671 American Indians [28], high HDL cholesterol was inversely associated with incident increase in AER in women after 3.9 years of follow-up, and a suggestive positive association was found for triglycerides in men. Incident microalbuminuria (30 < AER < 300 mg/24 h) and macroalbuminuria (AER > 300 mg/24 h) were investigated in a set of 574 Israeli patients with a recent onset of type 2 diabetes [89]. The results were compatible with the previous reports: the combination of hypertension, increased total cholesterol, and poor glycemic control indicated the group at high risk for incident diabetic nephropathy.
A set of 3,667 type 2 diabetic patients with AER < 20 μg/min and eGFR > 60 mL/min/1.73 m2 were examined in the Swedish National Diabetes Register for incident diabetic nephropathy [1]. Increased triglycerides and decreased HDL cholesterol at baseline predicted incident albuminuria (20 % of individuals) and both were also predictive of impaired eGFR. On the other hand, total or LDL cholesterol were not significant predictors. Of note, wider prescription of medications for lipidemia and hypertension were the most likely causes for overall decreases in LDL cholesterol and blood pressure at follow-up.
A study of the Hong Kong Diabetes Registry approached the issue from the opposite angle: the researchers reported that in a prospective cohort of 2,761 type 2 diabetic patients (2.8-year follow-up), macroalbuminuria predicted the incidence of abnormally high total cholesterol and calculated LDL cholesterol, while reduced eGFR predicted abnormally low HDL cholesterol [118].
Interpretation of the Epidemiological Data
The cross-sectional analyses suggest that increased triglycerides, total cholesterol and LDL cholesterol, and a reduction in HDL cholesterol are typically seen in patients with diabetes and nephropathy. The dyslipidemia is more evident in advanced nephropathy, but this could be a consequence of poor glycemic control that, by itself, promotes the development of microvascular injuries. Furthermore, altered nutritional status and secondary effects of kidney failure may curb the increase in cholesterol but simultaneously cause an imbalance between triglycerides and HDL cholesterol when patients approach end-stage renal disease [14, 86].
Interestingly, when both hemoglobin A1c and BMI are high in type 1 diabetes, the lipid profile resembles that of the dyslipidemia typically observed in type 2 diabetes and the metabolic syndrome [68, 108]. The weight-adjusted insulin dose tends to be similar or even higher in these patients [70], which suggests that the dyslipidemia in today’s type 1 diabetes could be at least partially related to increased insulin resistance rather than inadequate insulin administration. This fits to the concept of “double diabetes” and insulin resistance as major pathogenetic contributors to diabetic nephropathy [37, 58].
The classical linear analyses may hide the inherent complexity of the lipoprotein lipid profile. Figure 14.2 depicts the same dataset that was introduced in Fig. 14.1, but this time dissected by a multivariate nonlinear visualization method. Details of the self-organizing map (SOM) are available in supplements of previously published articles [68, 70]. Briefly, the method assigns a two-dimensional coordinate on the map for each patient based on the observed biochemical profiles. The map can then be colored according to a trait such as cholesterol concentration or prevalence of nephropathy in a given area. The idea is similar to coloring the world map based on average income or prevalence of diabetes—in that case the coordinates represent geographical locations. In Fig. 14.2, the map is always the same, so if a patient is located on the top-left corner in Plot a, he or she is also located in the top-left corner in every other plot.
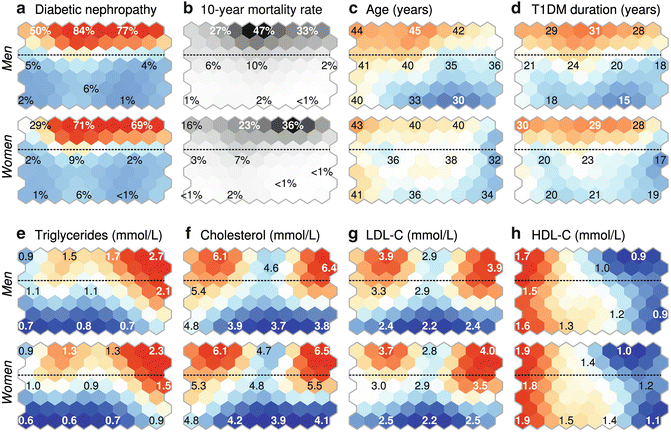

Fig. 14.2
Self-organizing map analysis of 4,197 patients with type 1 diabetes from the FinnDiane Study. The figure can be interpreted the same way as a geographical map. Suppose the rectangular area is a map of a city, and the city is divided into hexagonal neighborhoods. In each neighborhood, the residents correspond to patients who are similar with respect to their serum and urine biochemical profiles. The locations of individuals were mathematically optimized by the self-organizing map algorithm (in a geographical map the locations would be physical coordinates). For the visualization, the rectangular map is colored based on the average characteristics in a neighborhood. For example, patients in the top part of the map show a high prevalence of diabetic nephropathy, which is indicated by the red color (Plot a). Diabetic nephropathy was defined as macroalbuminuria or end-stage renal disease. The figure was adapted from [68]
The connection between diabetic nephropathy and mortality is obvious (Fig. 14.2a, b), as one would expect based on Fig. 14.1. The top part of the map contains most of the patients with nephropathy, older age, and longer duration of diabetes. The patterns of lipids are more complicated: low concentrations of triglycerides, total cholesterol, and LDL cholesterol consistently characterize the patients with no nephropathy, but greater diversity can be observed in the upper half. In linear analysis, triglycerides and cholesterol would emerge as positive regressors, but it is possible that only a subset of individuals actually show this positive relationship. Furthermore, HDL cholesterol appears to show a completely perpendicular pattern with respect to nephropathy, which could represent an additional independent modulating effect on vascular risk.
Figure 14.2 was created from a single cohort, the nonlinear method can lead to over-interpretation, and further work is needed to validate the observed patterns. Nevertheless, these results highlight the inherent biological complexity that may be missed by traditional approaches. For a practicing clinician, the heterogeneity is a challenge: those patients that have complications also show the greatest lipoprotein diversity. It is also possible that elevated cholesterol in one patient is more dangerous than in another, so additional information on the causal links is of great interest.
Can Dyslipidemia Cause Nephropathy?
In prospective analyses, the picture is similar and conventional lipids are a part of the overall risk profile that is linked to poor glycemic control. In particular, total triglyceride concentration was a predictive marker at different stages of albuminuria in multiple studies: higher values were associated with progression and lower values with regression of albuminuria. Furthermore, dyslipidemia is associated with a faster progression of renal disease [65, 72, 77, 95, 97]. Although it is difficult to ascertain causal links based on the current clinical data, the practical message is clear: if lipids are abnormal, particularly in combination with smoking, hypertension, and obesity, the prognosis is considerably worse.
Atherosclerosis and glomerulosclerosis exhibit similar features [26] and it has been hypothesized that a compensatory increase in hepatic output of circulatory lipids follows the urinary loss of albumin. This in turn initiates a self-perpetuating cycle of glomerular and tubular events that aggravate and maintain progressive decline in kidney function [94]. There is some experimental evidence to support this theory. When guinea pigs and rats were fed cholesterol-rich food in a number of studies, they developed various forms of glomerular and other injuries, and the effects could be modulated by partial or unilateral nephrectomy and hypertension [41, 56, 84]. On the other hand, cholesterol alone may not be sufficient to initiate the disease processes since not all hyperlipidemic animals develop glomerular lesions. Moreover, nondiabetic human individuals with elevated cholesterol or triglycerides rarely develop kidney disease, so it is plausible that hyperglycemia (particularly in type 1 diabetes) and/or hypertension (particularly in type 2 diabetes) are necessary causative partners of hyperlipidemia on the path to diabetic kidney injury.
Lipoprotein Subclasses and Albuminuria in Type 1 Diabetes
Chronic kidney disease per se is associated with multiple lipoprotein abnormalities, but before these direct effects of kidney insufficiency begin, dysfunctions in lipid transfer proteins, lipoprotein formation, and clearance may be present in albuminuric patients. There is also evidence of mechanistic links to lipotoxicity in the nephrons [94], and the epidemiological findings of increased triglycerides and cholesterol in the circulation suggest that lipoproteins provide the fuel for these lipotoxic processes. Lipoprotein particles comprise a heterogeneous group of lipid transport vehicles with diverse tasks and multiple characteristics such as size, density, and composition. In this respect, the conventional lipoprotein lipids are summary measures—more specific measurement techniques may reveal subtle lipoprotein defects that contribute to diabetic microvascular injury.
VLDL Subclasses
In the DCCT/EDIC Study, lipoprotein subclasses were measured by a proton NMR spectroscopic method for 958 patients with type 1 diabetes [48, 79]. The strongest signals for albuminuria were obtained for the VLDL and HDL subclasses, whereas the LDL subclasses were weaker indicators of kidney disease. The total lipid contents in medium and small VLDL subclasses were significantly associated with AER, and the two were the only lipoprotein measures that were significant in women after adjusting for other risk factors. In men, all VLDL subclasses were increased in patients with increased AER, and differences were also observed in other lipoprotein measures. On the other hand, VLDL size was not associated with albuminuria.
Lipoprotein subclasses were measured by NMR in a subset of 325 type 1 diabetic patients from the FinnDiane cohort [69], although the methodology to extract subclass data from the NMR spectra was different from the one used in the DCCT/EDIC. The extra-large and large VLDL subclasses were significantly different between patients without (AER < 300 mg/24 h) or with macroalbuminuria (AER > 300 mg/24 h). The strongest positive correlations with continuous AER were observed for large VLDL cholesterol. Furthermore, the constituent lipids (such as triglycerides and phospholipids) in extra-large and medium VLDL subclasses were significant covariates of AER.
VLDL particles from ultracentrifugation and their relationships with the progression of diabetic nephropathy were investigated by Thomas et al. in a follow-up of 152 patients with type 1 diabetes [107]. No associations (when adjusted for other risk factors) were detected between VLDL measures and progression from normal AER (<20 mg/min at baseline), nor between VLDL and eGFR decline in the macroalbuminuric group (AER > 200 mg/min). On the other hand, VLDL triglycerides predicted progression from microalbuminuria (20 < AER < 200 μg/min at baseline).
IDL and LDL Subclasses
The calculated Friedewald LDL cholesterol, which also includes cholesterol from IDL, was a significant covariate of AER in the DCCT/EDIC Study [48]. At subclass level, the lipid mass within IDL was increased in men with macroalbuminuria, but not in women. Only small LDL was significantly increased, and there was also evidence of gender interaction with AER. Men showed a decrease in LDL size, and both sexes showed an increase in LDL particle concentration in the macroalbuminuric group. Oxidation of LDL was investigated via fluorescence ratio and delta absorbance, but there were no differences between the AER categories. Of note, Lp(a) was also similar between the AER groups.
The Pittsburgh EDC Study Group employed the same NMR method as the DCCT/EDIC to examine 42 matched pairs of progressors and nonprogressors with respect to overt nephropathy (AER > 200 μg/min or serum creatinine > 153 μmol/L or renal failure). Decreased LDL particle size emerged as the most important lipoprotein measure [119], and the results also suggested that lipoprotein lipids are less important during the initial increase in AER, with larger effects in the later stages of albuminuria.
LDL subclass lipids were not significant indicators of albuminuria in the cross-sectional analysis of the subset from the FinnDiane Study [69]. In a prospective analysis, baseline IDL and LDL subclasses were associated with the progression of albuminuria, but not from macroalbuminuria (and impaired eGFR) to end-stage renal disease [70].
Thomas et al. reported that LDL cholesterol, LDL free cholesterol, and LDL mass, measured by ultracentrifugation, predicted the progression from normal AER [107]. Furthermore, IDL triglycerides predicted the progression from microalbuminuria, whereas only decreased LDL size was associated with declining eGFR in the macroalbuminuric group.
Apolipoprotein B
Each lipoprotein particle in the VLDL–IDL–LDL cascade contains a single apolipoprotein B-100 molecule (apoB), and measuring apoB therefore works as a pooled measure of the circulating particle concentrations for these lipoproteins [19]. In the DCCT/EDIC Study, apoB was a significant covariate of AER and creatinine clearance for both sexes [48]. Furthermore, these associations could not be fully explained by confounders or traditional risk factors. Findings in the FinnDiane Study were similar: apoB was increased in microalbuminuric patients, even more in macroalbuminuric patients, and apoB was also associated with progression across the albuminuria categories [109, 110]. A nested case-control approach within the EURODIAB Prospective Complications Study found that in 224 patients with type 1 diabetes, apoB was significantly increased both in the micro- and macroalbuminuric groups [12, 13].
HDL Subclasses
HDL cholesterol is decreased in patients with macroalbuminuria, and the size, function, and composition of HDL particles is altered during the course of diabetic kidney disease. In the DCCT/EDIC, the HDL subfraction was split into large HDL and small. Total lipid content of large HDL particles was decreased in patients with macroalbuminuria, but small HDL was increased in both men and women, which fits to the assumed roles [48]. Furthermore, HDL particle size was inversely correlated with AER.
The HDL subfraction was divided into four subclasses in the FinnDiane sub-study with serum NMR data [69]. Patients with macroalbuminuria had decreased cholesterol and other constituent lipids in large HDL (the second largest subclass), and weaker inverse associations were also detected for medium HDL lipids, esterified cholesterol in the largest HDL, and total lipids in small HDL. In the prospective analysis, depletion of large HDL cholesterol was observed in patients who progressed at shorter duration [70]. Surprisingly, the largest HDL subclass was positively correlated with LDL lipids and elevated in patients at risk for progression from normal AER or microalbuminuria.
The HDL subfraction can also be divided according to buoyancy: the HDL2 subclass represents large buoyant particles, whereas the HDL3 denotes smaller and denser particles. HDL3 cholesterol was investigated by an enzymatic method in the main FinnDiane cohort. In cross-sectional analysis, both HDL2 (estimated as non-HDL3) and HDL3 cholesterol were decreased in patients with macroalbuminuria and in patients with impaired eGFR [109]. In prospective analysis, the pattern was similar when progressors were compared with nonprogressors for each baseline nephropathy category [110]. However, the progressor groups were different with respect to gender and diabetes duration. When traditional risk factors were taken into account, HDL3 cholesterol was positively associated with progression from normal AER to microalbuminuria.
Apolipoproteins A-I and A-II
ApoA-I and apoA-II are major structural components of HDL particles, and their concentrations are correlated with HDL lipids [87]. Kahri et al. compared HDL particles between 52 patients with normal AER, 37 with microalbuminuria (20 < AER < 200 μg/min), and 64 with macroalbuminuria (AER > 200 μg/min). HDL2 cholesterol was higher in patients with normal AER, but no differences were detected with respect to apoA-I or apoA-II, or HDL particles with or without apoA-II [52].
Surprisingly, apoA-I was a borderline positive covariate of albuminuria in men in the DCCT/EDIC, and there was also a positive association with creatinine clearance [48]. Results from the FinnDiane Study were also somewhat unexpected: neither A-I nor A-II showed a clear trend for AER or eGFR in cross-sectional analysis, but increased apoA-II and decreased apoA-I/A-II ratio predicted progression from normal AER in prospective analysis [109, 110]. In the subset of 325 patients from the main FinnDiane cohort, apoA-II was correlated with total cholesterol and serum phosphatidylcholine in a network model and increased in patients with a high risk of incident albuminuria [70].
Lipoprotein Abnormalities in Chronic Kidney Disease and Their Relevance to Diabetic Nephropathy
Loss of kidney function results in multiple systemic effects on metabolism, and lipoproteins are also affected [7, 114]. The most marked changes can be summarized as (1) reduced clearance of apoB-containing lipoproteins and their remnants, (2) accumulation of small and dense and oxidized LDL particles, and (3) impaired maturation of HDL particles. Some of these effects may depend on the renal replacement therapies. For instance, peritoneal dialysis causes plasma albumin loss and is linked to increased LDL and total cholesterol due to increased cholesterol biosynthesis, whereas hemodialysis seems not to have similar adverse effects [6, 18]. Of note, excess apoB-containing lipoproteins have been observed in nephrotic proteinuria, where depletion of plasma albumin is also common [60].
Stay updated, free articles. Join our Telegram channel

Full access? Get Clinical Tree


