- Insulin resistance both precedes and predicts type 2 diabetes mellitus (T2DM). The insulin resistance preceding T2DM is commonly referred to as the metabolic syndrome. Development of T2DM (i.e. overt hyperglycemia), however, also requires the presence of a relative defect in insulin secretion (see Chapter 10).
- Although obesity and physical inactivity have precipitated the epidemic of T2DM, these factors are poorer predictors of cardiovascular disease than a combination of risk factors that define the metabolic syndrome. Diagnosis of the metabolic syndrome requires measurement of waist circumference, glucose, triglycerides and high density lipoprotein cholesterol and blood pressure. These features are not observed in all obese people and can occur even in normal weight individuals. Subjects who develop the metabolic syndrome commonly have excess fat deposited in ectopic locations, especially in the liver. Non-alcoholic fatty liver disease (NAFLD) is defined as excess fat in the liver in the absence of excess alcohol abuse or other known causes of liver disease. The amount of fat in the liver is closely correlated with all features of the metabolic syndrome independent of obesity. Thus, NAFLD frequently coexists in subjects with the metabolic syndrome and may indeed be regarded as another defining feature of the metabolic syndrome. As the metabolic syndrome, NAFLD also predicts both T2DM and cardiovascular disease independent of obesity.
- In the liver, insulin resistance of glucose metabolism in patients with T2DM is characterized by an impaired ability of insulin to inhibit hepatic glucose production leading to mild hyperglycemia and stimulation of insulin secretion. Hepatic insulin resistance is also manifested by failure of insulin suppression of very low density lipoprotein production, which leads to hypertriglyceridemia. High density lipoprotein levels decrease because of increased exchange of cholesterol esters for triglyceride, mediated by cholesterol ester transfer protein. Small, dense, low density lipoprotein particles also predominate in insulin-resistant states, and are highly atherogenic. Hepatic insulin resistance is directly proportional to the amount of fat in the liver, although the molecular mechanisms underlying this association in humans are unclear. Liver fat is increased in obesity but the relationship is weak, implying that many other factors regulate liver fat. These include genetic and dietary factors.
- Insulin resistance in adipose tissue is characterized by inflammation, decreased production of the insulin-sensitizing hormone adiponectin and by an impaired ability of insulin to suppress lipolysis. Raised non-esterified fatty acid (NEFA) levels are the most important source of intrahepatocellular triglyceride both under fasting and post-prandial conditions. Adiponectin deficiency may also contribute to fat accumulation in the liver.
- Insulin stimulation of glucose uptake in skeletal muscle is decreased in patients with T2DM compared with subjects without diabetes if measured under similar conditions of hyperinsulinemia and glycemia. At the molecular level, insulin resistance in muscle is associated with by defects at multiple post-receptor sites, including impairment of insulin receptor substrate 1 tyrosine phosphorylation, phosphoinositide 3′ (PI3) kinase activation and the glucose transporter 4 translocation, which mediates insulin-stimulated glucose uptake; glycogen synthesis is also decreased. Raised NEFA levels also interfere with glucose utilization and uptake by muscle.
- Chronic hyperglycemia per se reduces insulin sensitivity (glucose toxicity) and could at least partly explain why insulin resistance is more severe in patients with established T2DM than in equally obese subjects without diabetes.
Insulin resistance – definitions and role in the natural history of type 2 diabetes
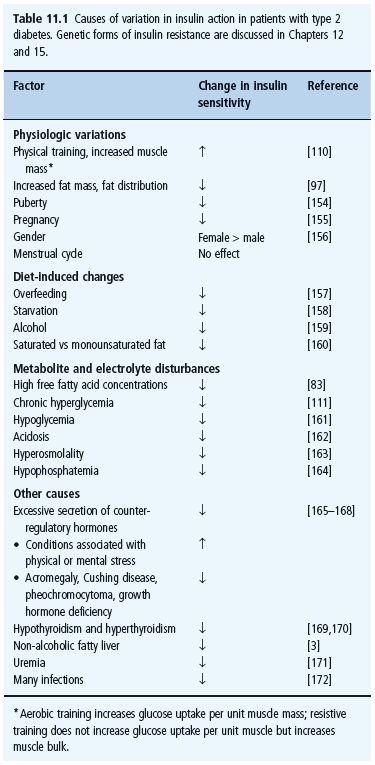
Insulin resistance can be defined as the inability of insulin to produce its usual biologic actions at circulating concentrations that are effective in normal subjects. Insulin resistance in the context of glucose metabolism leads to impaired suppression of endogenous glucose production – under basal conditions as well as after eating (when the physiologic rise in insulin in response to glucose entry from the gut normally shuts down glucose production by the liver) – and to reduced peripheral uptake of glucose. Resistance to the ability of insulin to suppress very low density lipoprotein (VLDL) cholesterol production increases circulating serum triglycerides, while resistance in adipose tissue increases the flux of non-esterified fatty acid (NEFA) both to the liver and skeletal muscle and impairs the action of insulin on glucose metabolism in these tissues (see Chapters 7 and 13). Resistance to other actions of insulin, such as its vasodilatator and antiplatelet aggregation effects, also characterize insulin resistance in patients with T2DM. Insulin resistance may also become more severe in patients with T2DM brought about by any factor causing insulin resistance. Such factors are listed in Table 11.1.
Table 11.1 Causes of variation in insulin action in patients with type 2 diabetes. Genetic forms of insulin resistance are discussed in Chapters 12 and 15.
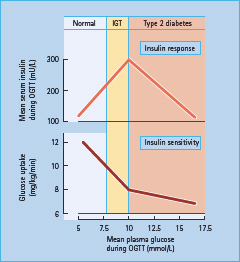
There has been much debate as to whether insulin resistance is the primary defect that precedes β-cell failure in the evolution of hyperglycemia in T2DM, or vice versa. There is a linear decrease in both first-phase insulin release and insulin sensitivity in individuals who progress from normal to impaired glucose tolerance [1]. Once the plasma glucose concentration 2 hours after an oral glucose challenge (75 g) reaches the upper limit for impaired glucose tolerance (11.1 mmol/L, 200mg/dL), post-glucose insulin concentrations fall and glucose then rises into the diabetic range (Figure 11.1). A similar picture has been observed in prospective studies. Thus, low insulin sensitivity and impaired first-phase insulin release both predict the onset of T2DM [1]. These data imply that development of overt hyperglycemia requires a relative decrease in insulin secretion as depicted in Figure 11.1.
Figure 11.1 Natural history of type 2 diabetes (T2DM). Upper panel: the relationship between mean glucose and mean insulin concentrations during an oral glucose tolerance test (OGTT), in individuals with normal (NGT), impaired glucose tolerance (IGT) and diabetes (T2DM). There is a linear positive correlation between glucose and insulin concentrations during an OGTT in individuals with NGT and IGT. By contrast, T2DM is characterized by worsening relative insulin defi ciency (i.e. insulin concentrations decline with rising glucose concentrations). Bottom panel: the relationship between glucose concentrations during the OGTT and insulin sensitivity (determined by the euglycemic clamp technique). Insulin sensitivity decreases linearly as glucose tolerance worsens and, in patients with T2DM, insulin sensitivity worsens as glucose concentrations increase. This could be caused by effects of chronic hyperglycemia per se on glucose uptake, or of relative insulin defi ciency coupled with increases in NEFA concentrations. These data are from cross – sectional studies [173] but longitudinal studies [1] yield similar fi ndings.
The following sections describe the pathogenesis and significance of the cluster of clinical features of insulin resistance called the metabolic syndrome, which characterizes most patients with the common form of T2DM [2]. The metabolic syndrome shares many features in common with non-alcoholic fatty liver disease (NAFLD), which is therefore also briefly described [3]. This is followed by a characterization of features of insulin resistance in individual tissues: the liver, adipose tissue, skeletal muscle and additional sites. The underlying causes are also discussed, focusing on acquired factors. Genetics of T2DM is discussed in Chapter 12. This chapter focuses on the sites, causes and consequences of “insulin resistance” in the common form of T2DM. Certain conditions that may resemble T2DM are discussed in detail in other chapters (see Chapters 2, 15, and 19).
Metabolic syndrome and non-alcoholic fatty liver disease
Definitions and significance
Metabolic syndrome
Insulin resistance in various tissues leads to hyperglycemia, hypertriglyceridemia and low high-density liporotein (HDL) cholesterol. Most patients with T2DM have these features of insulin resistance and, in addition, are often hypertensive and abdominally obese. Although each of the causes and consequences of insulin resistance predicts both T2DM and increased cardiovascular risk, identification of a cluster of abnormalities in a given individual confers a substantial additional cardiovascular risk over and above the risk associated with each individual abnormality [2]. A number of expert groups have developed criteria for identification of such a risk cluster called the metabolic syndrome. The most recent is the definition proposed by the International Diabetes Federation (IDF). According to this definition, a person is identified as having the metabolic syndrome if they have central obesity (defined with ethnicity specific values) plus any two of the following: raised triglycerides; reduced HDL cholesterol; raised blood pressure; or raised fasting plasma glucose (Tables 11.2 and 11.3). Using these criteria, 20–25% of the world’s adult population have the metabolic syndrome. This risk of death from cardiovascular disease is increased approximately twofold in subjects with the metabolic syndrome compared with those not meeting these criteria (see Part 8). In addition, subjects with the metabolic syndrome have a fivefold greater risk of developing T2DM [2].
Non-alcoholic fatty liver disease
Subjects with metabolic syndrome who are abdominally obese, have an increase in fat accumulation in the liver and hepatic insulin resistance independent of their obesity and body fat distribution [4,5]. This increase in liver fat associated with insulin resistance is called non-alcoholic fatty liver disease (NAFLD). NAFLD is defined as excess fat in the liver (>5–10% fat histologically) which is not brought about by excess alcohol use (over 20 g/day), effects of other toxins, autoimmune, viral or other causes of steatosis [4]. NAFLD has been shown to predict both T2DM and cardiovascular disease in multiple prospective studies independent of obesity [3].
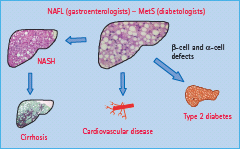
NAFLD covers a spectrum of liver disease including not only steatosis but also non-alcoholic steatohepatitis (NASH) and cirrhosis (Figure 11.2) [4]. The reasons why the liver develops inflammatory changes, as in NASH, in some individuals is unclear. In addition to the epidemic of obesity, T2DM and cardiovascular disease, the incidence of serious liver damage brought about by NAFLD is increasing. It has even been predicted that NASH will become the number one cause of orthotopic liver transplantation by the year 2020 [6].
Figure 11.2 Overview of the relationship between non-alcoholic fatty liver (NAFL), metabolic syndrome (MetS), non-alcoholic steatohepatitis (NASH), type 2 diabetes and cardiovascular disease.
Insulin resistance in the liver
Characteristics
Insulin action on glucose metabolism in the fasting state
After an overnight fast, insulin restrains endogenous glucose production (see Chapter 7). Isotopic measurements of glucose production under truly steady-state conditions show a significant relationship between endogenous glucose production and fasting plasma glucose concentration in patients with T2DM [7]. This relationship is observed despite hyperglycemia and normoinsulinemia or hyperinsulinemia, and demonstrates that insulin resistance contributes to the increase in basal endogenous glucose production. This hepatic insulin resistance is associated with excess fat accumulation in the liver. After an overnight fast, when glucose uptake is largely insulin-independent and driven by the mass-action effect of hyperglycemia, the absolute rate of glucose utilization is normal or even increased (Figure 11.3). The clinical implications of these findings are that strategies designed to lower fasting glucose should aim at inhibiting overproduction of glucose from the liver rather than further increasing glucose uptake in T2DM [8].
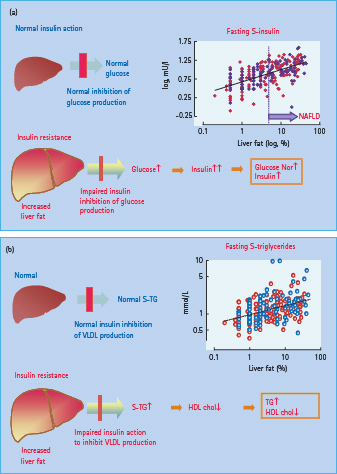
Figure 11.3 Role of the fatty liver in the pathogenesis of hyperglycemia and (a) hyperinsulinemia and (b) hypertriglyceridemia. (a) Insulin normally restrains hepatic glucose production, which maintains glucose at normal levels. Once the liver is fatty and insulin-resistant, this action of insulin is impaired, leading to hyperglycemia and stimulation of insulin secretion. This results in the combination of near-normal glucose levels and hyperinsulinemia, as long as panreatic insulin secretion is intact. The insert in (a) denotes the relationship between liver fat and fasting serum insulin. Pink circles, female; blue circles, male. Data from Kotronen et al. [5]. If liver fat exceeds 5–10% as a result of non-alcoholic causes, this is defined as non-alcoholic fatty liver disease (NAFLD). (b) Insulin normally inhibits production of very low density lipoprotein (VLDL) cholesterol from the liver. If the liver is fatty and and insulin resistant, this ability of insulin is impaired. This results in hypertriglyceridemia and this in turn is the main reason for lowering of high density lipoprotein (HDL) cholesterol. The insert in (b) depicts the relationship between liver fat and fasting serum triglycerides. Pink circles, female; blue circles, male. Data from Kotronen et al. [5].
Insulin action on glucose metabolism in the post-prandial state
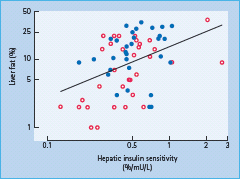
After a meal, increases in insulin and glucose concentrations and a concomitant decrease in glucagon almost completely suppress endogenous glucose production under normal conditions. In patients with T2DM, this suppression is incomplete both because of hepatic insulin resistance, deficient insulin and excessive glucagon secretion [9–11]. Hepatic insulin resistance has been documented by direct measurement of a reduced effect of insulin to decrease hepatic glucose production [11]. This defect correlates closely with liver fat content (Figure 11.4) [12,13]. The pathogenesis and causes of this hepatic insulin resistance are discussed below. Persistent hepatic glucose production after eating is the main reason for sustained maintenance of post-meal hyperglycemia [9]. Under post-prandial conditions, approximately one-third of glucose is utilized in skeletal muscle, one-third is oxidized in the brain and the remaining third is stored in the liver [14]. In patients with T2DM, the ability of the liver to store glucose during a meal appears intact or is only slightly diminished [9,15]. In absolute terms, the overall rate of glucose utilization is also quantitatively normal, because hyperglycemia per se, via the mass action effect of glucose, acts to compensate for impaired insulin stimulation of glucose uptake into peripheral tissues [16]. Finally, the brain utilizes similar amounts of glucose in both normal subjects and patients with T2DM. Thus, post-prandial hyperglycemia must be caused by the incomplete suppression of endogenous glucose production.
Figure 11.4 Relationship between hepatic insulin sensitivity (measured by the ability of insulin to suppress hepatic glucose production by insulin) and liver fat in normal subjects (open circles) and in patients with type 2 diabetes (closed circles). Data from Kotronen et al. [174].
Lipoprotein metabolism
Evidence from both in vitro [17,18] and in vivo [19] studies has suggested that insulin normally suppresses the production of VLDL, especially VLDL1 apoB particles from the liver (see Chapter 40). This effect is brought about not only by decreases in NEFA availability following inhibition of lipolysis in fat tissue, but also by a direct hepatic effect of insulin, inhibiting the assembly and production of VLDL particles [19]. In contrast to normal subjects, insulin fails to suppress VLDL apoB production in those with T2DM, even though it profoundly suppresses NEFA concentrations [20]. Overproduction of VLDL [21] and the defect in insulin suppression of VLDL production [22] correlates with the amount of fat in the liver and appears to be one major contributory mechanism underlying the increase in serum triglycerides in patients with insulin-resistant T2DM (Figure 11.3) [23].
HDL levels are reduced in insulin-resistant patients with high serum triglycerides. Under hypertriglyceridemic conditions, there is excessive exchange of cholesterol esters and triglycerides between HDL and the expanded pool of triglyceride-rich lipoproteins, mediated by cholesterol ester transfer protein (CETP) [24]. HDL particles become enriched with triglycerides (predominantly separating in the lighter HDL3 density range), rendering them as a good substrate for hepatic lipase which removes HDL particles form the circulation at an accelerated rate. Subnormal activity of LPL may further decrease levels of HDL cholesterol by decreasing the conversion of HDL3 to HDL2 particles [24]. Elevated concentrations of VLDL particles in the serum of patients with T2DM also increase the CETP-mediated exchange of cholesterol ester and triglyceride between VLDL and low density lipoprotein (LDL) cholesterol particles [25]. This increases the triglyceride content of LDL particles and makes them a better substrate for hepatic lipase [26], which hydrolyzes triglycerides in the LDL particles and increases their density. This sequence of events at least partly explains why patients with T2DM have smaller and more dense LDL particles than individuals without diabetes [27,28]. The small dense LDL particles are known to be highly atherogenic and provide a plausible link between insulin resistance and cardiovascular disease [29–32].
Pathogenesis of hepatic insulin resistance and the fatty liver
It is not ethically possible to sample human liver for research purposes, and therefore data on the pathogenesis of hepatic insulin resistance in humans are mainly based on in vivo studies using stable isotope and hepatic venous catheterization techniques.
Sources of intrahepatocellular triglyceride
The fatty acids in intrahepatocellular triglycerides can be derived from dietary chylomicron remnants, NEFAs released from adipose tissue, or from post-prandial lipolysis of chylomicrons, which can occur at a rate in excess of what can be taken up by tissues (spillover), and from de novo lipogenesis [33]. In vivo studies using stable isotope techniques have shown that after an overnight fast, the majority of hepatic fatty acids originate from adipose tissue lipolysis [34]. The contribution of splanchnic lipolysis to hepatic free fatty acid (FFA) delivery averages 5–10% in normal weight subjects and increases to 30% in men and women with visceral obesity [35]. Thus, subcutaneous adipose tissue provides the majority of hepatic FFA delivery. In the post-prandial state, the contribution of the spillover pathway and uptake of chylomicron remnants increase and can account for up to half of the fatty acids secreted as VLDL triglyceride. De novo lipogenesis accounts for less than 5% in normal subjects post-prandially [36]; however, in subjects with fatty liver, rates of de novo lipogenesis appear to be significantly elevated [34,37]. This may result from excess carbohydrate intake [38]. An impaired ability of insulin-resistant subjects to store carbohydrate as glycogen in muscle could also contribute to excess de novo lipogenesis in the liver [39].
The fatty acid composition of intrahepatocellular triglyceride changes as a function of the amount of liver fat present. The fatty liver contains increased amounts of saturated fatty acids and decreased amounts of polyunsaturated fatty acids [40]. Whether the increase in saturated fatty acids is caused by de novo lipogenesis, which produces saturated fatty acids [41], or other sources is unclear.
Cellular mechanism of hepatic insulin resistance
Triglycerides themselves are inert and cannot explain hepatic insulin resistance. Data from animal studies suggest at least two lipid mediators, ceramides and diacylglycerols, which could cause insulin resistance. Ceramides are sphingolipids, with a sphingoid backbone that relies on the availability of saturated fatty acids [42]. Ceramides appear to be required for insulin resistance induced by saturated, but not unsaturated, fatty acids in rat soleus muscle [43]. Ceramides accumulate in the liver during tristearin (18:0) – but not triolein (18:1 n-9) enriched diets [44]. Ceramides are upregulated in skeletal muscle [45] and adipose tissue [46] of insulin-resistant subjects, but data are sparse on the ceramide content of human fatty liver [40]. Diacylglycerols, which are immediate precursors of triacylglycerols, activate protein kinase Cε (PKCε) in the liver, which binds to and inactivates the insulin receptor tyrosine kinase and decreases insulin receptor substrate 2 (IRS-2) tyrosine phosphorylation. In downstream signaling, this leads to reduced insulin activation of PI3-kinase, AKT2, glygogen synthase kinase 3 (GSK-3) and FOXO phosphorylation, which decreases hepatic glycogen synthesis and reduces inhibition of hepatic gluconeogenesis [47]. In the human liver, diacylglycerol concentrations are increased in proportion to increases in intrahepatocellular triglyceride [40]. PKCε activity has been shown to be increased in the liver of patients with T2DM [48].
Acquired causes of variation in hepatic insulin sensitivity and liver fat content
Body weight
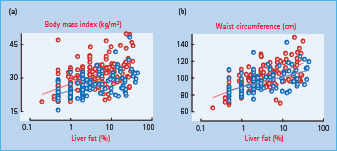
Obesity is related to insulin resistance, although at any given body mass index (BMI), insulin sensitivity, measured as the amount of glucose required to maintain normoglycemia during hyperinsulinemia (a measure of whole body insulin resistance, which could be both hepatic and peripheral), varies considerably (Figure 11.5). Obesity impairs both insulin stimulation of glucose uptake and insulin inhibition of endogenous glucose production [11,49]. Liver fat content and hepatic insulin resistance are related to BMI and waist circumference; however, the variation at any given BMI is large (Figure 11.6).
Figure 11.5 The relationship between body mass index and insulin sensitivity of glucose metabolism as determined by the euglycemic clamp technique in subjects without diabetes. Data from the European Group for the Study of Insulin Resistance (EGIR) (kindly provided by Professor Eleuterio Ferrannini).
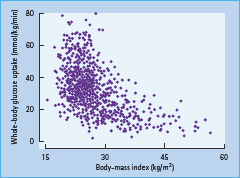
Figure 11.6 The relationship between liver fat and body mass index (a), and liver fat and waist circumference (b) in 271 non-diabetic subjects (red circles denote women and blue circles men). Data from Kotronen et al. [5].
Weight loss induces rapid and substantial changes in liver fat content and hepatic insulin sensitivity [50,51]. In a study where obese women lost 8% of their body weight over 18 weeks, liver fat content and total body fat mass decreased by 39% and 14%, respectively [52]. In another study, 7% weight loss decreased liver fat content by approximately 40% over 7 weeks [53]. In this study, a 30% decrease in liver fat was observed as early as after 2 days of a low carbohydrate diet (~1000 kcal, approximately 10% carbohydrate). In both of these studies, there was a marked improvement in directly measured hepatic insulin sensitivity [52,53]. Weight gain increases liver fat. In an overfeeding study of healthy volunteers, 9.5% weight gain over 4 weeks was associated with a 2.5-fold increase in liver fat content, hyperinsulinemia and a 4.4-fold increase in serum alanine aminotransferase (ALT) activity [54].
Fat distribution
Over 50 years ago, Vague [55] classified obese subjects according to the degree of “masculine differentiation” into those with “gynoid” and those with “android” obesity. Gynoid obesity was characterized by lower body deposition of fat (around the thighs and buttocks) and relative underdevelopment of the musculature, while android obesity defined upper body (truncal) adiposity, greater overall muscular development and a tendency to develop hypertension, diabetes, atherosclerosis and gout. These phenotypic observations have subsequently been confirmed in prospective studies [56–58].
The mechanisms linking upper body obesity to features of insulin resistance are poorly understood. Regarding hepatic insulin resistance and liver fat, it has been suggested that truncal obesity is harmful because it is accompanied by visceral fat accumulation within the abdomen, and because this fat depot is more metabolically active than subcutaneous adipose tissue. Omental and mesenteric adipocytes have a higher rate of lipolysis than subcutaneous, and could liberate excessive amounts of NEFA into the portal vein, thus causing the liver to become insulin resistant. This “portal theory”, however, lacks firm supporting evidence from in vivo studies [59]. Limited data suggest that concentrations of NEFA and glycerol in the portal vein are close to those in arterial plasma, and tracer studies have shown that NEFA released within the splanchnic (visceral) bed contribute only about 10% of total NEFA delivery to the liver [60]. Furthermore, although the turnover rate of NEFA is higher in women with upper, compared to those with lower body obesity, the excess NEFA have been found to originate from subcutaneous fat in the upper body rather than from the splanchnic bed [61]. Visceral fat also has been proposed to release more inflammatory cytokines such as interleukin 6 (IL-6) than subcutaneous adipose tissue, but such data do not prove cause and effect [62,63]. Thus, visceral fat could be an innocent bystander as well as a culprit [59].
Diet composition
Very few human data are available regarding the effects of changes in diet composition on hepatic insulin sensitivity and liver fat content. Cross-sectional data have suggested that the relative amount of fat, especially saturated fat in the diet, is directly correlated with liver fat [52,64] and that the percentage of dietary saturated fat intake is increased in NAFLD compared with controls [65]. A small intervention study suggested that a high fat (56% of kcal) low carbohydrate diet may increase liver fat compared to a low fat (16% of kcal) high carbohydrate diet [66]. The dietary carbohydrate content, however, may also be important. A cross-sectional study in 247 healthy subjects showed that a high glycemic index diet is associated with high liver fat independent of carbohydrate, fiber, protein and fat intake [67], but there are no intervention studies to confirm this finding.
Genetic causes regulating liver fat and hepatic insulin sensitivity
Twin studies suggest that 35–60% of the variation in the levels of circulating liver enzymes in serum of subjects not using excess alcohol and who have no known liver disease is genetically determined [68,69]. Recently, a genome-wide association scan of non-synonymous sequence variations in a population comprising Hispanic, African-American and European-American individuals identified an allele in the PNPLA3 (adiponutrin) gene to be strongly associated with increased liver fat [70]. The finding that hepatic fat content is more than twofold higher in PNPLA3 rs738409[G] homozygotes than in non-carriers has been confirmed in multiple studies [70,71]. The missense mutation I148M in adiponectin promotes triglyceride accumulation by inhibiting triglyceride hydrolysis [72].
Insulin resistance in adipose tissue
Adipose tissue is not merely a depot for excess energy but an active endocrine organ, which releases hormones such as adiponectin and leptin to the circulation (see Chapter 8). In addition, it has recently been shown that in obese subjects [73] and in subjects with a fatty liver independent of obesity [46], adipose tissue is inflamed. This inflammation is characterized by macrophage infiltration and increased expression of proinflammatory molecules such as tumor necrosis factor α (TNF-α) and IL-6, and of chemokines such as MCP-1 [73–76]. The initial trigger of the inflammatory changes is unknown.
Cinti et al. [77] showed that in both obese (db/db) mice and humans >90% of the macrophages surround dead adipocytes, and the number of macrophages correlated positively with adipocyte size [73,77]. An increased number of macrophages surrounding dead adipocytes also characterized subjects with a fatty liver compared to equally obese subjects with normal liver fat content [46]. The inflammation in adipose tissue may cause insulin resistance, not only in adipose tissue, but possibly also in other tissues such as the liver. Although it is in general difficult to prove cause and effect in human studies, it is likely that increases in NEFA from the insulin resistance of antilipolysis and the decrease in the concentration of adiponectin are likely mediators of systemic, mainly hepatic, insulin resistance as a consequence of changes occurring in adipose tissue. Macrophage accumulation in human adipose tissue is at least in part reversible as weight loss can reduce both macrophage infiltration and expression of genes involved in macrophage recruitment [78].
Resistance to the antilipolytic action of insulin
Lipolysis in adipose tissue is exquisitely insulin sensitive: in normal subjects, rates of glycerol production are half-maximally suppressed at a plasma insulin concentration of 13 mU/L [79,80]. Triglyceride breakdown is increased and plasma NEFA concentrations are higher in patients with T2DM than in normal subjects studied at comparable insulin levels, suggesting that adipose tissue is also affected by insulin resistance [81,82]. Unrestrained lipolysis to a degree that could lead to ketoacidosis, however, does not occur spontaneously in T2DM, because insulin deficiency is not sufficiently profound.
Increased NEFA concentrations may contribute to worsening of hyperglycemia because of multiple interactions between NEFA and glucose metabolism. A large increase in plasma NEFA concentrations can decrease insulin-stimulated glucose uptake [83] and NEFA may be deposited as triglycerides in skeletal muscle [84,85]. Second, the increased concentration of NEFA reflects increased NEFA turnover, which increases delivery to the liver, where NEFA can be deposited as triglycerides. In the liver, NEFA also stimulate glucose production, especially via gluconeogenesis. The biochemical mechanisms through which NEFA might interfere with insulin action are discussed in Chapter 13.
Adiponectin deficiency
Adiponectin is a hormone produced in adipose tissue. Based on animal studies, its main target is the liver, where it has both anti-inflammatory and insulin-sensitizing effects and decreases liver fat content [86]. The marked increase in serum adiponectin observed during treatment with peroxisome proliferator-activated receptor γ (PPAR-γ) agonists and the close correlation between changes in liver fat and serum adiponectin concentrations [87] support the possibility that adiponectin regulates liver fat content in humans. Serum adiponectin levels are decreased in obese compared to non-obese subjects and in subjects with the metabolic syndrome compared to those without the syndrome.
Insulin resistance in skeletal muscle
There is abundant evidence that the ability of insulin to stimulate in vivo glucose disposal is decreased in skeletal muscle of patients with T2DM when measured under similar conditions in age, gender and weight-matched subjects without diabetes [88–90]. Under real-life conditions, however, hyperglycemia compensates for the defect in insulin-stimulated glucose uptake, and maintains the rate of absolute glucose utilization at a normal level in patients with T2DM compared with subjects without diabetes [16].
Mechanisms of insulin resistance in muscle
Multiple defects in the insulin signaling cascade have been identified. There do not appear to be any major disturbances in insulin-receptor binding, and the minor decreases in the tyrosine kinase activity of the receptor β-subunit appear to be secondary to the metabolic disturbances, because they are reversible with weight loss [91].
The abnormality must therefore lie at a post-receptor level. Defects in insulin signaling in human skeletal muscle have been demonstrated in early signaling events such as activation by tyrosine phosphorylation of IRS-1 – a substrate of the insulin receptor’s tyrosine kinase – and in the activation of PI3 kinase [92], which is required for insulin’s stimulation of glucose transport and glycogen synthesis (see Chapter 7). Insulin-enhanced glucose uptake, mediated by translocation of the glucose transporter 4 (GLUT-4) protein to the cell surface, and stimulation of glucose phosphorylation via hexokinase II are also diminished [93,94].
The defects in insulin action in skeletal muscle are generally more severe than in equally obese, non-diabetic subjects of the same age, gender and body fat distribution. This suggests that there is an additional genetic defect (see Chapter 12) or that metabolic disturbances such as chronic hyperglycemia (glucose toxicity), or extracellular NEFA or lipid accumulation within the myocytes (lipotoxicity) could be responsible. Indeed, intramyocellular lipid content is higher in patients with T2DM than in equally obese non-diabetic subjects [95] or in lean subjects without diabetes [96].
Causes of insulin resistance in muscle
Obesity
Obesity decreases insulin-stimulated glucose uptake in skeletal muscle independently of changes in physical fitness (see Chapter 14). This decrease could be partly caused by increased NEFA produced by adipose tissue and fat accumulation in myocytes [84,85].
Abdominal obesity
Insulin resistance in skeletal muscle is more severe in subjects with android than those with gynoid obesity [97]. Histologically, abdominally obese subjects have a decreased capillary density and an insulin-resistant fiber type in their skeletal muscles [98,99].
Physical inactivity
The sedentary lifestyle that characterizes Westernized societies is an important contributor to obesity and to T2DM (see Chapters 4 and 23). Data from several prospective epidemiologic studies such the Nurse’s Health Study [100] have shown an inverse association between physical activity and the incidence of T2DM [101–103].
Insulin sensitivity of glucose uptake by skeletal muscle is directly proportional to physical fitness measured by maximal oxygen consumption ( ) [104]. Decreased physical fitness (maximal aerobic power) in muscle in patients with T2DM is characterized by decreased capillary density and impaired mitochondrial oxidative phosphorylation [105]. Glucose tolerance and insulin-stimulated glucose uptake are also enhanced by resistive training, which increases total muscle mass without influencing glucose uptake per unit muscle mass [104].
Insulin and exercise stimulate glucose uptake through independent mechanisms. While insulin enhances glucose uptake in skeletal muscle via the classic insulin signaling pathway (see Chapter 7), exercise has no effect on tyrosine phosphorylation of the insulin receptor or of IRS-1 [106]. The mechanism of contraction-stimulated glucose uptake involves adenosine 5′ monophosphate-activated protein kinase (AMPK) [107]. AMPK, especially its α2 isoform, is activated by muscle contraction in human skeletal muscle, and this results in GLUT-4 translocation to the cell membrane and an increase in inward glucose transport [107].
In insulin-resistant patients with T2DM, the ability of insulin to stimulate tyrosine phosphorylation of the insulin receptor and of IRS-1, IRS-1 associated PI3 kinase activity [92] and translocation of GLUT-4 [108] are all subnormal. Aerobic training, however, has been shown to increase the GLUT-4 content in skeletal muscle [109] and the expression and activity of glycogen synthase [110] to a comparable degree to normal subjects. Thus, the signaling pathways through which exercise enhances glucose uptake may be intact in patients with T2DM. This has the practical implication that the glycemic response to exercise is not blunted by insulin resistance.
Chronic hyperglycemia
Hyperglycemia itself, independent of insulin, NEFA or counter-regulatory hormones, can induce insulin resistance in human skeletal muscle [111]. This “glucose toxicity” induced insulin resistance could contribute to the lower rates of insulin-stimulated glucose uptake in patients with T2DM compared with weight, age and gender-matched subjects without diabetes and measured during maintenance of similar levels of glycemia and insulinemia. Although chronic hyperglycemia induces insulin resistance, however, glucose utilization is stimulated acutely via the mass action effects of glucose even in patients with diabetes. This effect explains why hyperglycemic patients with T2DM are able to utilize as much glucose as normal subjects at normoglycemia, in spite of the insulin resistance in the subjects with diabetes [111,112].
The degree of insulin resistance in patients with T2DM is directly proportional to the severity of hyperglycemia [111]. Thus, insulin resistance induced by the hexosamine pathway in hyperglycemic patients with T2DM could be viewed as a compensatory mechanism that protects muscles against excessive uptake of glucose. Consistent with this, in isolated skeletal muscle from patients with T2DM [112], insulin-stimulated glucose transport in muscles of hyperglycemic patients with T2DM was similar to that in normoglycemic subjects but impaired when measured after short-term exposure to normoglycemia. Prolonged exposure to normoglycemia completely normalized the defect in insulin-stimulated glucose transport [112]. Clinically, the ability of hyperglycemia to induce insulin resistance in patients with T2DM may explain why any treatment, such as sulfonylureas, which improves glycemic control may also improve insulin sensitivity even if the primary site of action is not in insulin-sensitive tissues [111].
The hexosamine pathway was discovered in 1991, by Marshall et al. [113], who found that it mediated glucose-induced insulin resistance in primary cultured rat adipocytes. Downregulation of the insulin-responsive glucose transport system was observed to require three components: glucose, insulin and glutamine. Inactivation of the glutamine-requiring enzyme, glutamine: fructose-6-amidotransferase (GFA), the rate-limiting enzyme of the hexosamine pathway, by glutamine analogs, prevented glucose-induced desensitization of glucose transport [113]. GFA catalyzes the interconversion of glutamine and fructose-6-phosphate to form glucosamine-6-phosphate (GlcN-6-P) and glutamate [114]. GFA is expressed in insulin target tissues such as skeletal muscle, where its activity is increased in patients with T2DM [115]. The end-product of the pathway, UDP-N-acetyl-glucosamine (UDP-NAcGln) is attached to the OH-group of threonine and serine residues of proteins (these same residues can also be phosphorylated), which results in O-glycation of proteins. These include multiple proteins involved in glucose-responsive and insulin-dependent transcription and signaling events [114].
Resistance to other actions of insulin
Vascular effects of insulin
At physiologic concentrations and within a physiologic timeframe, insulin decreases the stiffness of large arteries [116]. This effect is blunted in obesity [117]. These data are consistent with epidemiologic data that indicate that insulin resistance and arterial stiffness are independently associated in subjects without diabetes. Patients with T2DM have stiffer arteries than age and weight-matched healthy subjects [118,119].
Another vascular effect of insulin is vasodilatation of peripheral resistance vessels [120], mediated at least in part by enhanced nitric oxide (NO) production by the endothelium [121]. Because this effect requires prolonged or high doses of insulin, its physiologic significance has thus been questioned [120]. In patients with T2DM, defects in insulin action on blood flow have not been observed when tested at insulin concentrations within the physiologic range, but have been observed at grossly supraphysiologic insulin levels (600 mU/L) [120].
Insulin stimulates NO production in endothelial cells [122], and acutely increases endothelium-dependent but not endothelium-independent vasodilatation in normal subjects [121]. Endothelium-dependent vasodilatation is known to be impaired in T2DM and other insulin-resistant states [123,124]. Whether this defect is caused by insulin resistance at the level of endothelial cells [125] or to indirect causes of endothelial dysfunction such as chronic hyperglycemia [126] or dyslipidemia [124] cannot be determined from cross-sectional human data.
Effects of insulin on autonomic nervous tone
Another of the many actions of insulin is its effect on the autonomic nervous system. Insulin can enter the hypothalamus and other parts of the brain, where insulin receptors are expressed at high levels, and it acts centrally to stimulate the sympathetic nervous system. Manifestations include increases in muscle sympathetic nervous activity [127] and in norepinephrine spillover rate (a measure of norepinephrine release from sympathetic nerve endings in the tissues) [128]. Insulin also regulates the autonomic control of heart rate, decreasing vagal tone and increasing sympathetic drive [129]. In insulin-resistant obese subjects, basal sympathetic tone is increased and the subsequent response to insulin blunted [130]. This defect is also observed in non-obese but insulin-resistant subjects [129]. and in patients with T2DM [131]. Enhanced central effects of the associated hyperinsulinemia may contribute.
Insulin resistance, hemostasis and coagulation
Insulin normally inhibits platelet aggregation [132], and this action is blunted both in vitro [132] and in vivo [133] in insulinresistant obese subjects without diabetes and those with T2DM.
Plasminogen activator inhibitor 1 (PAI-1) is an inhibitor of fibrinolysis, and raised plasma levels predict increased risk of a coronary event [134]. Procoagulant changes, such as impaired fibrinolysis and increased levels of PAI-1, and defects in platelet function are frequently associated with insulin resistance, especially in obese patients with T2DM. These abnormalities predispose to atherothrombotic vascular disease (see Part 8).
Effects of insulin on uric acid metabolism
In normal subjects, insulin acutely reduces the renal clearance of both sodium and uric acid [135]. These actions are preserved in insulin-resistant states such as obesity, diabetes and essential hypertension, and so provide a potential mechanistic link for the clustering of hyperinsulinemia with hyperuricemia and hypertension [136,137].
Other effects of insulin
Insulin acutely lowers serum potassium concentrations by stimulating potassium uptake into skeletal muscle and the splanchnic bed [138]. It also attenuates agonist-induced intracellular increases in Ca2+ concentrations in vascular smooth muscle cells [139] and inhibits sodium, potassium and phosphate excretion by the kidney [138]. The hypokalemic antinatriuretic actions of insulin are both preserved in patients with insulin resistance affecting glucose metabolism and essential hypertension [140,141] and in those with T2DM [142].
Relationship of insulin resistance to hypertension
Of the putative components of the “insulin resistance syndrome,” the association between insulin resistance and hypertension is perhaps the most controversial. Hypertension and insulin resistance have been shown to be linked, independently of confounding factors such as obesity [143], but the relationship appears inconsistent [144–146]. Numerous mechanisms have been postulated to explain this association, but it is currently unclear which – if any – are relevant. In insulin-resistant patients with essential hypertension, basal intracellular Ca2+ levels have been shown to be elevated, and the normal ability of insulin to attenuate angiotensin II induced increases in intracellular Ca2+ is blunted in skin fibroblasts [139]. however, there are no data in patients with T2DM. The renal action of insulin to reabsorb sodium is similar in normotensive and hypertensive insulin-resistant subjects and in patients with T2DM [142], which implies that changes in the antinatriuretic effect of insulin cannot explain the increased prevalence of hypertension in insulin-resistant individuals or those with T2DM. The suggestion that insulin sensitivity influences salt sensitivity is controversial [147–151]. Insulin resistance has consistently been found to correlate with high sodium–lithium counter-transport in erythrocyte membranes; this is thought to parallel increased activity of the Na+–H+ pump in the cell membrane of other tissues, which could raise intracellular Na+ and Ca2+ concentrations and enhance vascular smooth muscle contractility. Such defects may contribute to the development of hypertension in both insulin-resistant subjects without diabetes and in patients with T2DM (see Chapter 40).
In theory, an increase in peripheral vascular resistance (which would raise diastolic blood pressure) could also be a consequence of impaired insulin-induced vasodilatation. Such defects, however, have not been documented under physiologic conditions [120]. It is also unclear whether the defects in endothelium-dependent vasorelaxation observed at very high insulin concentrations are specific to insulin or are a consequence of a more generalized defect in endothelial or smooth-muscle function, or of structural changes in arteries secondary to hypertension. Increased systolic blood pressure is, in most hypertensive individuals, a consequence of increased arterial stiffness [152]. Resistance to the normal ability of insulin to decrease stiffness could therefore increase systolic blood pressure [117].
Conclusions
Insulin resistance, even when present in individuals without diabetes, is characterized not only by abnormalities in glucose homeostasis, but also by defects in insulin regulation of lipid and uric acid metabolism, vascular function, hemostasis and coagulation. These consequences of insulin resistance (normal or impaired glucose tolerance, hypertriglyceridemia, a low HDL cholesterol concentration, small LDL size, hypertension, increases in uric acid and PAI-1 concentrations) and fasting hyperinsulinemia were called “ syndrome X” by Reaven.[153] to emphasize that insulin resistance comprises a cluster of abnormalities.
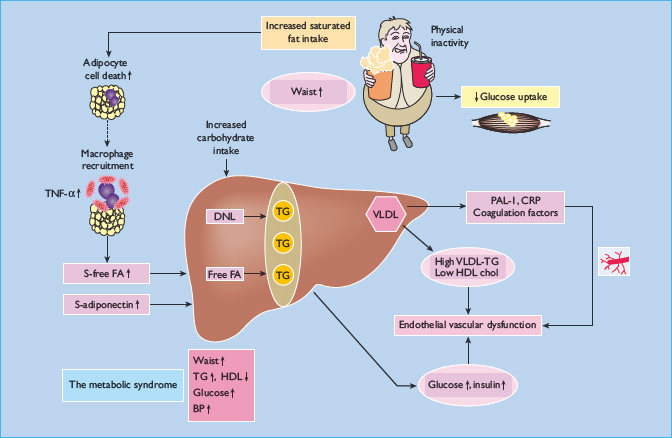
This syndrome, now called the metabolic syndrome (Table 11.2) rather than syndrome X, is important to recognize clinically as it is associated with many components that can potentially be modified to prevent premature atherosclerosis and cardiovascular disease, the main cause of excessive mortality in those with T2DM. Various mechanisms have been proposed to explain how insulin resistance and/or the accompanying hyperinsulinemia could cause these abnormalities. Accumulation of fat in the liver appears to occur in those individuals who develop the metabolic syndrome, independent of obesity. The liver, once fatty, is insulin resistant and overproduces glucose, VLDL, PAI-1, C-reactive protein and coagulation factors, which could all contribute to increased cardiovascular risk (Figure 11.7). The exact causes of why fat accumulates in the liver of some but not others are unknown but appear to involve genetic factors (adiponutrin polymorphism) and acquired factors (use of refined carbohydrates, high saturated fat untake, weight gain). Insulin resistance and inflammation characteize adipose tissue of those who have a fatty liver. In patients with T2DM, insulin resistance is further worsened by chronic hyperglycemia, which itself causes insulin resistance.
Table 11.2 The International Diabetes Federation (IDF) definition of the metabolic syndrome.
| According to the new IDF definition, for a person to be defined as having the metabolic syndrome they must have: |
| Central obesity (defined as waist circumference ≥94 cm for Europid men and ≥80 cm for Europid women, with ethnicity specific values for other groups; see Table 11.3; below) plus any two of the following four factors: |
| 1 Raised triglyceride level: ≥150 mg/dL (1.7 mmol/L), or specific treatment for this lipid abnormality |
| 2 Reduced HDL cholesterol: <40 mg/dL (1.0 mmol/L) in males and <50 mg/dL (1.3 mmol/L) in females, or specific treatment for this lipid abnormality |
| 3 Raised blood pressure: systolic BP ≥ 130 or diastolic BP ≥85 mmHg, or treatment of previously diagnosed hypertension |
| 4 Raised fasting plasma glucose ≥100 mg/dL (5.6 mmol/L), or previously diagnosed type 2 diabetes. If above 5.6 mmol/L (100 mg/dL), an oral glucose tolerance test is strongly recommended but is not necessary to define presence of the syndrome |
| If BMI is >30 kg/m2, central obesity can be assumed and waist circumference does not need to be measured |
Table 11.3 Ethnic specific values for waist circumference.
| Country/ethnic group | Waist circumference (cm) |
| Europids | Male ≥94 |
| In the USA, the ATP III values (102 cm male; 88 cm female) are likely to continue to be used for clinical purposes | Female ≥ 80 |
| South Asians | Male ≥ 90 |
| Based on a Chinese, Malay and Asian-Indian population | Female ≥ 80 |
| Chinese | Male ≥ 90 Female ≥ 80 |
| Japanese | Male ≥ 85 Female ≥ 90 |
| Ethnic South and Central Americans | Use South Asian recommendations until more specific data are available |
| Sub-Saharan Africans and Eastern Mediterranean and Middle East (Arab) populations | Use European data until more specific data are available |
Figure 11.7 Causes and consequences of insulin resistance and pathogenesis of the metabolic syndrome. Overeating and inactivity are common and important causes of obesity. In many obese but also sometimes in non – obese subjects, fat accumulates in the liver. Saturated fat and high refined carbohydrate intake may be particularly harmful. Genetic predisposition also has a role, at least in fat accumulation in the liver. In obese subjects with a fatty liver, adipose tissue is infl amed. This inflammation is characterized by increased expression of cytokines such as tumor necrosis factor α (TNF-α), and increased macrophage infiltration around dead adipocytes. The cause of the inflammation poorly understood. Inflamed adipose tissue is insulin-resistant and overproduces free fatty acids (FFA) which contribute to excess triglyceride storage (TG) in the liver. Adiponectin deficiency also characterizes inflamed adipose tissue and decreases insulin sensitivity. Once fatty the liver overproduces glucose and VLDL as depicted in Figure 11.3, and also other factors such as plasminogen activator 1 (PAI-1) and coagulation factors. Excess refi ned carbohydrate may increase de novo lipogenesis in the liver (DNL), thus increasing intrahepatocellular triglyceride. Overeating and inactivity are also characterized by insulin resistance of glucose uptake by skeletal muscle.
Related posts:

Stay updated, free articles. Join our Telegram channel

Full access? Get Clinical Tree


