Chapter 16 Immunophenotyping
Introduction
This chapter includes descriptions of the following:
Methods for the study of immunological markers
There are several techniques for identifying antigens expressed by leucocytes:
Preparation of the Specimens and Cell Separation
Ficoll-Gradient Method of Separation
Dilute 10 ml of anticoagulated (e.g. heparinized or ethylenediaminetetra-acetic acid, EDTA-anticoagulated) blood with an equal volume of phosphate buffered saline (PBS), pH 7.3 (see p. 622) or Hanks’ solution. Add 10 ml of the diluted blood, drop by drop, to 7.5 ml of Lymphoprep (Nycomed) and then centrifuge for 30 min at 2000 rpm (approx. 500 g). This results in three visible layers: a top layer of plasma; an interphase layer of mononuclear cells; and a layer of red cells and neutrophils at the bottom. After removing the plasma, pipette the mononuclear cell layer into another tube and wash three times with Hanks’ solution or tissue culture medium.
Multicolour Flow Cytometry Methods
At the same time, the introduction of a large number of novel fluorochromes and the application of new McAbs has led to multiparametric immunophenotyping of cells, facilitating the accurate identification of normal and abnormal cell populations. Such advances have led to an increase in the complexity of data obtained and a subsequent increase in the comprehensiveness of the knowledge obtained by the flow cytometrist interpreting such data.1
Detection of membrane antigens
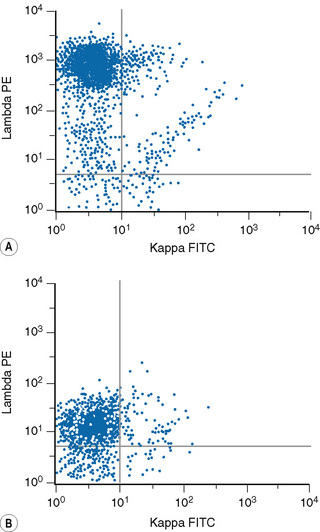
Detection of Surface Immunoglobulin
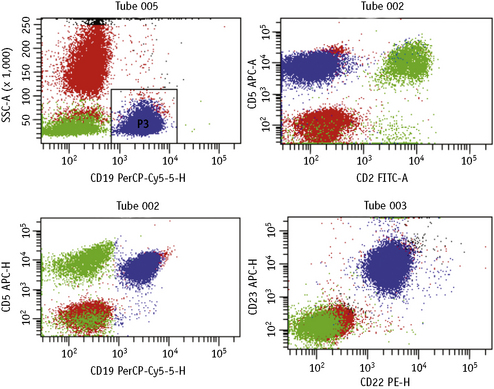
Lymphoproliferative disorders of mature B cells are distinguished from their normal counterparts by the identifications of two main types of phenotypic abnormalities: surface immunoglobulin light chain restriction and aberrant B-cell antigen expression (Fig. 16.2).
Method 1: Wash–Stain–Lyse–Wash
Method 2: Lyse–Stain–Wash
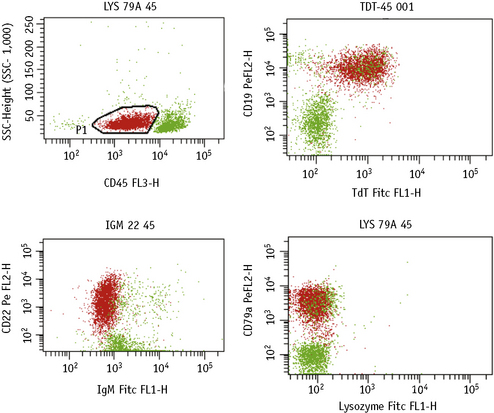
Detection of Intracellular Antigens
There are several commercially available kits containing solutions to fix and permeabilize cells to detect cytoplasmic or nuclear antigens. Overall, these reagents have little or no effect on the light scatter pattern, although their reliability and consistency for detecting particular nuclear and cytoplasmic antigens may vary.2,3
The methods follow the manufacturer’s kit instructions. Details that follow are for the method using Fix and Perm (Invitrogen).4
Simultaneous Detection of Cytoplasmic/Nuclear and Membrane Antigens
Method
Data Analysis Strategies with Multiparametric Flow Cytometry
Until recently, advances made in computing capabilities, and the increased availability in fluorochrome conjugates, had not been matched by the developments in analysis software. However, new independent targeted analysis programmes to deal with these limitations have now been developed, which include novel tactics for the analysis of multiparametric flow cytometry data such as the software developed by the Euroflow consortium.5
Quantification of Antigens
Fluorescence quantification is defined as the measurement of the intensity of staining of cells by flow cytometry to provide an absolute value for the light intensity it measures.6,7
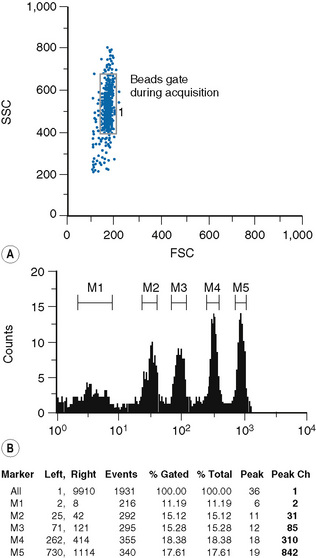
Staining of cells and beads
The type of bead depends on the procedure used for the sample preparation. The beads are commercially available in kits, which usually comprise two tubes. One tube contains four types of beads with four different levels of fluorescence uptake: one very dim, one very bright and two intermediate; the other tube contains blank (non-fluorescent beads) (Fig. 16.4).