Chapter 2 Reference ranges and normal values
A number of factors affect haematological values in apparently healthy individuals. As described in Chapter 1, these include the technique and timing of blood collection, transport and storage of specimens, differences in the subject’s posture when the sample is taken, prior physical activity and whether the subject is confined to bed. Variation in the analytic methods used may also affect the measurements. These can all be standardized.
Haematological values for the normal and abnormal will overlap and a value within the recognized normal range may be definitely pathological in a particular subject. For these reasons the concept of ‘normal values’ and ‘normal ranges’ has been replaced by reference values and the reference range, which is defined by reference limits and obtained from measurements on the reference population for a particular test. The reference range is also termed the reference interval.1,2 Ideally, each laboratory should establish a databank of reference values that take account of the variables mentioned earlier and the test method, so that an individual’s result can be expressed and interpreted relative to a comparable apparently normal population, insofar as normal can be defined.
Recently new haematological parameters such as immature forms of cells, red cell fragments and detection of functional iron deficiency or malarial infection have become available. Currently these parameters are only used for research and, as internal quality control or external quality assessments are not yet available for some of these tests, their use in clinical decision making is not recommended.3
Reference ranges
A reference range for a specified population can be established from measurements on a relatively small number of subjects (discussed later) if they are assumed to be representative of the population as a whole.2 The conditions for obtaining samples from the individuals and the analytic procedures must be standardized, whereas data should be analysed separately for different variables such as individuals who are in bed or ambulant, smokers or non-smokers and so on. One approach is that specimens are collected at about the same time of day, preferably in the morning before breakfast; the last meal should have been eaten not later than 9 p.m. on the previous evening and at that time alcohol should have been restricted to one bottle of beer or an equivalent amount of other alcoholic drink.4 An alternative approach is that, unless a test is usually done on a fasting patient, specimens are collected throughout the day on subjects who are not fasting or resting, as this will produce a reference range that is more relevant to results from patients. It is sometimes appropriate that the reference population is defined as having normal results for specific laboratory tests. For example, if determining a reference range for blood count components it may be necessary, in some populations, to exclude iron deficiency and β thalassaemia heterozygosity.
Statistical procedures
In biological measurements, it is usually assumed that the data will fit a specified type of pattern, either symmetric (Gaussian) or asymmetric with a skewed distribution (non-Gaussian). With a Gaussian distribution, the arithmetic mean (×) can be obtained by dividing the sum of all measurements by the number of observations. The mode is the value that occurs most frequently and the median (m) is the point at which there are an equal number of observations above and below it. In a true Gaussian distribution they should all be the same. The standard deviation (SD) can be calculated as described on p. 625.
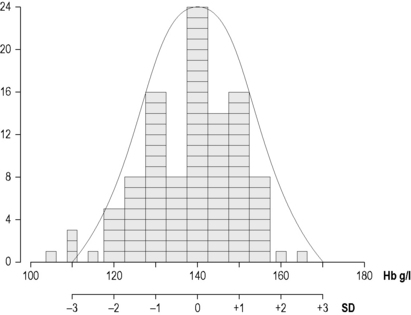
If the data fit a Gaussian distribution, when plotted as a frequency histogram the pattern shown in Figure 2.1z is obtained. Taking the mode and the calculated SD as reference points, a Gaussian curve is superimposed on the histogram. From this curve, practical reference limits can be determined even if the original histogram included outlying results from some subjects not belonging to the normal population. Limits representing the 95% reference range are calculated from arithmetic mean ± 2SD (or more accurately ± 1.96SD).
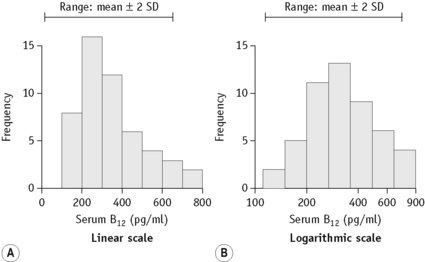
When there is a log normal (skew) distribution of measurements, the range to –2SD may even extend to zero (Fig. 2.2A). To avoid this anomaly, the data should be plotted on semilogarithmic graph paper to obtain a normal distribution histogram (Fig. 2.2B). To calculate the mean and SD the data should be converted to their logarithms. The log-mean value is obtained by adding the logs of all the measurements and dividing by the number of observations. The log SD is calculated by the formula on p. 625 and the results are then converted to their antilogs to express the data in the arithmetic scale. This process is now generally carried out using an appropriate statistical computer program.
Confidence Limits
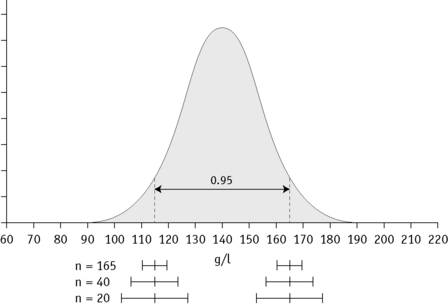
In any of the methods of analysis, a reasonably reliable estimate can be obtained with 40 values, although a larger number (≥120) is preferable (Fig. 2.3).5 When a large set of reference values is unattainable and precise estimation is impossible, a smaller number of values may still serve as a useful clinical guide. Confidence limits define the reliability (e.g. 95% or 99%) of the established reference values when assessing the significance of a test result, especially when it is on the borderline between normal and abnormal. Calculation of confidence limits is described on p. 625. Another important measurement is the coefficient of variation (CV) of the test because a wide CV is likely to influence its clinical utility (see p. 625).
Normal reference values
The data given in Tables 2.1, 2.2 and 2.3 provide general guidance to normal reference values that are applicable to most healthy adults and children, respectively, in industrialized countries. The data have been derived from personal observations as well as various published reports.6–11 However, slightly different ranges may be found in individual laboratories where different analysers and methods are used. The reference interval, which comprises a range of ± 2SD from the mean, indicates the limits that should cover 95% of normal subjects; 99% of normal subjects will be included in a range of ± 3SD. Age and sex differences have been taken into account for some values. Even so, the wide ranges that are shown for some tests reflect the influence of various factors, as described below. Narrower ranges would be expected under standardized conditions. Because modern analysers provide a high level of technical precision, even small differences in successive measurements may be significant. It is thus important to establish and understand the limits of physiological variation for various tests. The blood count data and other test results can then provide sensitive indications of minor abnormalities that may be important in clinical interpretation and health screening.
Table 2.1 Haematological values for normal adults (predominantly from Europe and North America) expressed as a mean ± 2SD (95% range)
| Red blood cell count | |
| Men | 5.0 ± 0.5 × 10¹²/l |
| Women | 4.3 ± 0.5 × 10¹²/l |
| Haemoglobin concentrationa | |
| Men | 150 ± 20 g/l |
| Women | 135 ± 15 g/l |
| Packed cell volume (PCV) or Haematocrit (Hct) | |
| Men | 0.45 ± 0.05 (l/l) |
| Women | 0.41 ± 0.05 (l/l) |
| Mean cell volume (MCV) | |
| Men and women | 92 ± 9 fl |
| Mean cell haemoglobin (MCH) | |
| Men and women | 29.5 ± 2.5 pg |
| Mean cell haemoglobin concentration (MCHC) | |
| Men and women | 330 ± 15 g/l |
| Red cell distribution width (RDW) | |
| As coefficient of variation (CV) | 12.8 ± 1.2% |
| As standard deviation (SD) | 42.5 ± 3.5 fl |
| Red cell diameter (mean values) | |
| Dry films | 6.7–7.7 μm |
| Red cell density | 1092–1100 g/l |
| Reticulocyte count | 50–100 × 109/l (0.5–2.5%) |
| White blood cell count | 4.0–10.0 × 10⁹/l |
| Differential white cell count | |
| Neutrophils | 2.0–7.0 × 10⁹/l (40–80%) |
| Lymphocytes | 1.0–3.0 × 10⁹/l (20–40%) |
| Monocytes | 0.2–1.0 × 10⁹/l (2–10%) |
| Eosinophils | 0.02–0.5 × 10⁹/l (1–6%) |
| Basophils | 0.02–0.1 × 10⁹/l (<1–2%) |
| Lymphocyte subsets (approximations from ranges in published data) | |
| CD3 | 0.6–2.5 × 10⁹/l (60–85%) |
| CD4 | 0.4–1.5 × 10⁹/l (30–50%) |
| CD8 | 0.2–1.1 × 10⁹/l (10–35%) |
| CD4/CD8 ratio | 0.7–3.5 |
| Platelet count | 280 ± 130 × 109/l |
| Bleeding timeb | |
| Ivy’s method | 2–7 min |
| Template method | 2.5–9.5 min |
| Thrombin time | 15–19 s |
| Plasma fibrinogen concentration | 1.8–3.6 g/l |
| Euglobulin clot lysis time | 90–240 min |
| Plasminogen concentrationd | 0.75–1.60 u/ml |
| Antithrombin concentrationd | 0.75–1.25 u/ml |
| Protein C concentrationd | |
| Functional | 0.70–1.40 u/ml |
| Antigen | 0.61–1.32 u/ml |
| Protein S concentrationd | |
| Total antigen | 0.78–1.37 u/ml |
| Free antigen | 0.68–1.52 u/ml |
| Pre-menopausal womenc | 0.55–1.55 u/ml |
| Function | 0.60–1.35 u/ml |
| Pre-menopausal women | 0.55–1.35 u/ml |
| Heparin cofactor II concentrationd | 0.55–1.45 u/ml |
| Median red cell fragility (MCF) (g/l NaCl) | |
| Fresh blood | 4.0–4.45 g/l NaCl |
| After 24 h at 37°C | 4.65–5.9 g/l NaCl |
| Cold agglutinin titre (4°C) | <64 |
| Blood volume (normalized to ‘ideal weight’) | |
| Red cell volume | |
| Men | 30 ± 5 ml/kg |
| Women | 25 ± 5 ml/kg |
| Plasma volume | 45 ± 5 ml/kg |
| Total blood volume | 70 ± 10 ml/kg |
| Red cell lifespan | 120 ± 30 days |
| Serum iron | |
| Men and women | 10–30 μmol/l (0.6–1.7 mg/l) |
| Total iron-binding capacity | 47–70 μmol/l (2.5–4.0 mg/l) |
| Transferrin saturation | 16–50% |
| Serum ferritin concentration | |
| Men | 15–300 μg/l (median 100 μg/l) |
| Women | 15–200 μg/l (median 40 μg/l) |
| Serum vitamin B12 concentration | 180–640 ng/l |
| Serum folate concentration | 3–20 μg/l (6.8–45 nmol/l) |
| Red cell folate concentration | 160–640 μg/l (0.36–1.45 μmol/l) |


