Chapter 20 Laboratory control of anticoagulant, thrombolytic and antiplatelet therapy
Oral anticoagulant treatment using vitamin K antagonists
It has not yet proved possible to produce a therapeutic reduction in thrombotic tendency without increasing the risk of haemorrhage. The purpose of laboratory control is to maintain a level of hypocoagulability that effectively minimizes the combined risks of haemorrhage and thrombosis: the therapeutic range. Individual responses to oral anticoagulant treatment with vitamin K antagonists1 are extremely variable and so must be regularly and frequently controlled by laboratory tests to ensure that the anticoagulant effect remains within the therapeutic range.
Methods Used for the Laboratory Control of Oral Anticoagulant Treatment
Chromogenic substrate assays of factors X, VII or II have been used for the control of anticoagulant treatment and might be necessary when baseline tests are abnormal. Although it is possible to use such a single factor measurement, it must be remembered that the PT measures the effect of three vitamin K-dependent factors (factors VII, X and II) and is also affected by the presence of PIVKAs (proteins induced by vitamin K absence or antagonism), which are the acarboxy forms of vitamin K-dependent factors. It thus gives a better assessment of the situation in vivo: in addition, data on the appropriate individual factor levels corresponding to a given INR are limited.2,3
Standardization of Oral Anticoagulant Treatment
Standardization of oral anticoagulant therapy comprises the following steps:
Reference thromboplastins (rabbit and bovine) are available as World Health Organization (WHO) Reference Preparations via the National Institute for Biological Standards and Control (NIBSC) (www.nibsc.ac.uk), the Institute for Reference Materials and Measurements (IRMM) (Irc-irmm-rm-sales@ec.europa.eu) or certified reference materials from commercial suppliers (see p. 588). All the reference preparations have been calibrated, now sometimes indirectly, against a primary WHO reference of human brain thromboplastin, which was established in 1967.4,5
The following terms are used in the calibration procedure described below:
Calibration of Thromboplastins
Principle
The test thromboplastin should be calibrated against a reference thromboplastin of the same species (rabbit versus rabbit, bovine versus bovine) although reference plasmas from different species must at some stage be compared with each other.3 All reference preparations are calibrated in terms of the primary material of human origin and have an ISI, which is assigned after a collaborative trial involving many laboratories from different countries.
Reagents
Method
Carry out PT tests as described on p. 409. Allow the plasma and thromboplastin to warm up to 37°C for at least 2 min before mixing or adding CaCl2. Test each plasma in duplicate with each of the two thromboplastins in the following order with minimum delay between tests.
| Reference Thromboplastin | Test Thromboplastin | |
|---|---|---|
| Plasma 1 | Test 1 | Test 2 |
| Test 4 | Test 3 | |
| Plasma 2 | Test 5 | Test 6 |
| Test 8 | Test 7, etc. |
Calibration
Plot the PTs on log-log graph paper, with results using the reference preparation (y) on the vertical axis and results with the test thromboplastin (x) on the horizontal axis (Fig. 20.1). On arithmetic paper, it is necessary to plot the logarithms of the PTs (Fig. 20.2). The relationship between the two thromboplastins is determined by the slope of the line (b).
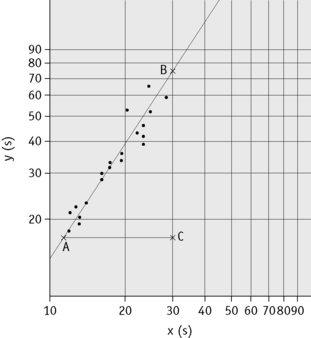
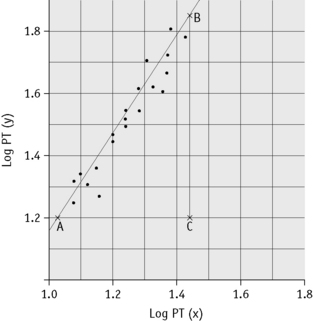
Figure 20.2 Calibration of thromboplastin. The PTs (in seconds) are converted to their logarithms, which are plotted on arithmetic graph paper. The slope is calculated as in Figure 20.1. In this example, A to C = 42 mm, B to C = 65 mm, b = 65/42 = 1.54. Therefore, ISI = 1.11 × 1.54 = 1.71.
An estimate of the slope can be obtained as shown in Figures 20.1 and 20.2; this can then be used to obtain an approximation of the ISI of the test thromboplastin.
Calculation of International Sensitivity Index
The following designations are then made:
x0 and y0 are the arithmetic means of the N values of xi and yi, respectively;
Q1 and Q2 are the sums of the squares of (xi–x0) and (yi–y0), respectively;
P is the sum of their products Σ(xi–x0)(yi–y0) E = (Q2–Q1)2 + 4P2
where b is the slope of the graph. The ISI of the preparation under test (ISIt) is then given by the following:

where IRP stands for International Reference Preparation.
Local Calibration of Thromboplastins
Although the ISI system has been very effective in standardizing anticoagulant control and improving agreement between laboratories, it is not perfect. One reason is that the ISI of a thromboplastin may vary according to the technique or coagulometer used and even with different models of the same instrument. To circumvent this, a system of local calibration has been suggested. In this system, a set of plasmas with an assigned INR are tested with the local thromboplastin–machine combination. These results are plotted on log-log paper against the assigned INR. The INR for subsequent patient samples can then be read off the graph using the locally measured PT.3,4 Thus, the PT is converted directly into an INR without the need for measurement of the ISI.
Calibration Audits
External quality-assurance surveys (e.g. UKNEQAS, see p. 594) will reflect differences regarding thromboplastin–machine combinations but not differences in blood sampling techniques (i.e. capillary and venous blood sampling). This can be a problem when capillary blood sampling is used in an outpatient setting, whereas venous samples are taken for inpatient anticoagulant monitoring. Regular audits comparing results from a range of patients whose blood has been sampled by both capillary and venous techniques will provide information not provided by NEQAS surveys.4,5
Determination of the International Normalized Ratio
Capillary Reagent
Reagents are commercially available for monitoring the INR using samples of capillary blood. These are usually a mixture of thromboplastin, calcium and adsorbed plasma so that when whole blood is added the reagent measures the overall clotting activity; it is sensitive to deficiency of factors II, VII and X. The reagents have an ISI assigned to them in the same way as individual thromboplastins and the INR is calculated from the PT ratio. These reagents are frequently used in anticoagulant clinics, when a large number of INRs need to be performed rapidly, and in point-of-care testing (see p. 471).
Therapeutic Range and Choice of Thromboplastin
Several authorities have now published recommended therapeutic ranges denoting the appropriate degree of anticoagulation in different clinical circumstances.7,8 These are largely based on controlled clinical trials but to some extent also represent a consensus on practice that has emerged over many years.
The choice of thromboplastin largely determines the accuracy with which anticoagulant control can be maintained. If the ISI of the thromboplastin is high, then a small change in PT represents a large change in the degree of anticoagulation. This affects the precision of the analysis and the coefficient of variation for the test increases with the ISI. Moreover, the target prothrombin ratio range becomes very small for any given range of INR. This is illustrated in Figure 20.3 and Table 20.1. For these reasons, it is strongly recommended that a thromboplastin with a low ISI (i.e. close to 1) is used.
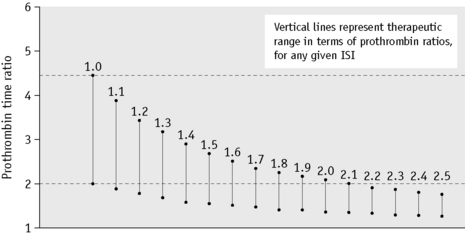
Table 20.1 Therapeutic ranges equivalent to an INR of 2.0–4.0 using different commercial thromboplastins
| Thromboplastin | ISI | Ratios equivalent to INR 2.0–4.0 |
|---|---|---|
| Thrombotest | 1.03 | 2.0–3.8 |
| Thromborel | 1.23 | 1.7–3.1 |
| Dade FS | 1.35 | 1.65–2.8 |
| Simplastin | 2.0 | 1.3–2.0 |
| Boehringer | 2.1 | 1.35–1.9 |
| Ortho | 2.3 | 1.3–1.8 |
ISI, International Sensitivity Index; INR, International Normalized Ratio.
(Modified from Poller L 1987 Oral anticoagulant therapy. In: Bloom AL, Thomas DP (eds) Haemostasis and Thrombosis, p. 870, 2nd edition. Churchill Livingstone, Edinburgh.)
Management of Overanticoagulation
The approach to management of a patient whose INR exceeds the therapeutic range with or without bleeding is shown in Table 20.2.7
Table 20.2 Recommendations for management of bleeding and excessive anticoagulation7
| 3.0<INR<6.0 (target INR 2.5) | 1. Reduce warfarin dose or stop |
| 4.0<INR<6.0 (target INR 3.5) | 2. Restart warfarin when INR <5.0 |
| 6.0<INR<8.0 No bleeding or minor bleeding | 1. Stop warfarin 2. Restart when INR <5.0 |
| INR <8.0 No bleeding or minor bleeding | 1. Stop warfarin 2. Restart warfarin when INR <5.0 3. If other risk factors for bleeding give 0.5–2.5 mg of vitamin K (oral or i.v.) |
| Major bleeding | 1. Stop warfarin 2. Give PCC 30–50 u/kg or FFP 15 ml/kg if PCC not available 3. Give 5 mg of vitamin K (i.v.) |
FFP, fresh-frozen plasma; INR, International Normalized Ratio; PCC, prothrombin complex concentrate.


