Chapter 8 Molecular and cytogenetic analysis
Introduction to the analysis of DNA
The ability to manipulate DNA as recombinant molecules followed from the discovery of bacterial DNA-modifying enzymes that allowed genes to be isolated as cloned recombinant DNA molecules and their DNA to be sequenced. The sequence of the human genome is now complete (see: www.ornl.gov/sci/techresources/Human_Genome/project/timeline.shtml).1,2 It has become extensively annotated and is accessible through a number of genome browsers. The ability to amplify specific DNA fragments from small amounts of starting material using the polymerase chain reaction (PCR)3 is now the cornerstone of most routine DNA analysis. Because this technique is relatively simple, rapid, inexpensive and requires only some basic pieces of laboratory equipment, it has made molecular genetic analysis readily accessible in many laboratories.
Guidelines from the American Association for Molecular Pathology address the choice and development of appropriate diagnostic assays, quality control and validation and implementation of molecular diagnostic tests.4 In the UK, a national external quality assessment scheme has been approved for the molecular genetics of thrombophilia and pilot studies are currently in progress for the molecular diagnosis of haematological malignancies and for haemophilia A. It is true, however, that the development and implementation of quality control methods and assurance standards still lag behind the rapid rate of expansion of molecular techniques.5,6 To overcome this, both at national and international level, several groups are attempting to reach a standardization of molecular methodologies applied to fusion gene quantification (BCR–ABL1, PML–RARA, etc.) in myeloid malignancies as well as the molecular monitoring of residual disease using antigen receptor targets in acute and chronic lymphoid malignancies.
Polymerase chain reaction
Development of the PCR3 has had a dramatic impact on the study and analysis of nucleic acids. Through the use of a thermostable DNA polymerase, Taq polymerase (available from various suppliers, including Applied Biosystems, Warrington and Thermo-Fisher, Runcorn) extracted from the bacterium Thermus aquaticus, the PCR results in the amplification of a specific DNA fragment such that it can be visualized using intercalating SYBR Safe (Invitrogen, Paisley) added to agarose gels. Ethidium bromide, a carcinogenic product, is no longer in use for safety reasons. The procedure takes only a few hours and requires only a very small amount of starting material.
Principle
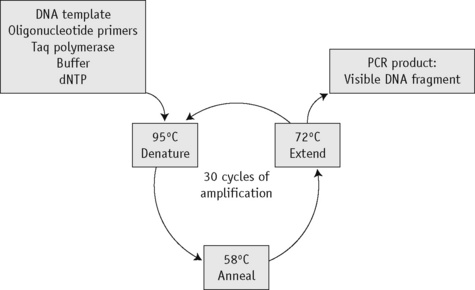
The first step of the reaction is to denature the DNA, generating single-stranded templates, by heating the reaction mixture to 95°C. The reaction is then cooled to a temperature, usually between 50°C and 68°C, that permits the annealing of the primers to the DNA template but only at their specific complementary sequences. The temperature is then raised to 72°C, at which temperature the Taq polymerase efficiently synthesizes DNA, extending from the primers in a 5′ to 3′ direction. Cyclical repetition of the denaturing, annealing and extension steps, by simply changing the temperature of the reaction in an automated heating block, results in exponential amplification of the DNA that lies between the two primers (Fig. 8.1).
Reagents
Method
Optimal conditions for the reaction have to be derived empirically, with the magnesium concentration and annealing temperature being the most important parameters.7 The choice of buffer depends on the enzyme being used and the company will usually supply the most appropriate one. For genes with a high GC content, buffer II in combination with 10% DMSO may give better amplification. In most cases, a 25 μl reaction volume suffices. A blank control should always be included (i.e. a reaction without any template) to control for contamination. If the blank control yields a product, the analysis is invalid. A DNA sample that is known to amplify can also be included and this sample may then be used as a normal or positive control.
| Stock solution | Volume (μl) | Final concentration |
|---|---|---|
| ×10 PCR buffer III | 50 | ×1 |
| 25 mmol/l MgCl2 | 40 | 2.0 mmol/l |
| 10 mmol/l dNTP | 10 | 0.02 mmol/l |
| 10 μmol/l Primer (1) | 20 | 0.04 μmol/l |
| 10 μmol/l Primer (2) | 20 | 0.04 μmol/l |
| 5 u/μl Taq polymerase | 2 | 0.02 μ/ml |
| Water | 358 | |
| Final volume | 500 |
Add the Taq polymerase last, mix well and pulse-spin in a microcentrifuge to bring down the contents of the tube.
Modifications and Developments
Analysis of polymerase chain reaction products
Presence or Absence of a Polymerase Chain Reaction Product
Amplification Refractory Mutation System
Principle
Point mutations and small insertions or deletions can be identified directly by the presence or absence of a PCR product using allele-specific primers.8,9 Two different oligos are used that differ only at the site of the mutation (the amplification refractory mutation system or ARMS, primers) with the mismatch distinguishing the normal and mutant base located at the 3′ end of the oligo. In a PCR, an oligo with a mismatch at its 3′ end will fail to prime the extension step of the reaction. Each test sample is amplified in two separate reactions containing either a mutant ARMS primer or a normal ARMS primer. The mutant primer will prime amplification together with one common primer from DNA with this mutation but not from a normal DNA. A normal primer will do the opposite. To increase the instability of the 3′ end mismatch and so ensure the failure of the amplification, it is sometimes necessary to introduce a second nucleotide mismatch three or four bases from the 3′ end of both oligos. A second pair of unrelated primers at a distance from the ARMS primers is included in each reaction as an internal control to demonstrate that efficient amplification has occurred. This is essential because a failure of the ARMS primer to amplify is interpreted as a significant result and must not be the result of suboptimal reaction conditions.
Gap-PCR
Large deletions can be detected by Gap-PCR. Primers located 5′ and 3′ to the breakpoints of a deletion will anneal too far apart on the normal chromosome to generate a fragment in a standard PCR. When the deletion is present, the sites at which these primers anneal will be brought together, enabling them to give rise to a product. An example of this is given for the detection of deletions in α° thalassaemia in Figure 8.4 on p. 149.
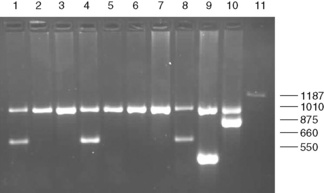
Figure 8.4 Detection of α° thalassaemia by multiplex Gap-PCR. The sequences of the primers used are shown in Table 8.1. A normal fragment of 1010 bp is generated by the primers α/SEA(F) and α/(R) in all lanes (although this is very faint in lane 11). In addition, a fragment of 660 bp is generated by the primer pair α/SEA(F) and SEA(R) in lanes 1, 4 and 8 in individuals who are heterozygous for the − −SEA deletion; a fragment of 550 bp is generated by the primer pair FIL(F) and FIL(R) in lane 9 in an individual who is heterozygous for the − −FIL deletion; a fragment of 875 bp is generated by the primer pair MED(F) and MED(R) in lane 10 in an individual who is heterozygous for the − −MED deletion; and a fragment of 1187 bp is generated by the primer pair 20.5(F) and 20.5(R) in lane 10 in an individual who is heterozygous for the −α20.5 deletion.
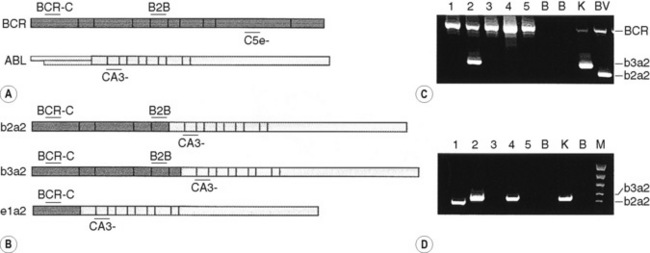
By the same principle, the sites at which primers anneal can be brought together by chromosomal translocation, giving rise to a diagnostic product. Breakpoints may be clustered over too large a region for genomic DNA to be used in these instances. However, leukaemic translocations can also give rise to transcribed fusion genes. Primer annealing sites in different genes are then juxtaposed in a hybrid messenger RNA (mRNA) molecule and can give rise to a reverse transcription-PCR (RT-PCR) product. Examples of this are given for the analysis of minimal residual disease in chronic myelogenous leukaemia (CML) in Figure 8.8 on p. 155.
Restriction Enzyme Digestion
Principle
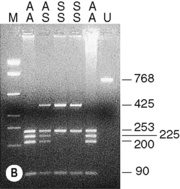
Restriction enzymes (RE) cleave DNA at short specific sequences. Because many RE are available, it is not uncommon for a single point mutation to coincidentally create or destroy an RE recognition sequence. If this is the case, digestion of the appropriate PCR product prior to agarose gel electrophoresis enables the mutation to be identified. A difference in the size of the restriction fragments seen in normal and mutant samples can be predicted from a restriction map of the amplified fragment and the site of the mutation that changes a restriction site. The observed fragments should be consistent with either the mutant or the normal pattern. An example is shown in Figure 8.2 on p. 147 in the diagnosis of the sickle cell mutation.
Reagents
Method
Allele-Specific Oligonucleotide Hybridization
Principle
Under appropriate conditions, short oligonucleotide probes will hybridize to their exact complementary sequence but not to a sequence in which there is even a single base mismatch.10 A pair of oligos is therefore used to test for the presence of a point mutation: a mutant oligo complementary to the mutant sequence and a normal oligo complementary to the normal sequence, with the sequence difference placed near the centre of each oligo.
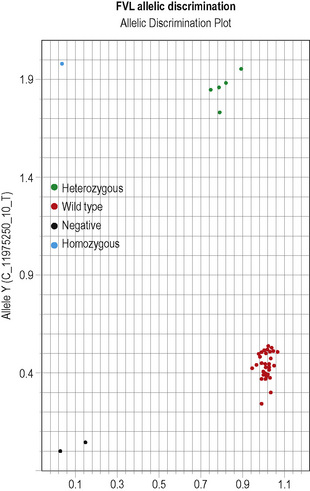
This methodology has been widely applied for the detection of point mutations using fluorescently labelled TaqMan probes that distinguish the two alleles. Two short allele-specific probes are used, one of which will hybridize only to the wild-type allele and one of which will hybridize only to the mutant allele. Each probe is labelled with a different fluorescent colour, which is quenched while the probe remains intact, but is released if and when the probe hybridizes to its perfectly complementary sequence during the PCR reaction, as it will then be broken up by the exonuclease activity of the Taq polymerase. An example of this analysis is the detection of the factor V Leiden mutation in Figure 8.5 on p. 150.
Interpretation
Other non-radioactive probes, with detection systems involving horseradish peroxidase, have also been quite widely used in this procedure.11 The technique has also been modified such that the allele-specific oligonucleotides are immobilized onto nylon membranes and the patient-specific PCR product is used as the probe–the reverse dot blot procedure.12 This allows for several different mutations to be analysed simultaneously and has proved particularly useful in the diagnosis of β thalassaemia mutations.13
DNA Sequencing
Reagents
Method
Interpretation
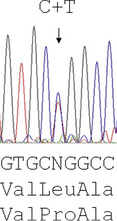
Reading the DNA sequence from a good trace – known as an electrophoretogram – is completely straightforward: As are called as green peaks; Ts as red; Cs as blue; and Gs as black. Free software packages, such as Chromas (at: http://chromas-lite-version.fyxm.net/), are available for viewing these traces and will call the DNA sequence in the file. Simple alignment of this sequence to the GenBank reference sequence can be performed at the National Center for Bioinformatics (NCBI) using the Blast program (at: http://blast.ncbi.nlm.nih.gov/Blast.cgi?CMD=Web&PAGE_TYPE=BlastHome) and will identify any sequence changes. Heterozygous point mutations will be seen as double peaks, with two colours overlaid. Small heterozygous insertions or deletions (indels) are harder to decipher, as the sequence 3′ of the mutation will be a double sequence, with the normal and indel allele superimposed on one another: the extent of the indel can be defined by subtracting from the expected normal sequence.
Investigation of haemoglobinopathies
Sickle Cell Disease
The presence of a sickle cell gene can be determined by haemoglobin cellulose acetate electrophoresis or a sickling test. However, there are occasions when it is beneficial to make this diagnosis by DNA analysis (e.g. in prenatal diagnosis, which can be performed at 10 weeks of pregnancy, in distinguishing HbS/S from HbS/β° thalassaemia or in confirming the diagnosis of sickle cell anaemia in a neonate). For the type of specimens collected for prenatal diagnosis, refer to p. 330.
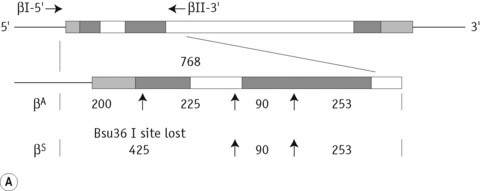
The sickle cell mutation in codon 6 of the β globin gene (GAG → GTG) results in the loss of a Bsu36 I (or Mst II, Sau I, OxaN I or Dde I) restriction enzyme site that is present in the normal gene. It is therefore possible to detect the mutation directly by restriction enzyme analysis of a DNA fragment generated by the PCR. A pair of primers are used to amplify exons 1 and 2 of the β globin gene and the products of the PCR are digested with Bsu36 I. The loss of a Bsu36 I site in the sickle cell gene gives rise to an abnormally large restriction fragment that is not seen in normal individuals (Fig. 8.2).
β Thalassaemia
The ethnic groups with the highest incidence of β thalassaemia are the Mediterranean populations, Asian Indians, Chinese and Africans. Although more than 100 β thalassaemia mutations are known, each of these groups has its own subset of mutations, so that as few as five different mutations may account for more than 90% of the affected individuals in a population. This makes the direct detection of β thalassaemia mutations a reasonable possibility and it has become the method of choice where it is most important: in prenatal diagnosis.13,14
The majority of mutations causing β thalassaemia are point mutations affecting the coding sequence, splice sites or promoter of the β globin gene. Methods for their detection include either ARMS or reverse dot blot analysis, although more commonly now, they are detected by direct DNA sequence analysis. Unstable and other unusual haemoglobins may also cause disease and can also be identified by direct DNA sequence analysis. An example of such a case is shown in Figure 8.3, where a picture of moderate anaemia is seen in the heterozygote due to the highly unstable and electrophoretically silent variant, haemoglobin, Durham, NC.
α Thalassaemia
In contrast to the β thalassaemias, the most common α thalassaemia mutations are deletions. Two categories exist: those that remove only one of the two alpha globin genes on any one chromosome (α+ thalassaemia) and those that remove both of the alpha genes from one chromosome (α° thalassaemia). Although PCR amplification around the alpha globin locus has proved to be rather difficult, the common deletions can now be identified by a reasonably robust Gap-PCR.15 In these reactions dimethylsulphoxide (DMSO) and betaine are added. Two different multiplex PCR reactions are set up, one for the common α+ thalassaemias (−α3.7 and −α4.2) and one for the common α° thalassaemias (− −SEA, − −MED, − −FIL and −α20.5). The fragment generated by these primers across the deletion breakpoint is different in size to a control fragment that is generated from the normal chromosome as a part of the multiplex reaction. The primers that flank the deletion breakpoint are too far apart to generate a fragment from the normal chromosome in the PCR. Only when these are brought closer together as a result of the deletion can a fragment be produced. Primer sequences used in this analysis are given in Table 8.1 and an example of their application in the detection of α thalassaemias is shown in Figure 8.4. More than 30 non-deletional forms of α thalassaemia have been described. Of these, Hb Constant Spring and the αHphIα mutation are relatively common in South-east Asian and Mediterranean populations, respectively. These can be detected by ASOH, ARMS, restriction enzyme digestion or direct sequencing of the appropriate PCR product. Unlike the β thalassaemias, α thalassaemias are not easily diagnosed using routine haematological techniques. The diagnosis of α thalassaemias is often made following exclusion of β thalassaemia and iron deficiency. Because the vast majority of cases of α thalassaemia are of the clinically benign type (i.e. α+ thalassaemia), it is debatable whether molecular analysis is justified to reach a diagnosis in these individuals. However, it is important that individuals with α° thalassaemia are identified and the only definitive diagnostic test is DNA analysis. The α° thalassaemias are almost entirely restricted to at-risk ethnic groups, particularly those of South-east Asian or Mediterranean origin and so it is most efficient to target these groups specifically. The diagnosis of α° thalassaemia is particularly relevant if prenatal diagnosis is to be offered to a couple who are at risk of having a fetus with hydrops, where there is an increased risk of maternal death at delivery. Guidelines derived from the UK experience as to how and when DNA analysis should be implemented have recently been updated.16
Table 8.1 Primers used in Gap-PCR analysis of α-thalassaemia
| Primer name | Sequence, 5′→3′ | Concentration (μmol/l) |
|---|---|---|
| α° | Multiplex PCR | Clark and Thein (2004)14 |
| 20.5(F) | GGGCAAGCTGGTGGTGTTACACAGCAACTC | 0.1 |
| 20.5(R) | CCACGCCCATGCCTGGCACGTTTGCTGAGG | 0.1 |
| α/SEA(F) | CTCTGTGTTCTCAGTATTGGAGGGAAGGAG | 0.3 |
| α(R) | TGAAGAGCCTGCAGGACCAGGTCAGTGACCG | 0.15 |
| MED(F) | CGATGAGAACATAGTGAGCAGAATTGCAGG | 0.15 |
| MED(R) | ACGCCGACGTTGCTGCCCAGCTTCTTCCAC | 0.15 |
| SEA(R) | ATATATGGGTCTGGAAGTGTATCCCTCCCA | 0.15 |
| FIL(F) | AAGAGAATAAACCACCCAATTTTTAAATGGGCA | 1.6 |
| FIL(R) | GAGATAATAACCTTTATCTGCCACATGTAGCAA | 1.6 |
| α+ | Multiplex PCR | From JM Old (pers. comm.) |
| 3.7F | CCCCTCGCCAAGTCCACCC | 0.4 |
| 3.7/20.5R | AAAGCACTCTAGGGTCCAGCG | 0.4 |
| 4.2F | GGTTTACCCATGTGGTGCCTC | 0.6 |
| 4.2R | CCCGTTGGATCTTCTCATTTCCC | 0.8 |
| α2R | AGACCAGGAAGGGCCGGTG | 0.1 |
PCR, polymerase chain reaction.
Disorders of coagulation
Thrombophilia
Considerable advances have been made in our understanding of the genetic risk factors found in patients with venous thromboembolism (VTE).17 Among these are the diverse mutations causing protein C, protein S and antithrombin deficiency. An increased factor VIII level is also a risk factor for VTE, but the genetic determinants of this are unclear. Homozygosity for the common C677T mutation of the methylenetetrahydrofolate reductase gene, which gives rise to a thermolabile variant of this protein, has been reported to be a risk factor for VTE, although other studies have not supported this claim. A point mutation in the 3′ UTR of the prothrombin gene associated with elevated protein levels has been identified as a genetic risk factor for VTE.18 The most common of the known genetic risk factors for VTE is a resistance to the anticoagulant effect of activated protein C caused by the Arg506Gln substitution in factor V (factor V Leiden, FVL);19 around 20% of subjects of north European origin presenting for the first time with thromboembolism are heterozygous for this mutation. Because of their prevalence and because the tests have become relatively simple, there is a tendency toward indiscriminate testing for these genetic risk factors in thrombophilia, but without careful and informed counselling this may often be inappropriate (see also Chapter 19).20


