Imaging in Prostate Cancer
Hebert Alberto Vargas
Amita Shukla-Dave
Oguz Akin
Hedvig Hricak
INTRODUCTION
Prostate cancer is the most common noncutaneous malignancy in American men (1), and despite advances in its detection and treatment, it has remained the second most common cause of cancer-related deaths among such men for more than 20 years (2,3). During this time, increased use of prostate-specific antigen (PSA) screening has led to a downward trend in prostate cancer stage at diagnosis. Not surprisingly, this trend poses a challenge for imaging, as smaller tumors are more difficult to detect. There is, however, growing understanding of the variable biological behavior of the disease, which ranges from indolent, or slowly progressing, to aggressive and rapidly advancing. As a result, imaging techniques that provide information on functional aspects as well as structural features of prostate cancer are being developed and are starting to gain acceptance in clinical practice.
The value of screening for prostate cancer has not been fully established. Two large recently published clinical trials illustrate this controversy. The Prostate, Lung, Colorectal, and Ovarian Cancer Screening Trial in the United States reported no decrease in mortality from screening (4), while the European Randomized Study of Screening for Prostate Cancer concluded that PSA screening was associated with a 20% relative reduction in the death rate from prostate cancer (5). Neither of these studies provided a definitive answer, and further studies examining not only clinical outcomes but also cost-effectiveness and impact on quality of life are expected. In the meantime, however, the controversy continues. Currently, the American Urological Association (AUA) recommends that serum PSA measurement and digital rectal examination (DRE) be offered to asymptomatic men 40 years of age or older who wish to be screened and have an estimated life expectancy of more than 10 years. Testing at an earlier age should be limited to men with defined risk factors, such as having a first-degree relative with prostate cancer or being African American (6).
Numerous types of imaging are available for assessing prostate cancer, including transrectal ultrasound (TRUS), computed tomography (CT), magnetic resonance imaging (MRI), and radioisotope studies. Each may aid diagnosis, staging, or posttreatment assessment. All have advantages and limitations depending on the clinical scenario. To maximize the contribution of imaging to clinical decision making, the imaging approach should be tailored to the specific clinical questions that need to be answered in the individual patient.
IMAGING FOR PROSTATE CANCER STAGING
Transrectal Ultrasonography and TRUS-guided Biopsy
Indications
Transrectal ultrasonography (TRUS) continues to play an important role in prostate cancer management, mainly as a tool for guiding biopsy. When cancer is suspected based on an abnormal DRE or an elevated serum PSA level, the essential diagnostic test is a needle biopsy of the prostate. In a recent update of its PSA Best Practice Statement (6), the AUA broke with its previously published guidelines by not recommending a single threshold PSA value at which biopsy should be performed. Instead, the association recommended basing the decision to perform biopsy primarily on PSA level and DRE results, but also on factors such as free and total PSA; PSA velocity; PSA density; and the patient’s age, ethnicity, family history, and comorbidities.
Findings
TRUS can measure with reasonable accuracy (±10%) the size of the prostate gland (7), an important factor in computing “PSA density” (serum PSA in ng/mL divided by the volume of the prostate in cm3) (8). Tumors, depending on their size, grade, and location, usually appear hypoechoic relative to the normal peripheral zone (PZ) of the prostate, as shown in Figure 10.1 (9). Some palpable cancers are not visible on ultrasound and some visible cancers are not palpable (9,10). With the shift toward small, early-stage cancers, most cancers detected today are not visible on ultrasound (low sensitivity), and many hypoechoic areas do not prove to be malignant on biopsy (low specificity). Therefore, TRUS images have limited value in cancer diagnosis, and ultrasound alone should never be used to rule out the presence of a cancer.
TRUS has also been used to evaluate the extent of local disease. The criteria for extracapsular extension (ECE) are bulging and irregularity of the capsule adjacent to a hypoechoic lesion. The length of contact of a visible lesion with the capsule is also associated with the probability of ECE (11). Seminal vesicle invasion (SVI) is heralded by visible extension of a hypoechoic lesion at the base of the prostate into a seminal vesicle or by echogenic cancer within the normally fluid-filled seminal vesicle (12). There has been some enthusiasm for color duplex Doppler ultrasonography to identify cancer in hypervascular areas (13,14), but there is no clear evidence of greater sensitivity, specificity, or staging accuracy (Fig. 10.1). Similarly, the use of microbubbles as ultrasound intravenous contrast media has recently received attention. These relatively large (1-7 μm) gas-filled agents do not diffuse out of the circulation and thus behave as blood-pool markers that can be visualized on real-time ultrasound. They can be coated with surface ligands to target and provide useful information about tumor microvascularity. Recent studies show a modest increase in sensitivity for prostate cancer detection with the use of microbubbles as compared to conventional grayscale imaging and Doppler studies (15,16); however, the evidence is insufficient to warrant the routine use of microbubbles in clinical practice. Another new technique, ultrasound elastography, exploits the differences in tissue strain produced by freehand compression (17). Using elastography, the operator is able to discriminate hard from soft tissue regions within the prostate, with stiffness values marked in different colors and shown in real-time images. Based on the hypothesis that the consistency of solid tumors differs from that of adjacent normal tissue, elastography is being investigated as a novel tool for detecting prostate cancer (18).
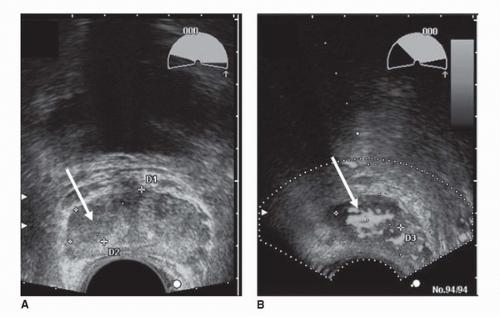 FIGURE 10.1. Grayscale (A) and Doppler (B) transverse transrectal ultrasound images demonstrate a hypoechoic region (arrows) in the right side of the peripheral zone suspicious for cancer. Doppler ultrasonography (B) identifies hypervascular areas in the lesion, indicating cancer (see color insert). (Courtesy of Dr. Fred Lee, University of Wisconsin.) (See color insert for (B).) |
TRUS is also frequently used in therapy. Worldwide, TRUS is the imaging modality of choice for directing brachytherapy seeds into the prostate (19). Cryotherapy, hyperthermia, and photodynamic therapy of the prostate require ultrasound guidance. In addition, high-intensity focused ultrasound, coupled with sonographic targeting, is used for focal ablation of prostate cancers (20). Novel treatment approaches, such as direct injection of oncolytic viruses and gene therapy, also depend on TRUS for accessing prostate cancer (21). Until MRI guidance is widespread and much less expensive than it is now, TRUS will continue to play a major role in the management of prostate cancer patients.
Computed Tomography
Indications
The majority of patients with newly diagnosed localized prostate cancer are at low risk for metastases. The diagnostic yield of CT is low in these patients, with false positive more common than true positives, leading to inaccurate staging, additional diagnostic workup, and, sometimes, inappropriate treatment. According to the AUA guidelines, CT may be considered in high-risk patients with clinically localized prostate cancer when the PSA is >20 ng/mL, when the disease is locally advanced, or when the Gleason score is >7 (6). However, unusual or discrepant clinical data may call for the use of CT, even if an individual falls below recommended risk thresholds. Modern multidetector CT scanners allow imaging of the entire abdomen and pelvis in just a few seconds, and advanced reconstruction algorithms facilitate three-dimensional (3D) image manipulation in different planes.
Findings
Due mainly to the lack of soft tissue contrast, the CT appearance of normal prostate tissue and normal seminal vesicles (Fig. 10.2) is similar to the CT appearance of prostate cancer, even when ECE and SVI are present (22). Consequently, even in high-risk patients, the role of CT in local staging is limited to the assessment of nodal involvement (23). CT can be useful as a baseline examination in clinically apparent, high-risk patients with grossly advanced local disease. Such patients will nearly always fall above the cutoff recommendations for the appropriate use of CT imaging based on DRE, PSA, and Gleason grade; they will also be at risk for lymph node metastases, which may be assessed concurrently.
The regional lymph nodes for prostate cancer (designated as N1 in the TNM staging system) are pelvic nodes, including obturator, iliac, and sacral (lateral, presacral, promontory [Gerota’s]) (Fig. 10.3). The diagnosis of prostate cancer nodal metastases on CT has been based solely on nodal size (a short axis diameter >1.0 cm). However, the correlation between nodal enlargement and metastatic involvement is poor (24). Reports of CT sensitivity for the detection of lymph node metastases vary. One study reported values of 85% sensitivity and 67% specificity (25), although specificity as low as 25% has occasionally been reported (26). Oyen et al. found sensitivity of 78% and specificity of 97% using a size threshold of 0.6 cm (27). In the same study, they also reported specificity of 100% for CT combined with CT-guided fine-needle aspiration (FNA) biopsy. However, neither the smaller size criterion nor the use of FNA biopsy has been broadly accepted.
Nodal disease often progresses in stepwise fashion, such that retroperitoneal or mediastinal nodal disease is most often accompanied by pelvic lymphadenopathy (28). If staging by cross-sectional imaging is initially limited to the pelvis, evaluation of the abdominal nodes is warranted whenever enlarged pelvic lymph nodes are identified. Nodal disease outside the pelvis and distant (such as bone, liver, and lung) metastases are features of late-stage prostate cancer (M1). Bone scan and MRI are superior to CT in diagnosis and follow-up of bone metastases (29). However, lytic and blastic bone metastases will commonly be visible on CT and should not be overlooked.
More recently, both dynamic contrast-enhanced (DCE) “perfusion” CT and MRI have been used for the evaluation of tumor microvasculature. Compared to DCE-MRI, DCE CT has the advantage of allowing direct correlation between changes in iodine concentration and enhancement (30). However, at
present, this technique has significant limitations for evaluating prostate cancer, such as a considerable radiation exposure, poor soft tissue resolution, and poor signal-to-noise ratio (30). In a study by Ives et al., correlation between DCE CT and tumor location on pathology was only significant in subjects with high-volume, poorly differentiated (Gleason score 10) prostate cancer (31).
present, this technique has significant limitations for evaluating prostate cancer, such as a considerable radiation exposure, poor soft tissue resolution, and poor signal-to-noise ratio (30). In a study by Ives et al., correlation between DCE CT and tumor location on pathology was only significant in subjects with high-volume, poorly differentiated (Gleason score 10) prostate cancer (31).
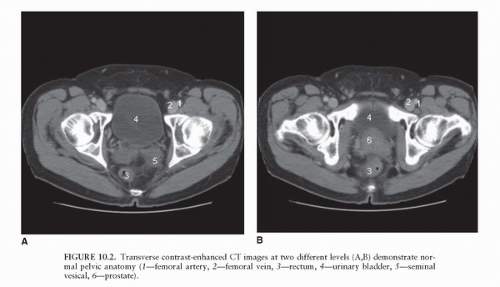 FIGURE 10.2. Transverse contrast-enhanced CT images at two different levels (A,B) demonstrate normal pelvic anatomy (1—femoral artery, 2—femoral vein, 3—rectum, 4—urinary bladder, 5—seminal vesical, 6—prostate). |
Magnetic Resonance Imaging
Indications
There is no definite consensus about the role of MRI in prostate cancer management. The reported accuracy of MRI in prostate cancer detection ranges from as low as 54% to as high as 93% (32,33,34,35,36,37). This wide range is not entirely surprising given the continuous improvement of MRI technology (higher strength magnets, more powerful gradient coils, faster imaging sequences, better image processing), the ongoing refinement of imaging criteria for identifying and staging prostate cancer, and the inevitable “learning curve” of the interpreting radiologists. Two studies of the same patient population showed that endorectal MRI contributed incremental value to clinical variables in predicting extracapsular extension, although the contribution was only significant when MRI was interpreted by specialists in genitourinary MRI as opposed to general body MRI radiologists (38,39). In recent years, nomograms have been introduced to help predict the pathological stage of prostate cancer and facilitate treatment decisions. The Kattan staging nomogram, which is based on presurgical clinical variables (serum PSA level, Gleason grade at biopsy, clinical stage, and systematic needle biopsy cores from the base of the prostate), is a validated and widely used predictive tool. Several studies have shown that endorectal MRI findings can contribute significant incremental value to this instrument.
In one study, the Kattan nomogram plus endorectal MRI had a significantly larger AUC for the detection of SVI (0.87) than did either endorectal MRI alone (0.76) or the Kattan nomogram alone (0.80) (40). Another study found that endorectal MRI contributed significant incremental value (p ≤ 0.02) to the Kattan nomogram in predicting organ-confined prostate cancer, particularly in intermediate- and high-risk patients (41). At present, according to the American College of Radiology appropriateness criteria, endorectal MRI may be considered in “patients with high-range PSA and high-volume disease by biopsy” (42). Admittedly, if MRI could detect every prostate cancer, the technology would benefit all patients with the disease. However, no matter how experienced the reader is, MRI does not reach this level of accuracy. Despite this, one might argue that even when MRI findings are normal or near normal, they can help characterize a cancer indirectly (43). For example, in one study, a model combining MRI, MR spectroscopic imaging (MRSI), and clinical findings was more accurate than a purely clinical model for predicting the presence of pathologically defined insignificant cancer before radical prostatectomy (44).
In one study, the Kattan nomogram plus endorectal MRI had a significantly larger AUC for the detection of SVI (0.87) than did either endorectal MRI alone (0.76) or the Kattan nomogram alone (0.80) (40). Another study found that endorectal MRI contributed significant incremental value (p ≤ 0.02) to the Kattan nomogram in predicting organ-confined prostate cancer, particularly in intermediate- and high-risk patients (41). At present, according to the American College of Radiology appropriateness criteria, endorectal MRI may be considered in “patients with high-range PSA and high-volume disease by biopsy” (42). Admittedly, if MRI could detect every prostate cancer, the technology would benefit all patients with the disease. However, no matter how experienced the reader is, MRI does not reach this level of accuracy. Despite this, one might argue that even when MRI findings are normal or near normal, they can help characterize a cancer indirectly (43). For example, in one study, a model combining MRI, MR spectroscopic imaging (MRSI), and clinical findings was more accurate than a purely clinical model for predicting the presence of pathologically defined insignificant cancer before radical prostatectomy (44).
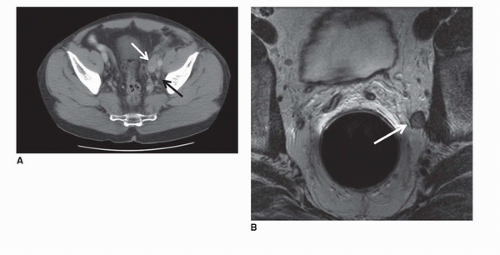 FIGURE 10.3. (A) Transverse contrast-enhanced CT image demonstrates an enlarged obturator lymph node (black arrow) and an enlarged external iliac lymph node (white arrow); (B) Transverse T2-weighted MR image depicts an enlarged left obturator lymph node (white arrow). |
Technique
Optimal MRI of prostate cancer requires the use of an endorectal coil in conjunction with a pelvic phased-array coil on a 1.5-T or higher strength magnet. To produce T2-weighted images (T2WI) of excellent resolution for local staging, thin slices (3 mm) and a small (14 cm) field of view are required (45).
Adequate evaluation of the pelvis requires both T1- and T2-weighted spin-echo MR images. T1-weighted images (T1WI) should be taken in the transverse plane from below the symphysis pubis up to the aortic bifurcation. T2WI should be obtained in the transverse plane from below the prostatic apex to above the seminal vesicles. T2WI should be obtained in the coronal or sagittal plane for optimal visualization of the seminal vesicles. Other MR techniques may also be added, and they can all be performed during one single imaging session. Obtaining the standard sequences (transverse T1, transverse, sagittal and coronal T2) takes approximately 30 minutes. MRSI adds approximately another 20 minutes to the examination. Diffusion-weighted imaging (DWI) involves fast acquisition and can be obtained in approximately 4 minutes. In DCE-MRI, following intravenous contrast, serial images are taken about every 1.5 seconds for 4 to 5 minutes.
Findings
The prostate is divided into four anatomical regions, first described by McNeal (46). These regions are exquisitely depicted on T2WI (Fig. 10.4). The prostatic urethra is the key to understanding the zonal anatomy, serving as a central reference point. The transition zone (TZ) surrounds the anterior and lateral parts of the proximal urethra in a horseshoe-like fashion. On T2WI, it shows heterogeneous signal intensity. The central zone surrounds the proximal urethra posterosuperiorly, enclosing the TZ, and is typically of homogeneous low signal intensity on T2WI. The central and TZs (sometimes together referred to as the “central gland”) sit within the peripheral zone, much like a scoop of ice cream in a cone (47). The peripheral zone is of homogeneous high signal intensity and comprises all the prostatic tissue at the apex as well as the tissue posteriorly near the low-signal-intensity capsule. When interpreting imaging studies, one must account for changes due to benign prostatic hyperplasia (BPH), which is almost invariably present in the patient population undergoing prostate MRI. BPH involves predominantly the TZ, causing compression of the central zone and, as it grows, accounting for an increasing proportion of the prostatic volume. The anterior fibromuscular stroma forms the homogeneous low-signal-intensity external convexity in the anterior surface of the gland. The neurovascular bundles are seen bilaterally in the posterolateral aspect of the capsule.
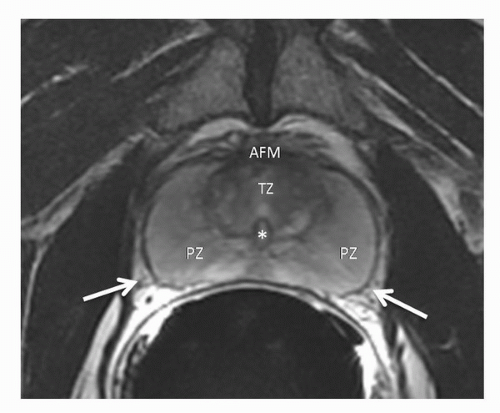 FIGURE 10.4. Normal zonal anatomy on transverse T2-weighted MRI. PZ, peripheral zone; TZ, transition zone; AFM, anterior fibromuscular stroma; *, urethra; Arrows, neurovascular bundles. |
The peripheral zone is the most common site of prostate cancer, and on T2WI, cancer is demonstrated as decreased signal intensity within the normal high-signal-intensity peripheral zone. ECE can be identified by a contour deformity with a stepoff or angulated margin, an irregular bulge or edge retraction, a breach of the capsule with evidence of direct tumor extension, obliteration of the rectoprostatic angle, or asymmetry of the neurovascular bundles (Fig. 10.5) (34,48). The criteria for SVI include contiguous low-signal-intensity tumor extension from the base of the gland into the seminal vesicles, tumor extension along the ejaculatory duct (nonvisualization of the ejaculatory duct), asymmetric decrease in the signal intensity of the seminal vesicles, and decreased conspicuity of the seminal vesicle wall on T2WI (49). In diagnosing ECE, transverse images are essential, but coronal plane images are also helpful. Combined transverse, coronal, and sagittal planes of section facilitate the assessment of seminal vesical and bladder invasion (50). Examples of prostate cancer staging as illustrated on transverse T2WI of four different patients are shown in Figure 10.6.
While MRI has been most effective for detecting prostate cancer in the PZ, it also can also be used to evaluate tumors in the TZ, as demonstrated in recent studies (51,52). Findings indicative of TZ cancer include (a) a homogenous low-signalintensity region in the TZ, (b) poorly defined lesion margins, (c) lack of a low-signal-intensity rim (seen commonly in association with benign adenomatous nodules), (d) lenticular shape, and (e) urethral or anterior fibromuscular stromal invasion (Fig. 10.7) (51). Tumors in the TZ and in the anterior part of the PZ should be carefully sought during MRI interpretation in patients with rising PSA levels and negative prostate biopsies, as these areas are not typically sampled during TRUS-guided biopsy.
On T1WI, the prostate has homogeneous intermediate signal intensity and the zonal anatomy is not well demonstrated. This sequence is useful for the assessment of pelvic bone lesions and
regional lymph nodes, as well as identifying postbiopsy hemorrhage. Postbiopsy hemorrhage may hamper tumor detection in the prostate and is present in as many as 95% of patients in the first few weeks after TRUS-guided biopsy (53), leading to either underestimation or overestimation of the tumor presence and local extent. The imaging appearance depends upon the length of time between the biopsy and the MRI, and the MRI should be delayed for at least 3 to 4 weeks after biopsy (54,55).
regional lymph nodes, as well as identifying postbiopsy hemorrhage. Postbiopsy hemorrhage may hamper tumor detection in the prostate and is present in as many as 95% of patients in the first few weeks after TRUS-guided biopsy (53), leading to either underestimation or overestimation of the tumor presence and local extent. The imaging appearance depends upon the length of time between the biopsy and the MRI, and the MRI should be delayed for at least 3 to 4 weeks after biopsy (54,55).
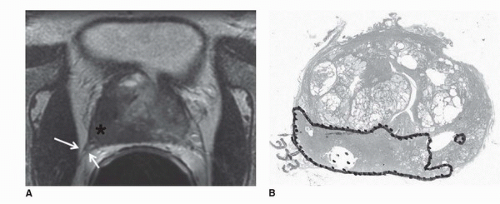 FIGURE 10.5. (A) Transverse T2-weighted MR image which demonstrates a large tumor in the right side of the peripheral zone (asterisk) with focal bulging and envelopment of the neurovascular bundle (arrows); both findings indicate extracapsular extension. (B) Corresponding step-section pathology shows tumor (outlined) and site of established extracapsular extension. |
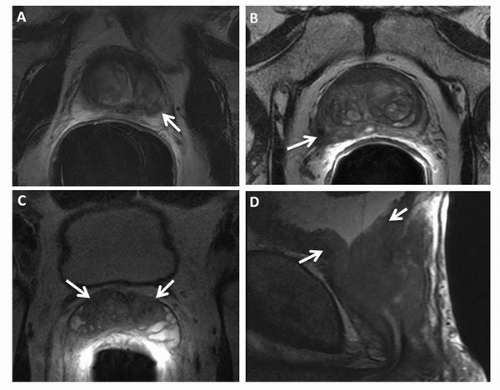 FIGURE 10.6. Local prostate cancer staging in four different patients as illustrated by transverse T2-weighted MRI. (A) Tumor (arrow) confined within the left lobe of the prostate (stage T2). (B) Right peripheral zone tumor (arrow) with gross extracapsular extension (stage T3a). (C) Seminal vesicle invasion (arrow) (stage T3b). (D) Bladder wall invasion (arrows) (stage T4). |
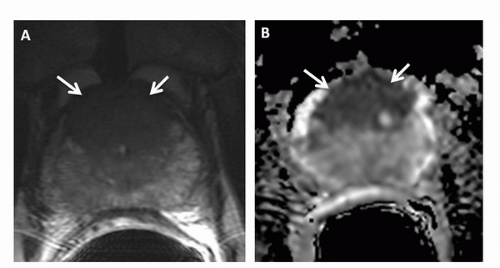 FIGURE 10.7. (A) Transverse T2-weighted image and (B) ADC map demonstrate a large transition zone tumor (arrows). |
On MRI, a lymph node is considered to be malignant if the short axis is more than 8 mm in a round node or more than 10 mm in an oval node. With use of these size and shape criteria, the sensitivity of MRI for detecting lymphadenopathy is around 75% (56). The accuracy of MRI improves substantially with the use of highly lymphotropic superparamagnetic iron nanoparticles; these gain access to lymph nodes by means of interstitial-lymphatic fluid transport and enter lymphatic tissue but not metastatic tissue, providing tissue contrast within the lymph node and allowing detection of metastases (57). Harisinghani et al. (58) reported a sensitivity of 100% and a specificity of 96% in the detection of nodal involvement in patients with prostate cancer with the use of one such agent (ferumoxtran-10). In addition, this technique can depict lymph nodes in the entire pelvic area as well as in the abdominal nodal region. MRI has been shown to be both sensitive and specific in the diagnosis of bone metastases (Fig. 10.8); in fact, small metastatic deposits in the bone and those without cortical involvement may be detected earlier on MRI than on bone scans (29).
Proton Magnetic Resonance Spectroscopic Imaging
1H MRSI of the prostate allows the detection of metabolites in vivo. The major metabolites observed in an MRSI spectrum from the normal prostate PZ are choline-containing compounds, creatine, polyamine, and citrate. The choline peak consists mainly of choline, phosphocholine, and glycerophosphocholine, which are constituents of cell membrane synthesis and degradation pathways (59,60,61,62). The creatine peak is comprised of creatine and phosphocreatine (63). The polyamine peak at the clinical field strength of 1.5 T shows high spermine signal at 3.1 ppm that overlaps between the resonances of choline and creatine in normal PZ tissue (64).
Choline-containing compounds have been found to be elevated and polyamine and citrate reduced in pathology-proven PZ cancer as compared to healthy PZ tissue (59,63,65,66) (Fig. 10.9). A primary function of the normal prostate is to produce and secrete an enormous amount of citrate, which is
achieved by zinc-induced inhibition of m-aconitase (a Krebs cycle enzyme) (63). The reduction of citrate is caused by loss of its characteristic ductal volume and biochemically it is linked with changes in zinc levels in prostate cancer (63). The polyamines peak is a marker of healthy prostate tissue (64). Increased spermine has been associated with well-differentiated, nonproliferative cells. Because spermine is also a secretory product in the prostate like citrate, its level would be expected to decrease if ductal volume were reduced (i.e., if tissue morphology changed because of tumor) (64). Recently, Shukla-Dave et al. (64) showed that a significantly higher percentage of benign (as compared to malignant) voxels had higher polyamine than choline peaks (p < 0.001).
achieved by zinc-induced inhibition of m-aconitase (a Krebs cycle enzyme) (63). The reduction of citrate is caused by loss of its characteristic ductal volume and biochemically it is linked with changes in zinc levels in prostate cancer (63). The polyamines peak is a marker of healthy prostate tissue (64). Increased spermine has been associated with well-differentiated, nonproliferative cells. Because spermine is also a secretory product in the prostate like citrate, its level would be expected to decrease if ductal volume were reduced (i.e., if tissue morphology changed because of tumor) (64). Recently, Shukla-Dave et al. (64) showed that a significantly higher percentage of benign (as compared to malignant) voxels had higher polyamine than choline peaks (p < 0.001).
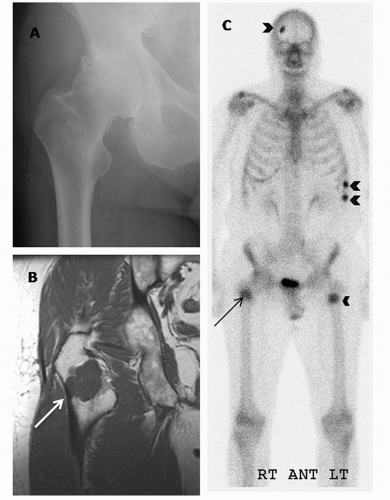 FIGURE 10.8. Right femoral metastasis is not clearly visualized on plain x-ray (A) but is well shown (long arrows) on coronal T1-weighted MRI (B) and bone scintigram (C). Multiple bone metastases involving the left femur, left ribs, and skull are also present on the bone scintigram (short arrows). |
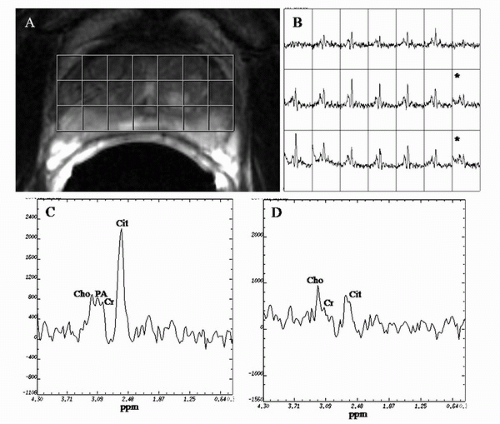 FIGURE 10.9. MRI/MRSI data from a 61-year-old patient presenting with a PSA level of 5.9 ng/mL, biopsy Gleason score 6, and clinical stage T1c prostate cancer. (A) Transverse T2-weighted MR image on which MRSI grid is overlaid; (B) corresponding MRSI spectral grid with voxels suspicious for cancer marked by asterisks; (C) spectrum from healthy PZ tissue showing creatine (Cr), high citrate (Cit) and equal choline (Cho), and polyamines (PA); (D) spectrum from PZ tissue suspicious for cancer showing Cr, elevated Cho, reduced Cit, and undetectable PA. |
Traditionally, prostate MRSI voxels have been designated as suspicious for cancer based on the (choline + creatine)/citrate ratio as defined in the literature (63,67). However, Shukla-Dave et al. (64) demonstrated the feasibility of incorporating the (choline + creatine)/citrate ratio ([Cho + Cr]/Cit) and polyamine information into a statistically based voxel classification procedure for detecting prostate cancer. The use of this classification procedure resulted in high specificity (91%) for prostate cancer detection in the training set (24 patients with 584 MRSI voxels) (64).
Related posts:

Stay updated, free articles. Join our Telegram channel

Full access? Get Clinical Tree


