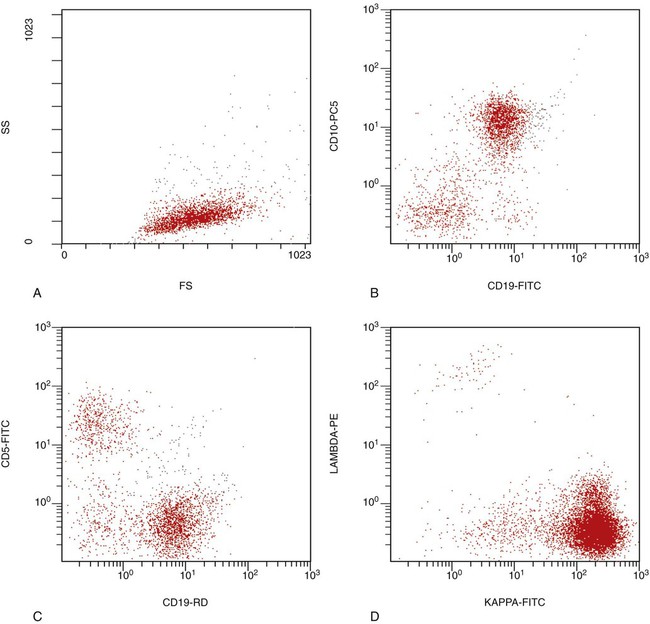
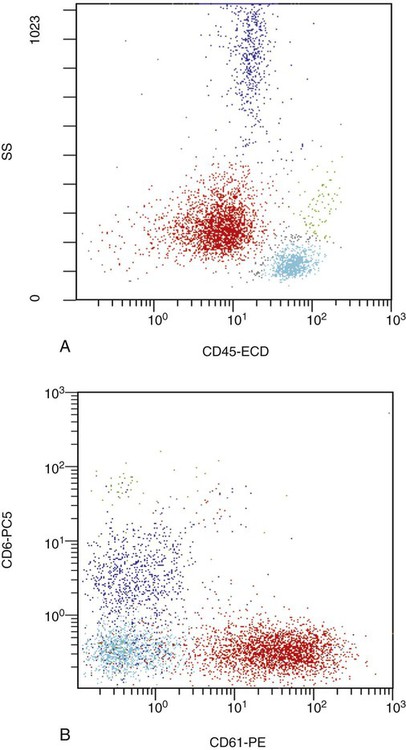
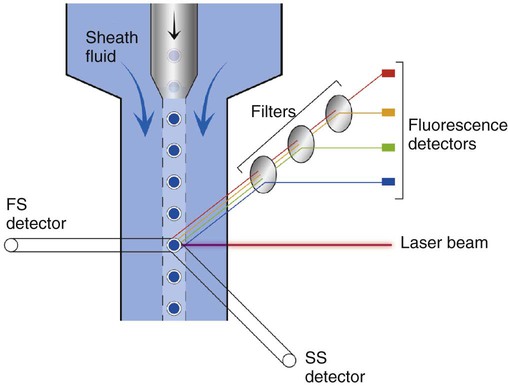
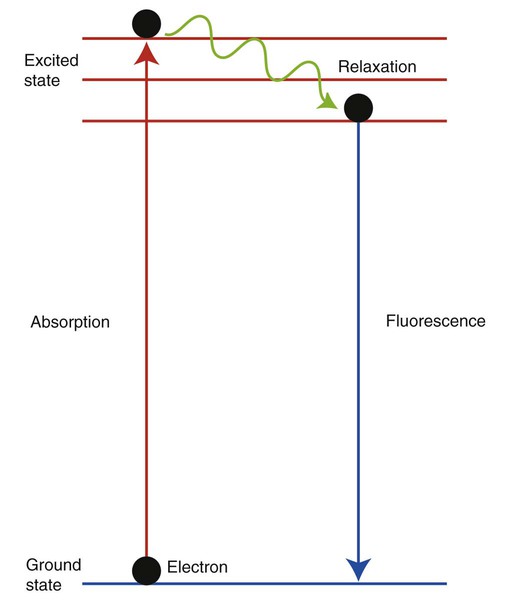
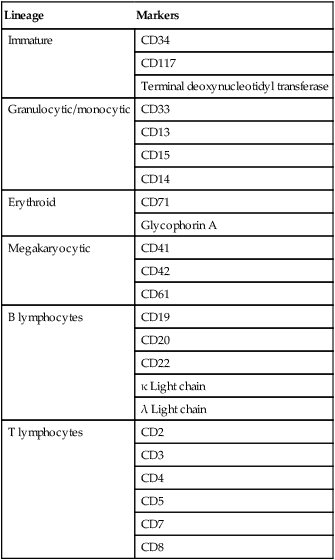
After completion of this chapter, the reader will be able to: 1. Describe the technique of flow cytometry, including specimen selection and preparation, instrumentation, data collection, and antibody panel design. 2. Discuss the pattern recognition approach to analysis of flow cytometric data for diagnosis and follow-up of hematologic malignancies. 3. Identify basic cell populations defined by flow cytometric parameters. 4. Recognize the key immunophenotypic features of normal bone marrow, peripheral blood, and lymph node tissue, and specimens from patients with acute leukemia or lymphoma. 5. Discuss novel applications of flow cytometry beyond the immunophenotyping of hematologic malignancies. A 58-year-old man had a 5-month history of extensive right cervical lymphadenopathy and night sweats. His complete blood count (CBC) results were within normal limits. Physical examination showed additional bilateral axillary lymphadenopathy. The cervical lymph node was excised. Histologic examination revealed nodular architecture with predominantly medium-sized lymphoid cells with irregular nuclear outlines. Flow cytometric data are presented in Figure 33-1. A 3-year-old girl was brought to the physician because of fatigue and fevers. The CBC revealed a WBC count of 3 × 10⁹/L, Hb level of 8.3 g/dL, and platelet count of 32 × 109/L. Review of the peripheral blood film showed rare undifferentiated blasts with occasional cytoplasmic blebs. No granules or Auer rods were identified. Bone marrow examination showed a marked increase in blasts (79%) and decreased background trilineage hematopoiesis. Flow cytometric analysis was performed. In addition to the markers shown in Figure 33-2, the population of interest was positive for CD34, CD33, CD41, and HLA-DR. 1. What abnormal features are observed on the CD45/SS scattergram? 2. What is the most likely diagnosis considering the constellation of markers expressed by the predominant population? Flow cytometry was originally designed to measure physical properties of cells based on their ability to deflect light. Over the years, it has evolved to include detection of fluorescent signals emitted by dyes bound directly to specific molecules or attached to proteins through monoclonal antibodies. The development of monoclonal antibodies is the most significant factor contributing to today’s broad application of flow cytometry. Although the term flow cytometry implies the measurement of a cell, this technique is applied successfully to the study of other particles, including chromosomes, microorganisms, and proteins. The main advantage of flow cytometry over other techniques is its ability to analyze rapidly multiple parameters in a large number of cells. When one adds the capability of identifying and quantifying rare-event cells in a heterogeneous cell population, the value of flow cytometry to clinical hematology becomes obvious. Currently, this technique not only is applied to the analysis of cell lineage in acute leukemia or the detection of clonality in lymphoid populations but also makes it possible to discern abnormal populations in chronic myeloid neoplasms, quantitate minimal residual disease, and monitor immunodeficiency states. Immunophenotypes that originally were used to supplement morphologic classification frequently correlate with specific cytogenetic or molecular abnormalities. According to a classification of hematopoietic neoplasms recommended by the World Health Organization,1 one no longer can rely solely on morphology for diagnosis of hematologic malignancies. The optimal diagnostic algorithm integrates morphologic, immunophenotypic, and genotypic information. This approach emphasizes the central role that flow cytometry plays in the hematopathology laboratory. Flow cytometric analysis is particularly useful in diagnosing hematologic malignancies. The specimens most commonly analyzed are bone marrow, peripheral blood, and lymphoid tissues. In addition, immunophenotyping is often performed on body cavity fluids and solid tissues when they are suspected to harbor a hematologic malignancy.2 To obtain a pure population of nucleated cells, red blood cells (RBCs) are lysed before staining. The analytical process depends on the cellularity and viability of the specimen; both are routinely assessed before a sample is stained. Cell count can be obtained using automated cell counters or flow cytometry. Trypan blue exclusion, a manual staining method, or flow cytometry of a specimen stained with propidium iodide or 7-amino actinomycin, is used to test viability. A cytocentrifuge slide (see Chapter 17) is prepared for the morphologic inspection of the cell suspension. As soon as these steps are completed, the sample is stained with a cocktail of fluorochrome-conjugated monoclonal antibodies. The analysis of intracytoplasmic markers requires an additional fixation and permeabilization step to allow antibodies to pass through the cell membrane. A predetermined panel of antibodies may be used to detect membrane-bound and intracellular markers. Simultaneous analysis of multiple markers, known as multicolor or multiparameter flow cytometry, has numerous advantages. It facilitates visualization of antigen expression and maturation patterns, which are often disturbed in hematopoietic malignancies. In addition, regardless of the complexity of the specimen, analysis can be accomplished using a few tubes and with a lower total number of cells, which saves reagents, time, and data storage. There is no consensus on the standardized panel of antibodies to be used in routine flow cytometric evaluation. The U.S.-Canadian Consensus Project in Leukemia/Lymphoma Immunophenotyping recommends the comprehensive approach with multiple markers for myeloid and lymphoid lineage.3 Selected markers commonly analyzed by flow cytometry are presented in Table 33-1. TABLE 33-1 Lineage-Associated Markers Commonly Analyzed in Routine Flow Cytometry The most significant discovery that led to the advancement of flow cytometry and its subsequent widespread application in clinical practice was the development of monoclonal antibodies.4 In the original hybridoma experiments, lymphocytes with predetermined antibody specificity were co-cultured with a myeloma cell line to form immortalized hybrid cells producing specific monoclonal antibodies. For this discovery, which not only fueled the development of flow cytometry but also had innumerable research and, more recently, clinical applications, Köhler and Milstein received a Nobel Prize in 1984. Over the years, numerous antibodies were produced and tested for their lineage specificity. Categorization of these antibodies and associated antigens is accomplished through workshops on human leukocyte differentiation antigens that have been held regularly since 1982. These workshops provide a forum for reporting new antigens and antibodies and define a cluster of antibodies recognizing the same antigen, called cluster of differentiation (CD) (Table 33-2; see also Table 33-1). Consecutive numbers are assigned to each new reported antigen. The Ninth International Conference on Human Leukocyte Differentiation Antigens brought to over 350 the total number of antigens characterized.5 TABLE 33-2 Hematolymphoid Antigens Commonly Used in Clinical Flow Cytometry Monoclonal antibodies have various applications, including immunohistochemistry, immunofluorescence, and Western blot. These methods study cellular proteins in fixed tissues or in cellular extracts; however, they do not provide the ability to examine antigens in their native state and cannot decipher composite cell populations with a complex antigen makeup. In contrast, flow cytometry can define antigen expression on numerous viable cells. Currently, 17 antigens can be detected simultaneously on an individual cell.6 This is accomplished by the conjugation of monoclonal antibodies to a variety of fluorochromes that can be detected directly by a flow cytometer. In a flow cytometer, particles are suspended in fluid and pass one by one in front of a light source. As particles are illuminated, they emit fluorescent signals registered by detectors. These results are later converted to digital output and analyzed using flow cytometry software. The flow cytometer consists of fluidics, a light source (laser), a detection system, and a computer. A brief discussion of these basic components is presented. To be analyzed individually, cells must pass separately, one by one, through the illumination and detection system of the flow cytometer. This passage is accomplished by injecting the cell suspension into a stream of sheath fluid. This technique, called hydrodynamic focusing, creates a central core of individually aligned cells surrounded by a sheath fluid (Figure 33-3). The central alignment is essential for consistent illumination of the cells as they pass before the laser light source. After the absorption of laser light, the electrons of fluorochromes are raised from the ground state to a higher energy state (Figure 33-4). The return to the original ground level is accompanied by the loss of energy, emitted as light of a specific wavelength. The flow cytometer is equipped with several photodetectors, each specific for light of a unique color (wavelength). The fluorescence from an individual cell is partitioned into its different wavelengths through a series of filters (dichroic mirrors) and directed to the corresponding photodetector. Fluorescent signals derived from different fluorochromes attached to particular antibodies are registered separately.
Flow Cytometric Analysis in Hematologic Disorders
Case Studies
Case 1
Case 2
Specimen Processing
Lineage
Markers
Immature
CD34
CD117
Terminal deoxynucleotidyl transferase
Granulocytic/monocytic
CD33
CD13
CD15
CD14
Erythroid
CD71
Glycophorin A
Megakaryocytic
CD41
CD42
CD61
B lymphocytes
CD19
CD20
CD22
κ Light chain
λ Light chain
T lymphocytes
CD2
CD3
CD4
CD5
CD7
CD8
Flow Cytometry: Principle and Instrumentation
Cluster of Differentiation
Function
Cellular Expression
CD1a
T-cell development
Precursor T cells
CD2
T-cell activation
Precursor and mature T cells, NK cells
CD3
Antigen recognition
Precursor and mature T cells
CD4
Co-receptor for HLA class II
Precursor T cells, helper T cells, monocytes
CD5
T-cell signaling
Precursor and mature T cells, subset of B cells
CD7
T-cell activation
Precursor and mature T cells, NK cells
CD8
Co-receptor for HLA class I
Precursor T cells, suppressor/cytotoxic T cells, subset of NK cells
CD10
B-cell regulation
Precursor B cells, germinal center B cells, granulocytes
CD11b
Cell adhesion
Granulocytic and monocytic lineage, NK cells
CD13
Unknown
Granulocytic and monocytic lineage
CD14
Monocyte activation
Mature monocytes
CD15
Ligand for selectins
Granulocytic and monocytic lineage
CD16
Low-affinity IgG Fc receptor
Granulocytic and monocytic lineage, NK cells
CD18
Cell adhesion and signaling
Granulocytic and monocytic lineage
CD19
B-cell activation
Precursor and mature B cells
CD20
B-cell activation
Precursor and mature B cells
CD22
B-cell activation and adhesion
Precursor and mature B cells
CD31
Cell adhesion
Megakaryocytes, platelets, leukocytes
CD33
Cell proliferation and survival
Granulocytic and monocytic lineage
CD34
Cell adhesion
Hematopoietic stem cells
CD36
Cell adhesion
Megakaryocytes, platelets, erythroid precursors, monocytes
CD38
Cell activation and proliferation
Hematopoietic cells, including activated lymphocytes and plasma cells
CD41
Cell adhesion
Megakaryocytes, platelets
CD42b
Receptor for von Willebrand factor
Megakaryocytes, platelets
CD45
T- and B-cell receptor activation
Hematopoietic cells
CD56
Cell adhesion
NK cells, subset of T cells
CD61
Cell adhesion
Megakaryocytes, platelets
CD62P
Homing
Platelets
CD63
Cell development, activation, growth and motility
Platelets
CD64
High-affinity IgG Fc receptor
Granulocytic and monocytic lineage
CD71
Iron uptake
High density on erythroid precursors, low to intermediate density on other proliferating cells
CD79a
B-cell receptor signal transduction
Precursor and mature B cells
CD117
Stem cell factor receptor
Hematopoietic stem cells, mast cells
Oncohema Key
Fastest Oncology & Hematology Insight Engine