Epidemiology of Late Complications of Diabetes: A Basis for the Development and Evaluation of Preventive Programs
Andrzej S. Krolewski
James H. Warram
This chapter reviews the descriptive epidemiology of late complications of diabetes mellitus in the eyes, kidneys, and heart and examines their occurrence in relation to diabetes duration and other risk factors, particularly the level of hyperglycemia. Our intent is to emphasize the findings that are relevant to generating etiologic hypotheses or to developing interventions against these outcomes. To describe their occurrence, we use the indices that were defined in Chapter 20 of this volume: the incidence rate, cumulative risk, and prevalence. For illustrating the natural history of late diabetic complications, we frequently use data from cohort studies carried out in the patient population of the Joslin Clinic. A less selective review of the epidemiology of late diabetic complications can be found in Chapter 35 of the previous edition of Joslin’s Diabetes Mellitus (1). We first review data for patients with type 1 diabetes and then discuss their similarities and differences to the data for type 2 diabetes.
MEASURE OF DIABETES EXPOSURE
Although conventional hypoglycemic therapies prevent acute metabolic complications in patients with diabetes, they do not restore metabolic homeostasis (2,3). The result of this imperfect treatment is a novel milieu that includes various combinations of metabolic, hormonal, and physiologic alterations. These include hyperinsulinemia, hyperglycemia, hyperlipidemia, abnormalities in blood flow, and the formation of glycation products (2,3,4,5), all of which constitute diabetes exposure. As a consequence of this exposure, diverse functional and morphologic alterations develop that lead to severe complications affecting the eyes, kidneys, and heart. Despite intensive research, it is not known which components of this collective exposure are responsible for particular complications. Various hypotheses have been proposed, ranging from global hypotheses that invoke a single mechanism and a single component of diabetes exposure as responsible for
all complications, to separate hypotheses for each complication that invoke interactions of diabetes exposures with genetic susceptibility and environmental factors (4,5,6,7,8,9).
all complications, to separate hypotheses for each complication that invoke interactions of diabetes exposures with genetic susceptibility and environmental factors (4,5,6,7,8,9).
For the purpose of epidemiologic studies, diabetes exposure can be characterized by the level of hyperglycemia or the level of glycosylated hemoglobin (HbA1c). The distribution of the intensity of diabetes exposure as estimated from glycosylated hemoglobin levels ranges widely. For example, in the population of patients who visited the Joslin Clinic in 1999/2000, the distribution of HbA1c levels ranged from 5% to 16% (6% is the upper limit of normal values in the nondiabetic population). The distribution of values varied slightly according to age (Table 47.1). Patients age 20 years and older had slightly lower values than younger patients. The medians for measurements repeated approximately a year later in this same population remained unchanged, and patients tended to maintain their position within the distribution. The majority of those with a high HbA1c level at the first visit in 1999/2000 had a similar value at the second visit 6 to 18 months later. This “tracking” of the level of diabetes control is a notable feature of patients with diabetes (10,11). During follow-up of participants in the Diabetes Control and Complications Trial (DCCT), patients formerly in the intensive treatment group worsened their glycemia within a year so that their distribution of glycosylated hemoglobin A1c (HbA1c) converged with that for the conventionally treated group (12). Interestingly, it became similar to the distribution for patients of the Joslin Clinic (Table 47.1).
TABLE 47.1. Values of Glycosylated Hemoglobin A1c in the Population of the Joslin Clinic according to Age in 1999 | |||||||||||||||||||||||||||||||||||||||||||||||||||||||||||||||||
|---|---|---|---|---|---|---|---|---|---|---|---|---|---|---|---|---|---|---|---|---|---|---|---|---|---|---|---|---|---|---|---|---|---|---|---|---|---|---|---|---|---|---|---|---|---|---|---|---|---|---|---|---|---|---|---|---|---|---|---|---|---|---|---|---|---|
| |||||||||||||||||||||||||||||||||||||||||||||||||||||||||||||||||
EPIDEMIOLOGY OF DIABETIC RETINOPATHY
Cumulative Risk of Retinopathy According to Duration of Diabetes
The most frequent late complication of type 1 diabetes is retinopathy. Following the onset of type 1 diabetes, there is a lag period of about 3 to 4 years before the first cases of nonproliferative retinopathy appear (13,14,15). The risk then increases exponentially (13,14,15). For example, during the 5th year of diabetes, nonproliferative retinopathy develops in 1 of 100 patients, whereas in the 14th year, it develops in 11 of 100 patients who have escaped it up to that time (14). By the 15th year of type 1 diabetes, the cumulative risk of nonproliferative retinopathy approaches 100% (Fig. 47.1). Despite its apparent inevitability, the onset of nonproliferative retinopathy can be postponed significantly by improved glycemic control, as was demonstrated by the DCCT (15).
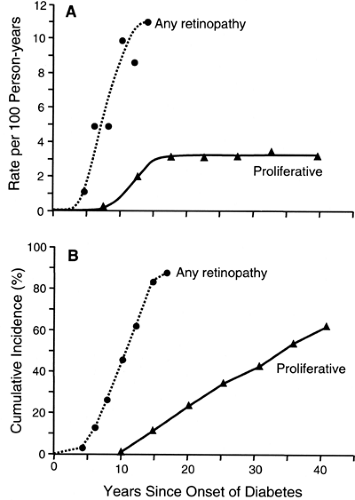 Figure 47.1. Incidence rate and cumulative risk of background and proliferative retinopathy, according to the duration of type 1 diabetes. A: The incidence rate of background retinopathy (estimated from Klein et al.) and proliferative retinopathy (adapted from Krolewski et al.), according to the duration of type 1 diabetes. B: The cumulative risk of background retinopathy measured by its prevalence (adapted from Klein et al.) and the risk of proliferative retinopathy measured as the cumulative incidence (adapted from Krolewski et al.), according to duration of type 1 diabetes. (Adapted from Klein R, Klein BEK, Moss SE, et al. The Wisconsin Epidemiologic Study of Diabetic Retinopathy. II. Prevalence and risk of diabetic retinopathy when age at diagnosis is less than 30 years. Arch Ophthalmol 1984;102:520–526; and copyright © 1986 American Diabetes Association. Krolewski AS, Warram JH, Rand LI, et al. Risk of proliferative diabetic retinopathy in juvenile-onset type I diabetes: a 40-yr follow-up study. Diabetes Care 1986;9:443–452. Adapted with permission from the American Diabetes Association.) |
Once patients have developed nonproliferative retinal lesions, they are vulnerable to the development of proliferative retinopathy, the principal cause of blindness in diabetes. The first cases of this advanced stage of diabetic retinopathy appear after 10 years of diabetes and then continue to occur at a constant incidence rate of about 3 per 100 per year regardless of the duration of type 1 diabetes. This constant incidence rate of proliferative retinopathy yields, after 40 years of type 1 diabetes, a cumulative risk of 62% (16), a value supported by several studies (17,18,19). The absence of a decline in the incidence rate of proliferative retinopathy after most of the population has been affected suggests that almost all patients with type 1 diabetes are susceptible to this complication, just as they are to
nonproliferative retinopathy. However, the contrast between the cumulative risk curve for the onset of retinopathy (exponential) as compared with its progression to proliferative retinopathy (constant) is evidence that the mechanisms underlying these two processes must be different.
nonproliferative retinopathy. However, the contrast between the cumulative risk curve for the onset of retinopathy (exponential) as compared with its progression to proliferative retinopathy (constant) is evidence that the mechanisms underlying these two processes must be different.
Diabetes Exposure and Risk of Retinopathy
Because nonproliferative retinopathy is extremely rare in persons without diabetes but is almost universal in patients with type 1 diabetes, one can infer that this complication is an outcome of diabetes exposure. Many observational studies (20,21,22,23,24,25) and clinical trials (15,26,27,28) have demonstrated a relationship between hyperglycemia and the development of various stages of diabetic retinopathy. However, only the results of the DCCT have provided enough data for the evaluation of the dose-response relationship between hyperglycemia and the development of nonproliferative retinopathy and its progression to proliferative retinopathy (15,28).
It appears that high levels of hyperglycemia have an impact on both the onset and progression of retinopathy, whereas low levels have only a moderate impact (15,28). As shown in Figure 47.2, the incidence of retinopathy (development or progression) in the group assigned to intensive diabetes treatment fluctuated around 2.0 per 100 person-years in the nine deciles of the HbA1c distribution below 8.5% and rose to 7.0 per 100 person-years in the highest decile. The results of other follow-up studies showed a similar threshold effect of hyperglycemia on the development and progression of diabetic retinopathy (29,30).
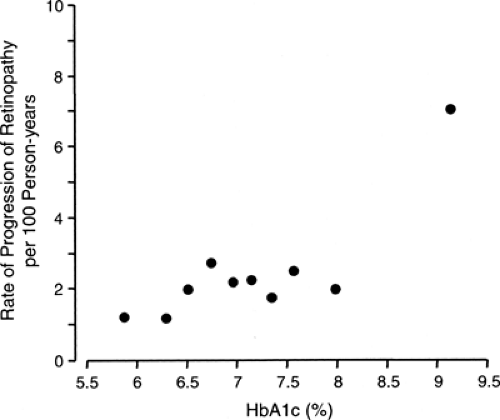 Figure 47.2. Incidence rate of sustained progression of retinopathy according to deciles of the distribution of mean glycosylated hemoglobin A1c(HbA1c) values during the Diabetes Control and Complication Trial (DCCT). Figure was adapted from Figure 5 in DCCT study (15) by omitting the fitted dose-response curve (linear in the log-log scale) to emphasize the pattern of the data. For the first nine deciles, the incidence rate was well approximated by a straight line whose slope coefficient was not statistically significantly different from zero, whereas the incidence rate for the 10th decile lies significantly above the line. This pattern is consistent with a threshold value for HbA1c between the 9th and 10th deciles. (Adapted in 2004 with permission from The Diabetes Control and Complications Trial Research Group. The effect of intensive treatment of diabetes on the development and progression of long-term complications in insulin-dependent diabetes mellitus. N Engl J Med 1993;329:977–986. Copyright © 1993 Massachusetts Medical Society. All rights reserved.) |
Other Risk Factors for Retinopathy
Several other factors in addition to diabetes exposure are associated with the development of the several stages of diabetic retinopathy. This includes systemic variables such as hypertension, nephropathy, and cardiovascular autonomic neuropathy, as well as ocular variables such as elevated intraocular pressure and myopia.
We reported one of the first prospective observations of the relation between elevated blood pressure and risk of retinopathy (21,31). In that study, the risk of progression of nonproliferative retinopathy was particularly increased in patients with type 1 diabetes with diastolic blood pressure above 70 mm Hg. Subsequently, the Wisconsin Epidemiologic Study of Diabetic Retinopathy showed that systolic blood pressure was associated with the onset of nonproliferative retinopathy, whereas diastolic blood pressure was associated with its progression (32). Data from a clinical trial of sorbinil also demonstrated that elevated diastolic blood pressure was an important risk factor for progression but not for onset of nonproliferative retinopathy (25). Because there has been no clinical trial of blood pressure reduction in the prevention of diabetic retinopathy, the implication of these associations is not clear. Elevated systemic blood pressure may be a risk factor for diabetic retinopathy or just an indicator of microvascular dysfunction, which is also manifested as microalbuminuria and leads to complications in the kidneys as well as the eyes (33).
Previously, it had been supposed that the development of diabetic retinopathy and other late diabetic complications was due to one underlying pathologic process in small vessels (4,5,6,8,9). However, clinical and epidemiologic studies during the last two decades have provided evidence that the causes of these complications may be different (8,34,35). Still the occurrence of one complication may be a risk factor or indicator for the development of others. For example, the onset of diabetic nephropathy is almost always followed by the development of proliferative retinopathy (16,36,37). Certain aspects of overt proteinuria and declining renal function may accelerate progression of diabetic retinopathy to proliferative retinopathy (36,37). Also, a relation between the presence of autonomic cardiovascular neuropathy and the development of proliferative retinopathy was found. This association, which we demonstrated first in a case-control study (37) and subsequently in a follow-up study (38), was independent of the level of glycemic control, elevated blood pressure, or presence of diabetic nephropathy. However, it is still not clear whether cardiovascular autonomic neuropathy is a risk factor or risk indicator for the development of proliferative diabetic retinopathy.
In addition to these systemic factors, ocular factors seem to modulate the risk of onset and progression of diabetic retinopathy. Higher ocular perfusion pressure predicted the onset and progression of diabetic retinopathy in the Wisconsin Epidemiologic Study (39). This agrees with an earlier study of patients with asymmetric diabetic retinopathy in which lower retinal artery pressure due to carotid occlusion was found on the same side as the eye with less severe retinopathy (40). In a multivariate analysis of the Wisconsin data to adjust for other covariates, the effect of high ocular perfusion pressure remained significant only for the onset of retinopathy. Myopia is another ocular factor that modulates the development of proliferative retinopathy. We were the first to find its protective effect against severe retinopathy in a case-control study of determinants of proliferative diabetic retinopathy in type 1 diabetes (41). This finding has since been confirmed in a prospective study, and several explanations for it have been proposed (39); however, empiric data to distinguish among them are lacking.
Comparison of Risk of Retinopathy in Type 1 and Type 2 Diabetes
The Wisconsin Epidemiologic Study of Diabetic Retinopathy provides the best data to compare the natural history of diabetic retinopathy in whites with type 1 and type 2 diabetes. During a 10-year follow-up, the incidence of retinopathy, the progression of retinopathy, and the development of proliferative retinopathy were highest in patients with type 1 diabetes, intermediate in insulin-treated patients with type 2 diabetes, and lowest in patients with type 2 diabetes treated with oral agents or diet (42). Most of these differences could be accounted for by different levels of glycemic control in the three study groups (24). The contribution of other risk factors to different risk of diabetic retinopathy in type 1 and type 2 diabetes has been less well studied.
Can the Occurrence of Diabetic Retinopathy Be Changed?
As was demonstrated in several clinical trials conducted in highly selected populations of patients with diabetes, improved glycemic control can significantly delay the development of nonproliferative retinopathy and postpone its progression to proliferative retinopathy (15,28,43,44). However, there is less evidence that the natural history of diabetic retinopathy can be changed in the general population of patients with diabetes.
The cumulative risk of proliferative diabetic retinopathy in type 1 diabetes had not changed during the 30-year period between 1950 and 1980. In the cohort study that we conducted at the Joslin Clinic, the cumulative risk of proliferative diabetic retinopathy after 20 years of diabetes was identical in patients who had type 1 diabetes diagnosed in 1939, 1949, and 1959 despite significant differences in the care of these cohorts (16). Similar findings have been reported from Sweden; a secular decline in risk was found for nephropathy but not for proliferative retinopathy over the period from 1970 to 1990 (45,46). Furthermore, in the Wisconsin Epidemiologic Study of Diabetic Retinopathy, no significant change in the incidence of retinopathy was found during 10 years of follow-up despite significant improvement in glycemic control in the study group (24).
EPIDEMIOLOGY OF DIABETIC NEPHROPATHY
Cumulative Risk of Diabetic Nephropathy According to Duration of Diabetes
The natural history of diabetic nephropathy has generally been viewed as a progressive path from normoalbuminuria to end-stage renal disease (ESRD) through intermediate stages marked by microalbuminuria and then overt proteinuria (47). The cumulative risk (estimated by prevalence data) of these stages in patients of the Joslin Clinic with type 1 diabetes according to duration of diabetes is summarized in Figure 47.3. Because several studies have demonstrated that the duration of diabetes before puberty does not contribute to the risk of diabetic nephropathy (48,49), the data in Figure 47.3 are presented according to postpubertal duration of type 1 diabetes. To develop more advanced nephropathy, patients must develop microalbuminuria first, so the top curve can be considered as the cumulative risk of microalbuminuria according to duration of diabetes. Similarly, the height of the intermediate curve indicates the cumulative risk of persistent proteinuria, and the height of the lowest curve traces the cumulative risk of ESRD according to duration of type 1 diabetes.
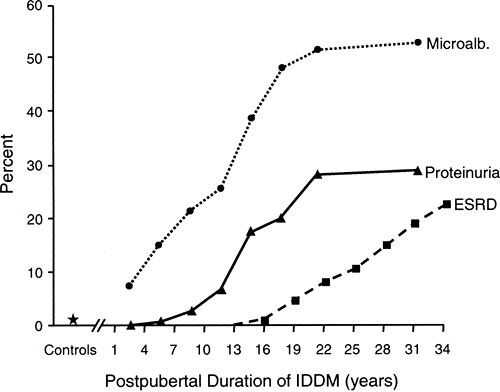 Figure 47.3. Prevalence of stages of diabetic nephropathy according to postpubertal duration of type 1 diabetes (IDDM). Data for microalbuminuria and proteinuria were adapted from Warram et al. Data on end-stage renal disease (ESRD) were adapted from Krolewski et al. For patients with type 1 diabetes diagnosed before age 10 years, postpubertal duration was counted from age 11 years. (Adapted from Warram JH, Gearin G, Laffel LMB, et al. Effect of duration of type 1 diabetes on prevalence of stages of diabetic nephropathy defined by urinary albumin/creatinine ratio. J Am Soc Nephrol 1996;7:930–937; and Krolewski M, Eggers PW, Warram JH. Magnitude of end-stage renal disease in type I diabetes: a 35-year follow-up study. Kidney Int 1996;50: 2041–2046 with permission from Blackwell Publishing.) |
The cumulative risk of persistent microalbuminuria with duration of diabetes rises at a variable rate (Fig. 47.3). A particularly notable feature is the very early appearance of significant numbers of patients with microalbuminuria: 8% of patients with type 1 diabetes for only 1 to 3 years, a value ten times the 0.8% prevalence among persons without diabetes (50,51). A similarly high prevalence of microalbuminuria in patients with type 1 diabetes with a short duration of diabetes was found in another study (52). The prevalence of microalbuminuria leveled off after 10 years of diabetes (prevalence 20%) and then resumed its steep climb in the second decade, reaching a new
plateau at around 58% prevalence after 30 years of postpubertal duration of diabetes.
plateau at around 58% prevalence after 30 years of postpubertal duration of diabetes.
The cumulative risks of overt proteinuria and microalbuminuria within the same population can be compared in Figure 47.3. The first cases of overt proteinuria occurred after 5 years’ duration, after which the prevalence of overt proteinuria increased abruptly and then leveled off after 21 years, a feature similar to the pattern for microalbuminuria. Following another increase, the prevalence of overt proteinuria leveled off again at around 30% by 30 years of postpubertal duration of type 1 diabetes. This agrees with a 33% cumulative risk of persistent proteinuria after 30 years of diabetes in two previous cohort studies (48,53). The contrast between the 30% cumulative risk for persistent proteinuria and the 58% cumulative risk for microalbuminuria after 30 years of type 1 diabetes has important implications. It indicates that many patients with microalbuminuria, approximately half, may never progress to overt proteinuria (54).
Patients with overt proteinuria are at risk of renal function loss and the development of ESRD. Recently, we determined the cumulative risk of ESRD in a cohort of patients who had type 1 diabetes diagnosed at the Joslin Clinic in 1959 and were followed until 1994 (55). The first case of ESRD occurred after 15 years of postpubertal duration of type 1 diabetes, and the cumulative risk of ESRD reached 22% after 35 years (Fig. 47.3). Because most individuals with persistent proteinuria progress to ESRD (48), one would expect the cumulative risk of ESRD to reach about 30% if followed another 10 years.
Diabetes Exposure and Risk of Diabetic Nephropathy
The level of glycemia seems to be the strongest factor influencing the onset of microalbuminuria. This has been demonstrated in several observational studies (22,51,56,57,58,59) as well as in clinical trials (15,26,27,60). In our recent 4-year follow-up study involving 943 normoalbuminuric patients with type 1 diabetes, we determined the shape of the dose-response relationship between the intensity of hyperglycemia and the onset of microalbuminuria (59) and found a nonlinear effect of hyperglycemia on the development of microalbuminuria (Fig. 47.4A). Below HbA1c values of 8.0%, the incidence of microalbuminuria varied little. In contrast, above an HbA1c value of 8.0%, the incidence of microalbuminuria rose steeply with increasing values of HbA1c. For comparison, the risk of microalbuminuria increased almost 20-fold faster between HbA1cvalues of 8% and 10% than between values of 6% and 8%. This nonlinear pattern of the relationship between level of HbA1c and the risk of microalbuminuria was independent of other risk factors. This finding is consistent with our previous data from a case-control study (51). Evidence of a threshold effect in the relation between HbA1c and microalbuminuria has been reported in DCCT publications, although it was not interpreted as such by the authors (60,61).
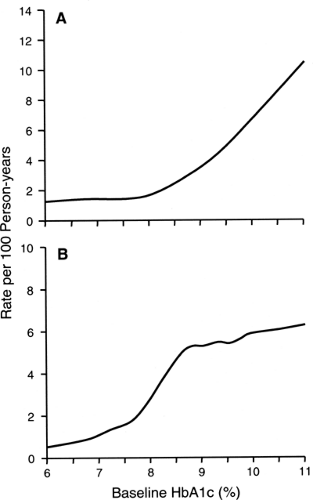 Figure 47.4. A: Dose-response relationship between level of glycosylated hemoglobin A1c (HbA1c) and incidence of microalbuminuria in patients with normoalbuminuria and type 1 diabetes (adapted from Scott et al.) B: Dose-response relationship between level of HbA1c and progression to proteinuria in patients with microalbuminuria and type 1 diabetes (adapted from Warram et al.) (Adapted from Scott LJ, Warram JH, Hanna LS, et al. A nonlinear effect of hyperglycemia and current cigarette smoking are major determinants of the onset of microalbuminuria in type 1 diabetes. Diabetes 2001;50:2842–2849; and Warram JH, Scott LJ, Hanna LS, et al. Progression of microalbuminuria to proteinuria in type 1 diabetes, Diabetes 2000;49: 94–100. Copyright © 2001 and 2000, respectively, American Diabetes Association. Adapted with permission from the American Diabetes Association.) |
In our recent 4-year follow-up study involving 312 patients with microalbuminuria, we examined the relationship between hyperglycemia and progression of microalbuminuria to overt proteinuria (62). The incidence rate of progression increased rapidly between HbA1c values of 6% and 8.5% and then leveled off at higher values, being similar for HbA1c values of 8.5% and 12% (Fig. 47.4B). Since this pattern differs from the dose-response relationship between HbA1c and the onset of microalbuminuria, one may hypothesize that different mechanisms are responsible for the onset of microalbuminuria and its progression to proteinuria.
Using incidence rates from Figure 47.4B, we estimated the cumulative risk of progression of microalbuminuria to overt proteinuria over a 10-year follow-up period according to quartiles of HbA1c (<8.5%, 8.5% to 9.6%, 9.7% to 10.6%, and >10.7%). The risks were 12%, 46%, 42%, and 50%, respectively. These estimates are similar to data reported by several recent studies (63,64,65,66), but are only one half the values reported in the initial publications in the 1980s on the risk associated with microalbuminuria (67,68,69). This discrepancy is more likely due to an overestimation of the risk of progression in the early studies than to a decline in the risk during the last 15 years.
Confirmation in a clinical trial that good glycemic control reduces the risk of progression of microalbuminuria to overt proteinuria is lacking. Only one very small clinical trial found that improved glycemic control reduced the risk of progression of microalbuminuria to overt proteinuria (70), whereas a larger clinical trial found no relationship between improvement of diabetes control and slower progression of microalbuminuria to overt proteinuria (71).
Related posts:


Stay updated, free articles. Join our Telegram channel

Full access? Get Clinical Tree


