Abstract
Multiple studies provide estimates of the risk of breast cancer for women. Dense breasts on mammography or having first-degree relatives with breast cancer are associated with at least a 2-fold increase in risk of breast cancer. Prior breast biopsy, second-degree relatives with breast cancer, or heterogeneously dense breasts are associated with a 1.5- to 2.0-fold increased risk; current use of oral contraceptives, nulliparity, and age 30 years or older at first birth are associated with a 1.0- to 1.5-fold increased risk. Predisposing genetic mutations, lobular carcinoma in situ, and atypical hyperplasia increase risk markedly. These risk factors, as well as environmental exposures, are reviewed in this chapter. Identification of these risk factors may be useful for personalized management of breast cancer risk.
Keywords
breast cancer, epidemiology, risk factors, benign breast disease, environmental factors
Descriptive Epidemiology
In 2015, an estimated 231,840 new cases of invasive breast cancer were diagnosed among US women, as well as an estimated 60,290 additional cases of in situ breast cancer. In the same year, approximately 40,290 US women died from breast cancer. Only lung cancer accounts for more cancer deaths in women. Breast cancer is the most commonly diagnosed cancer in women in the United States and accounts for 26% of all female cancers (excluding nonmelanoma skin cancers and in situ cancers). Incidence rates of in situ breast cancer rose rapidly during the 1980s and 1990s, largely because of increases in mammography screening. The increase in incidence was greater in women 50 years of age and older than in those younger than 50. Incidence rates of in situ breast cancer have stabilized since 2000 among women 50 and older and since 2007 among younger women. These trends likely reflect trends in mammography screening rates, which peaked in 2000 and then stabilized at a slightly lower rate after 2005.
Some of the historic increase in breast cancer incidence reflects changes in reproductive patterns, such as delayed childbearing and having fewer children, which are known risk factors for breast cancer. Between 2002 and 2003, breast cancer rates dropped sharply (nearly 7%), likely due to the decreased use of menopausal hormones after the publication of clinical trial results that found higher risk of breast cancer and heart disease among users. The decline in incidence occurred primarily in white women, in women 50 years of age and older, and for estrogen receptor (ER)-positive disease. From 2004 to 2012, overall breast cancer incidence rates remained stable.
Overall breast cancer death rates decreased 36% from 1989 to 2012, after slowly increasing (0.4% per year) since 1975. The decrease occurred in both younger and older women, although since 2007, the breast cancer death rate has been level among women younger than 50 years. The decline in breast cancer mortality has been attributed to both improvements in breast cancer treatment and early detection. However, not all segments of the population have benefited equally from these advances. A striking divergence in long-term breast cancer mortality trends between black and white women began in the early 1980s. This mortality difference reflects a combination of factors, including differences in stage at diagnosis, obesity and comorbidities, and tumor characteristics, as well as access, adherence, and response to treatment. The racial disparity may also reflect differences in mammography screening. As treatment for breast cancers has improved, the racial disparity has widened; by 2012 breast cancer death rates were 42% higher in black than white women.
Differences in Subtypes of Breast Cancer by Race, Ethnicity and Geography
Since 2010, Surveillance, Epidemiology, and End Results (SEER) registries have collected human epidermal growth factor 2 (HER2) receptor status for breast cancer cases. Breast cancer subtypes can be defined by both hormone receptor (HR) (ER and progesterone receptor [PR]) and HER2 status. Age-specific incidence rates by subtype differ for non-Hispanic (NH) white, NH black, NH Asian Pacific Islander (API), and Hispanic women. Hormone receptor and HER2 status distributions can be summarized by age, race/ethnicity, county-level poverty, registry, stage, Bloom-Richardson grade, tumor size, and nodal status. Among patients with known hormone receptor and HER2 status, 73% were found to be HR-positive/HER2-negative, 12% were triple-negative (HR-negative/HER2-negative), 10% were HR-positive /HER2-positive, and nearly 5% were HR-negative/HER2-positive; 12% had unknown HR/HER2 status. NH white women had the highest incidence rate of the HR-positive/HER2-negative subtype, and NH black women had the highest rate of the triple-negative subtype.
Compared with women with the HR-positive/HER2-negative subtype, triple-negative patients were more likely to be NH black and Hispanic; HR-positive/HER2-positive patients were more likely to be NH API; and HR-negative/HER2-positive patients were more likely to be NH black, NH API, and Hispanic. Patients with triple-negative, HR-positive/HER2-positive, and HR-negative/HER2-positive breast cancer were 10% to 30% less likely to be diagnosed at older ages compared with HR-positive/HER2-negative patients and 6-fold to 20-fold more likely to present with high-grade disease. These data demonstrate that there are differences in breast cancer subtypes presenting at diagnosis among different racial/ethnic groups. The reasons for these differences are not yet well defined.
Breast cancer is the most frequently diagnosed cancer worldwide and is the leading cause of cancer death in females. Breast cancer incidence rates are highest in North America, Australia/New Zealand, and in Western and northern Europe, and lowest in Asia and sub-Saharan Africa. Despite the decreases in incidence rates in North America, breast cancer incidence has been increasing in other parts of the world, such as Asia and Africa. These international differences are thought to be related to societal changes occurring during industrialization (e.g., changes in fat intake, body weight, age at menarche, and/or lactation, and reproductive patterns such as fewer pregnancies and later age at first birth). Within the United States, breast cancer risk varies substantially among regions. Geographic cluster regions with high breast cancer incidence rates have been identified, such as Cape Cod, Massachusetts; Long Island, New York; and Marin County, California. These clusters are most likely due to regional differences in established breast cancer risk factors.
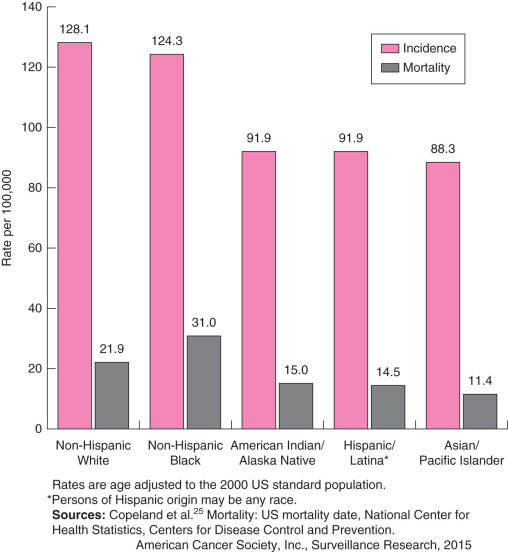
As shown in Fig. 15.1 , breast cancer incidence and mortality are higher in African American and Caucasian women than in women of other races and ethnicities. Incidence data have been available for white and black women since 1975 and for women of other races and ethnicities since 1992. During 2008–2012 (the most recent 5 years of data available), overall breast cancer incidence rates increased among NH black (0.4% per year) and API (1.5% per year) women, but were stable among NH whites, Hispanics, or American Indians/Alaska Natives. Notably, breast cancer rates for whites and blacks converged in 2012, reflecting the slow but steady increase in incidence in black women and relatively stable rates in white women.
Breast cancer incidence in Asians and Pacific Islanders was 93.5 per 100,000 in 1999 to 2003. Incidence in Hispanics was 87.1 per 100,000 for the same period. Incidence in Native Americans and Alaskan Natives was 74.4 per 100,000 for 1999 to 2002. Mortality rates (per 100,000) for these time periods were 12.6 for Asians and Pacific Islanders, 16.3 for Hispanics, and 13.8 for Native Americans and Alaskan Natives.
A variety of genetic, environmental, and behavioral factors may explain the racial differences in the incidence of breast cancer. Migration studies have documented that the risk of breast cancer is higher in Asian American women born in the West compared with those born in Asia (relative risk [RR] 1.6; 95% confidence interval [CI] 1.2–2.1). Risk of breast cancer is further increased with the number of the woman’s grandparents born in the West (RR 1.89; 95% CI 1.2–3 for a woman with one to two grandparents born in the West compared with a woman with all grandparents born in Asia). Risk is decreased in more recent immigrants (RR 0.32; 95% CI 0.18–0.57 for 2–4 years lived in the west) compared with those who have lived in the west their entire lives. Incidence rates for breast cancer in Asian Americans in Los Angeles County rose substantially between 1993 and 1997. Most notably, the incidence rate for breast cancer in Japanese American women in this country is rapidly approaching that of NH white women. Factors such as acculturation and adoption of a Western diet may at least partially explain these recent trends.
Traditional Risk Factors for Breast Cancer
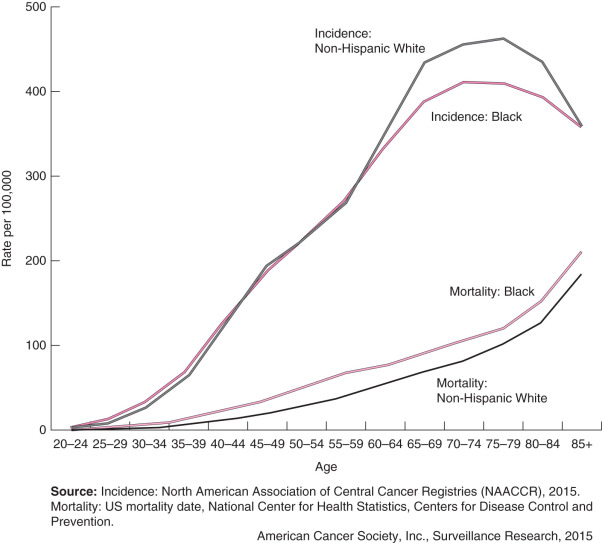
Well-established epidemiologic risk factors for breast cancer are listed in Table 15.1 . Age is the most important risk factor for breast cancer, and breast cancer incidence rises sharply with age ( Fig. 15.2 ). The SEER database of the National Cancer Institute allows calculation of the probability of a woman developing breast cancer in the United States through specific attained ages :
- •
Birth to age 49—1.9 (1 in 53 women)
- •
Age 50 to 69—2.3 (1 in 44 women)
- •
Age 60 to 69—3.5 (1 in 29 women)
- •
Age 70 and older—6.7 (1 in 15 women)
- •
Birth to death—12.3 (1 in 8 women)
| Risk Factor | Comparison Category | Risk Category | Relative Risk | Prevalence (%) | Population Attributable Risk a |
|---|---|---|---|---|---|
| Age at menarche | 16 years | <12 years | 1.3 | 16 | 0.05 |
| Age at menopause | 45–54 years | >55 years | 1.5 | 6 | 0.03 |
| Age when first child born alive | Before 20 years | Nulliparous or >30 years | 1.9 | 21 | 0.16 |
| Benign breast disease | No biopsy or fine-needle aspiration | Any benign disease | 1.5 | 15 | 0.07 |
| Proliferative disease | 2 | 4 | 0.04 | ||
| Atypical hyperplasia | 4 | 1 | 0.03 | ||
| Family history of breast cancer | No first-degree relative affected | Mother affected | 1.7 | 8 | 0.05 |
| Two first-degree relatives affected | 5 | 4 | 0.14 |
a Population attributable risk = [prevalence × (relative risk – 1)] / {[prevalence × (relative risk – 1)] + 1}.
Benign Breast Disease
Benign breast lesions can be classified according to their histologic appearance ( Table 15.2 ). Benign breast lesions thought to impart no increased risk of breast cancer include adenosis, duct ectasia, simple fibroadenoma, fibrosis, mastitis, mild hyperplasia, cysts, and metaplasia of the apocrine or squamous types. Lesions associated with a slight increase in the subsequent risk of developing invasive breast cancer include complex fibroadenoma, moderate or florid hyperplasia with or without atypia, sclerosing adenosis, and papilloma. Atypical hyperplasia of the ductal or lobular type is associated with a 4- to 5-fold increased risk of developing subsequent breast cancer, and this risk increases to approximately 10-fold if it is also associated with a family history of invasive breast cancer in a first-degree relative.
| Benign Lesion | Description | ASSOCIATED RELATIVE RISK OF BREAST CANCER a | |
|---|---|---|---|
| With Family History of Breast Cancer | Without Family History of Breast Cancer | ||
| Proliferative Disease Without Atypia | 2.4–2.7 | 1.7–1.9 | |
| Moderate and florid ductal hyperplasia of the usual type | Most common type of hyperplasia; cells do not have the cytologic appearance of lobular or apocrine-like lesions; florid lesions have a proliferation of cells that fill more than 70% of the involved space | ||
| Additional lesions | Intraductal papilloma, radial scar, sclerosing adenosis, apocrine metaplasia | ||
| Atypical Hyperplasia | 11 | 4.2–4.3 | |
| Atypical ductal hyperplasia | Has features similar to ductal carcinoma in situ but lacks the complete criteria for that diagnosis | ||
| Atypical lobular hyperplasia | Defined by changes that are similar to lobular carcinoma in situ but lack the complete criteria for that diagnosis | ||
| Nonproliferative | Normal, cysts, duct, ectasia, mild hyperplasia, fibroadenoma | 1.2–2.6 | 0.9–1 |
a Relative risks represent the range of values reported in the published literature.
Lobular Carcinoma in Situ and Atypical Hyperplasia
Women with a history of lobular carcinoma in situ (LCIS) experience an annual risk of invasive breast cancer of approximately 1.5% per year. Women with atypical hyperplasia also experience an increased risk of subsequent invasive breast cancer. There are two types of atypical hyperplasia, as classified on the basis of microscopic appearance: atypical ductal hyperplasia and atypical lobular hyperplasia; atypical hyperplasia confers a relative risk of 4.0. These risk statistics have been recognized for decades, and the absolute risk among women with atypical hyperplasia has been shown to approach 30% at 25 years of follow-up. The risk of developing invasive disease after a diagnosis of atypia is inversely related to the age at diagnosis, directly related to the number of atypical foci seen on the biopsy, and appears to be slightly higher with atypical lobular compared with atypical ductal hyperplasia. Atypical hyperplasia is found in approximately 10% of biopsies with benign findings. In studies with long-term follow-up, atypical hyperplasia has been shown to confer high relative risks for future breast cancer with an absolute risk of approximately 1% to 2% per year of developing invasive breast cancer.
Family History
Women who have a first-degree relative with a history of breast cancer are at increased risk of the disease themselves. The risk conferred by family history is further increased if the affected family member was diagnosed with the disease at a younger age. For example, a woman with a first-degree relative diagnosed with breast cancer before 40 years of age has a 5.7 times increased risk (99% CI 2.7–11.8) of being diagnosed with breast cancer before she is 40 compared with a woman of the same age but without a family history of breast cancer. Two genes, BRCA1 and BRCA2, have been implicated in familial breast cancer but account for less than 10% of all breast cancer cases. BRCA mutations are most strongly related to breast cancer occurring in younger, premenopausal women. In women diagnosed with breast cancer before age 40, 9% have a BRCA mutation, compared with only 2% of women of any age diagnosed with breast cancer.
Reproductive Factors
Early age at menarche and late age at menopause have been found to increase the risk of breast cancer, whereas premenopausal oophorectomy reduces risk. Late age at first and possibly last full-term pregnancy have been associated with an elevated risk; risk decreases with increasing parity. Breastfeeding has also been shown to decrease the risk of breast cancer. The timing of the initiation of the carcinogenic process is an important consideration when studying the effect of reproductive factors on the risk of breast cancer. Risk of premenopausal breast cancer decreases about 9% (95% CI 7%–11%) for each 1-year increase in age at menarche, whereas risk of postmenopausal breast cancer decreases only about 4% (95% CI 2%–5%) for each 1-year increase in age at menarche. Risk of breast cancer increases with increasing age at first full-term pregnancy by 5% (95% CI 5%–6%) per year for breast cancer diagnosed before menopause and by 3% (95% CI 2%–4%) for cancers diagnosed after menopause. Each full-term pregnancy is associated with a 3% (95% CI 1%–6%) reduction in risk of breast cancer diagnosed before menopause, whereas the reduction was 12% (95% CI 10%–14%) for breast cancer diagnosed later.
Other Risk Factors for Breast Cancer
The field of breast cancer epidemiology is a vibrant and evolving body of knowledge. Newer and more recently identified risk factors ( Table 15.3 ) and protective factors ( Table 15.4 ) for breast cancer are discussed individually in the sections that follow.
| Characteristic | Menopausal Status a | Comparison Category | Risk Category | Estimate of Effect b |
|---|---|---|---|---|
| Genetic Factors | ||||
| BRCA1 mutation c | Both | No mutation | Mutation present in gene | Lifetime risk 50%–73% by age 50 and 65%–87% by age 70 |
| BRCA2 mutation c | Both | No mutation | Mutation present in gene | Lifetime risk 59% by age 50 and 82% by age 70 |
| Hormonal Factors | ||||
| Oral contraceptive use d | Both | Never users | Current users | RR 1.24 (1.15–1.33) |
| Both | Never users | ≥10 years since last use | RR 1.01 (0.96–1.05) | |
| Postmenopausal hormone therapy use | Postmenopausal e | Nonusers with an intact uterus | Estrogen + progestin users | HR 1.24 (1.01–1.54) |
| Postmenopausal f | Nonusers with a hysterectomy | Estrogen users | HR 0.80 (0.62–1.04) | |
| Circulating estradiol | Premenopausal g | Lowest quartile | Highest quartile | OR 1 (0.66–1.52) |
| Postmenopausal h | Lowest quintile | Highest quintile | RR 2 (1.47–2.71) | |
| Circulating estrone | Premenopausal g | Lowest quartile | Highest quartile | OR 1.16 (1.48–3.22) |
| Postmenopausal h | Lowest quintile | Highest quintile | RR 2.19 (1.48–3.22) | |
| Testosterone | Premenopausal e | <1.13 nmol/L | ≥2.04 nmol/L | OR 1.73 (1.16–2.57) |
| Postmenopausal g | Lowest quintile | Highest quintile | RR 2.22 (1.59–3.10) | |
| Other Biological Factors | ||||
| Mammographic breast density i | Both | <5% density | ≥75% density | RR 4.64 (3.64–5.91) |
| Bone mineral density j | Postmenopausal | Lowest quartile at each of three skeletal sites | Highest quartile at each of three skeletal sites | RR 2.70 (1.4–5.3) |
| Circulating IGF-I k | Premenopausal | 25th percentile | 75th percentile | OR 1.93 (1.38–2.69) |
| Postmenopausal | 25th percentile | 75th percentile | OR 0.95 (0.62–1.33) | |
| Circulating IGFBP-III k | Premenopausal | 25th percentile | 75th percentile | OR 1.96 (1.28–2.99) |
| Postmenopausal | 25th percentile | 75th percentile | OR 0.97 (0.53–1.77) | |
| Behavioral Factors | ||||
| Body mass index l | Postmenopausal | <21 kg/m 2 | ≥33 kg/m 2 | RR 1.27 (1.03–1.55) |
| Height l | Premenopausal | <1.60 cm | ≥1.75 cm | RR 1.42 (0.95–2.12) |
| Postmenopausal | <1.60 cm | ≥1.75 cm | RR 1.28 (0.94–1.76) | |
| Weight l | Postmenopausal | <60 kg | ≥80 kg | RR 1.25 (1.02–1.52) |
| Alcohol use l | Both | Never drinkers | >12 g/day | RR 1.10 (1.06–1.14) |
| Smoking m | Postmenopausal | Never smokers | Smoked >40 years | RR 1.5 (1.2–1.9) |
| Night work n | Both | No nightshift work | Any nightshift work | OR 1.48 (1.36–1.61) |
| Dietary Factors | ||||
| Total fat intake o | Both | Lowest quantile | Highest quantile | OR 1.13 (1.03–1.25) |
| Saturated fat intake o | Both | Lowest quantile | Highest quantile | OR 1.19 (1.06–1.35) |
| Meat intake m | Both | Lowest quantile | Highest quantile | OR 1.17 (1.06–1.29) |
| Environmental Factors | ||||
| Ionizing radiation p | Both | 0–0.09 Gy exposure to Nagasaki or Hiroshima atomic bomb | ≥0.50 Gy exposure to Nagasaki or Hiroshima atomic bomb | RR varies depending on age at exposure: RR = 9 at age 0–4; RR = 2 at age 35–39 |
a Refers to menopausal status at the time of diagnosis.
b Data in parentheses are 95% confidence intervals.
c From National Cancer Institute.
d From Collaborative Group on Hormonal Factors in Breast Cancer.
i From McCormack and dos Santos Silva.
k From Renehan AG, Zwahlen M, Minder C, et al, Insulin-like growth factor (IGF)-I, IGF binding protein-3, and cancer risk: Systematic review and metaregression analysis. Lancet. 2004;363:1346-1353.
m From Cui Y, Miller AB, Rohan TE, Cigarette smoking and breast cancer risk: update of a prospective cohort study. Breast Cancer Res Treat. 2006;100:293-299.
o From Boyd NF, Stone J, Vogt KN, et al, Dietary fat and breast cancer risk revisited: a meta-analysis of the published literature. Br J Cancer. 2003;89:1672-1685.
| Characteristic | Menopausal Status a | Reference Group | Comparison Group | Estimate of Effect b |
|---|---|---|---|---|
| Reproductive Factors | ||||
| Parity c | Both | Nulliparous | Two live births | OR 0.91 (0.85–0.97) |
| Breastfeeding d | Premenopausal | Never breastfed | Ever breastfed | RR 0.78 (0.66–0.91) |
| Postmenopausal | Never breastfed | Ever breastfed | RR 1.04 (0.95–1.14) | |
| Preeclampsia e | Both | No preeclampsia | Ever preeclampsia | ORs range from 0.27 (0.08–0.63) to 0.81 (0.61–1.1) |
| Hormonal Factors | ||||
| Estrogen metabolite ratio f | Premenopausal | 2:16-OH ratio ≤1.80 | 2:16-OH ratio ≥3.29 | OR 0.55 (0.23–1.32) |
| Postmenopausal | 2:16-OH ratio ≤1.77 | 2.16-OH ratio ≥3.66 | OR 1.31 (0.53–3.18) | |
| Circulating sex hormone–binding globulin | Premenopausal n | <31.1 nmol/L | ≥64.5 nmol/L | OR 0.95 (0.65–1.40) |
| Postmenopausal o | Lowest quintile | Highest quintile | RR 0.66 (0.43–1) | |
| Other Biological Factors | ||||
| Bone fracture g | Postmenopausal | No fracture in past 5 years | History of fracture | OR 0.80 (0.68–0.94) |
| Behavioral Factors | ||||
| Body mass index h | Premenopausal | <21 kg/m 2 | ≥33 kg/m 2 | RR 0.58 (0.34–1) |
| Physical activity | Premenopausal p | <9.1 hours/week | ≥20.8 hours/week | OR 0.74 (0.52–1.05) |
| Postmenopausal q | Not currently active | >40 metabolic-equivalent hours per week | RR 0.78 (0.62–1) | |
| NSAID use i | Both | Nonusers | Current user of any NSAID | OR 0.80 (0.73–0.87) |
| Dietary Factors | ||||
| Calcium (dietary) j | Postmenopausal | ≤500 mg/day | >1250 mg/day | RR 0.80 (0.67–0.95) |
| Folate (total) k | Both | 150–299 µg/day | ≥600 µg/day | RR 0.93 (0.83–1.03) |
| Soy l | Premenopausal | Low intake | High intake | OR 0.70 (0.58–0.85) |
| Postmenopausal | Low intake | High intake | OR 0.77 (0.60–0.98) | |
| Vitamin D (total) m | Postmenopausal | <400 IU | ≥800 IU | RR 0.89 (0.77–1.03) |
Related posts:
 Anatomy of the Breast, Axilla, Chest Wall, and Related Metastatic Sites
 Therapeutic Strategies for Breast Cancer
 Breast Conservation Therapy for Invasive Breast Cancer
 Radiation Complications and Their Management
 Immunologic Approaches to Breast Cancer Therapy
 Delayed Diagnosis of Symptomatic Breast Cancer
Stay updated, free articles. Join our Telegram channel

Full access? Get Clinical Tree


