Abstract
The National Institutes of Health (NIH) defines a clinical trial as “a research study in which one or more human subjects are prospectively assigned to one or more interventions (which may include placebo or other control) to evaluate the effects of those interventions on health-related biomedical or behavioral outcomes.” There are generally two types of clinical trials: controlled and uncontrolled. Uncontrolled trials lack a comparison group. Controlled trials involve two or more study treatments, at least one of which is a control treatment (i.e., a standard against which new treatments are measured). The main focus of this chapter is interventional trials including cohort (cross-sectional, case-control) studies and interventional trials, that is, intervention(s) applied to the study population synonymous with clinical trials in most texts. Dr. William Thomas Beaver was the clinical pharmacologist at Georgetown University who is credited with drafting the initial regulations defining “adequate and controlled” clinical studies. “Clinical trials are systematic experiments performed on human beings for the purpose of assessing the safety and/or efficacy of treatments or care procedures. The function of the controlled clinical trial is not the ‘discovery’ of a new drug or therapy. Discoveries are made in the animal laboratory, by chance observation, or at the bedside by an astute clinician. The function of the formal controlled clinical trial is to separate the relative handful of discoveries which prove to be true advances in therapy from a legion of false leads and unverifiable clinical impressions, and to delineate in a scientific way the extent of and the limitations which attend the effectiveness of drugs.”
Keywords
cohort, case-control, cross-sectional, interventional, phase I, II, III, and IV, crossover clinical trials, sample size determination, power analysis
The National Institutes of Health (NIH) defines a clinical trial as “a research study in which one or more human subjects are prospectively assigned to one or more interventions (which may include placebo or other control) to evaluate the effects of those interventions on health-related biomedical or behavioral outcomes.” One of the more common ways to describe clinical trials is controlled and uncontrolled. Uncontrolled trials lack a comparison group. Controlled trials involve two or more study treatments, at least one of which is a control treatment (i.e., a standard against which new treatments are measured). The main focus of this chapter is noninterventional trials including cohort (cross-sectional, case-control) studies, and interventional trials, that is, intervention(s) applied to the study population synonymous with clinical trials in most texts. Dr. William Thomas Beaver was the clinical pharmacologist at Georgetown University who is credited with drafting the initial regulations defining “adequate and controlled” clinical studies. According to Dr. Beaver, clinical trials are systematic experiments performed on human beings for the purpose of assessing the safety and/or efficacy of treatments or care procedures, and the “function of the controlled clinical trial is not the ‘discovery’ of a new drug or therapy. Discoveries are made in the animal laboratory, by chance observation, or at the bedside by an acute clinician. The function of the formal controlled clinical trial is to separate the relative handful of discoveries which prove to be true advances in therapy from a legion of false leads and unverifiable clinical impressions, and to delineate in a scientific way the extent of and the limitations which attend the effectiveness of drugs.”
Evolving Ethics and Regulation of Clinical Trials in the United States
605 bce —The earliest written account of a clinical trial is from the book of Daniel in the Bible. Daniel did not want to defile himself with King Nebuchadnezzar’s food and wine. He asked the head official to give him and three others only vegetables and water for 10 days, while other servants ate the royal food. At the end of 10 days, the four men eating only vegetables and water appeared healthier and better nourished than those that indulged in the king’s food.
1667—Diary of Samuel Pepys (member of the English parliament) documented the first mention of a paid research subject.
1747—James Lind offered earliest attempt of a planned controlled trial for the “treatment” of scurvy. Twelve men with similar cases of scurvy ate a common diet and slept together. Six pairs, however, were given different “treatments” for their malady (cider; elixir; seawater; horseradish, mustard, and garlic; vinegar; oranges and lemons). The two who received the oranges and lemons recovered.
1863—Gull and Sutton demonstrated the use of placebo treatment in the natural variability of the course of disease and the possibility of spontaneous cure.
1880—Introduction of “patent” medicines, which represented 72% of drug sales by 1900, including drugs that were both inert and active.
1906—Pure Food and Drug Act provided a legal definition for the terms adulterated and misbranded as they related to both food and drug products and prescribed legal penalties for each offense. The act also prohibited “false and misleading” statements on product labels. Efforts to prohibit false therapeutic claims on drug labels were defined both by the Supreme Court and the US Congress.
1937—A drug company developed a liquid preparation of sulfanilamide, used to treat strep infections. The product was not tested in animals or humans before marketing. The solvent used to suspend the active drug was diethylene glycol. The US Food and Drug Administration (FDA) was only empowered to act against the deadly product because it was misbranded—it contained no alcohol, whereas the term elixir implied that it did contain alcohol. More than 100 people who took the preparation were killed.
1938—Food, Drug, and Cosmetic Act was passed. This act required drug sponsors to submit safety data to FDA officials for evaluation before marketing. The act did not specify any particular testing method(s) but required that drugs be studied by “adequate tests by all methods reasonably applicable to show whether or not the drug is safe.” Under this law devices were equal to drugs.
1948—Nuremberg Code developed, outlining 10 basic statements for the protection of human participants in clinical trials. In particular, the code supported the concept of voluntary informed consent.
1962—Kefauver-Harris Drug Amendments. This law, heavily influenced by the 1950 thalidomide incident in Western Europe, required controlled trials that could support claims of efficacy. The law stated that a poorly designed trial not only wasted resources, but unnecessarily put patients at risk.
1964—Declaration of Helsinki outlined ethical codes for physicians and protection of participants in clinical trials all over the world.
1966—Drug Efficacy Study (DES) begun by the FDA. The study required review of all drugs that had been approved under the 1938 Food, Drug, and Cosmetic Act (1938–1962) on the basis of safety alone, this time looking for evidence of efficacy. The results of the study resulted in the removal of more than 1000 ineffective drugs and drug combinations from the marketplace.
1972—Robert Temple noted that as late as the 1960s and early 1970s, “You would be horrified [at the clinical trial data] submitted to the agency. There was often no protocol at all. There was almost never a statistical plan. Sequential analyses were virtually nonexistent. It was a very different world.”
1974—National Research Act resulted in the Belmont Report, which laid the foundation for clinical research conducted in the United States (respect for persons, beneficence, and justice). Passing of this act was prompted by the Tuskegee Syphilis Experiment.
1976—Medical Device Amendments Act redefined devices, making them more distinct from drugs. The law established a classification system as well as safety and efficacy requirements for medical devices. It also created new routes to market (premarket notification and premarket approval by the FDA) and Investigational Device Exemptions (IDEs). This act was prompted by the Dalkon Shield Disaster of 1971. Only minimal testing was done on the intrauterine device. The company was warned by scientists of serious design flaws and safety concerns with the device. Despite this warning, safety and efficacy claims were made, and contraindications were ignored and kept quiet. As a result, approximately 8000 injuries were reported, including sepsis, miscarriage, and death.
1987—Introduction of “Treatment IND (Investigational New Drug)” in response to the AIDS epidemic.
1990—Safe Medical Devices Act of 1990 included device tracking for high-risk devices (i.e., implants), required user facilities and manufacturers to report certain adverse events to the FDA, and gave the FDA authority to regulate combination products (drug/device, device/biologic, etc.). It also created incentives for development of orphan or humanitarian use devices (e.g., drugs/devices used to treat diseases or conditions affecting fewer than 4000 people in the United States per year).
1990–1992—Regulations approved by FDA established a “parallel track approval” process in which special categories of drugs would be expedited during the review process and a wider group of patients would have access to the drug than under normal procedures. These regulations gave the agency explicit authority to rely on surrogate markers (measure outcomes that are not clinically valuable by themselves but are thought to correspond with improved clinical outcomes). The FDA is cautious in accepting surrogates and usually requires continued postmarket study to verify and describe continued clinical benefits.
1990—International Conference on Harmonization (ICH) was assembled to help eliminate differences in drug development requirements for three global pharmaceutical markets: Europe, Japan, and the United States.
1997—Food and Drug Administration Modernization Act (FDAMA) recognized changes in the way the FDA would be operating in the 21st century (extended the Prescription Drug User Fee Act, required registration of selected trials in the ClinicalTrials.gov database, established risk-based regulation of medical devices, etc.). Today the FDA is responsible for protecting the public health by ensuring the safety, efficacy, and security of human and veterinary drugs, biological products, medical devices, our nation’s food supply, cosmetics, and products that emit radiation.
2002—Medical Device User Fee and Modernization Act (MDUFMA) authorized the FDA to collect monetary fees from companies or sponsors to support the review of certain types of applications. It also established inspections to be conducted by an accredited third-party under certain circumstances and established the Office of Combination Products established to oversee review of products falling under multiple jurisdictions within the FDA.
2007—FDA Amendments Act (FDAAA) and the rules for trial registration.
2016—Final Rule that clarifies and expands the regulatory requirements and procedures for submitting registration and summary results information of clinical trials on ClinicalTrials.gov .
Research Versus Clinical Care
Clinical care involves patients seeking diagnosis and treatment for a disease or condition. Research involves subjects who volunteer to participate in an experiment. Research is conducted to test the safety, effectiveness, dosing, or other use of investigational products. Research according to 45 CFR + See The Code
46.102(d)) is “a systematic investigation, including research development, testing, and evaluation, designed to develop or contribute to generalizable knowledge.” Research may be conducted using unapproved investigational products, approved products for a new indication or in a new population, or approved products in a comparative effectiveness trial. The state Medical Board is empowered to license physicians and other health care practitioners under state statute and to dictate the scope of practice through regulation. Licensure allows physicians to prescribe FDA-approved drugs, biologics, and devices, among other products, and to prescribe approved drugs in an “off-label” manner. Many state medical boards do not regulate research. The FDA does not regulate the practice of medicine. The FDA issues a Drug Label, which is the official description of a drug product and includes what it is used for, who should take it, side effects, instructions for use, and safety information for the patient (aka “package insert”). Drug approval takes into account the specific disease or condition (i.e., use), the specific population (e.g., age, gender), the dose and dosage form (formulation, combination drugs), warnings, and contraindications. Physicians may prescribe “off-label” any approved drug, biologic, or medical device. “Off-label use” is defined as the use of an approved drug in a manner that is not consistent with its label and is allowed when treatment-approved drugs have failed, with new drugs based on emerging evidence, and as treatment for orphan conditions. Responsibility falls on the practicing physician to use drugs in a responsible manner (subject to controls through the third party reimbursement and the potential for malpractice claims). However, unapproved drugs, biologics, and medical devices require an IND, IDE, or an exemption. Unlike drugs, devices that have not been cleared by the FDA are sometimes used in routine clinical care.What Is Not a Clinical Trial
Things that do not fall under the definition of clinical trials are routine clinical care, expanded access programs (emergency treatment, single-patient IND, treatment protocol), humanitarian use devices, observational studies and quality improvement studies (QA/QI). QA/QI studies (e.g., monitoring prescription errors in the pharmacy) may qualify for an exemption and may be published, despite not having institutional review board (IRB) review if it meets preceding criteria. (Example Source: answers.hhs.gov/ohrp/categories/1569 ; accessed January 22, 2013.)
Why Do Clinical Trials?
Clinical trials can be done for a number of reasons but are research performed on human subjects for the purpose of assessing the safety and/or effectiveness of an intervention. Does the new treatment work in humans? Is it better than what's now being used to treat a certain disease? Is it at least as good while perhaps causing fewer side effects? Or does it work in some people who are not helped by current treatments? Is the new treatment safe? The question to be answered is whether or not the benefits of the new treatment outweigh the possible risks. Assume that a new treatment has potential benefits in a population with a specific disease or condition. Any potential adverse effects resulting from the treatment may not be known. Without adequate and controlled clinical trials, these medicines may be used repeatedly in hundreds of locations before any significant adverse effect is identified and reported. More people will experience the negative effects of the drugs than would have if controlled trials had been conducted.
Designing Clinical Trials
Clinical trials can be observational trials, interventional trials, controlled, uncontrolled trials, or use historical controls, and involve human subjects as defined by 45 CFR 46.102(f) that is “a living individual about whom an investigator (whether professional or student) conducting research obtains: Data through intervention or interaction with the individual, or identifiable private information.” The regulatory burden on the investigator is directly proportional to the reason for the study. For example, if the researcher is simply trying to determine whether one surgery is better than another to improve patient outcome, then the burden for conducting the appropriate trial is much lower than if she or he wants to publish the data or than that of the pharmaceutical company that is trying to bring new drugs, biologics, or devices to market. In the later case, planning drug development programs, designing and conducting clinical trials, organizing and analyzing trial data, submitting clinical study reports (CSRs) to the FDA, and manufacturing and marketing products are all necessary tasks to achieve the overall objective.
Types of Clinical Trials
Clinical trials can be categorized by sponsorship (industry-sponsored clinical trials, cooperative group studies, investigator-initiated (investigator sponsor) trials, cooperative group with industry support, multisite federally funded (e.g., subawards), investigator-initiated with industry support), funding source, comparative versus noncomparative, multicenter versus single center, behavioral versus biomedical, preclinical, or purpose that is phase I (safety and efficacy), phase II (single-arm efficacy), phase III (randomized comparison), phase IV (postmarketing), or as a Registry. Clinical trials can be classified into an almost endless set of categories to suit the needs of a particular situation.
Cohort Trials
The purpose of a cohort study is to describe the occurrence of outcomes in a group for subjects over time to analyze associations between predictors and outcomes. Such studies can be prospective or retrospective.
Prospective Cohort Study
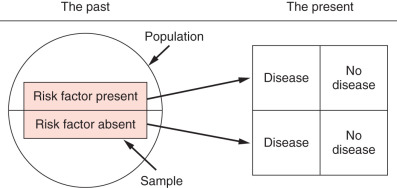
A prospective cohort study selects a sample from the population; measures the predictor variables (whether the risk factor is present or absent); and measures the outcome variables at some specified time in the future ( Fig. 27.1 ).

An example of a prospective cohort study would be an investigator who has access to a group of patients without known cancer and wants to examine the relationship between obesity and the development of breast cancer over time. The advantages of this type of study is that it is simple in design, can assess incidence, can measure variables accurately and prospectively, large sample sizes are possible, possible long periods of follow-up allow substantial statistical power, bias in measuring predictors is avoided, and the investigator is able to answer questions that cannot be answered otherwise. Disadvantages include that it is challenging to make causal inference; there can be a multitude of confounding variables (e.g., alcohol intake, BRCA incidence within the cohort), a change in predictor variables over time may alter risk for development of the outcome variables (e.g., weight loss or gain with individuals followed for risk of breast cancer with obesity), it is an expensive and inefficient way to study rare outcomes, and long periods of observation may be necessary (more efficient as outcomes become more common and immediate; e.g., measuring incidence of breast cancer in men vs. women).
Retrospective Cohort Study
In a retrospective cohort study ( Fig. 27.2 ), the investigator identifies a cohort that has been assembled in the past, collects predictor variables from existing data (i.e., measured in the past), and measures outcome variables in the present.
For example, suppose that a researcher wanted to describe the natural history of breast cancer and risk factors that lead to breast cancer death. First the researcher would identify a suitable cohort from the past (hospital records for all patients with breast cancer from 2000 to 2014 and identify all those who had breast cancer listed as their diagnosis). The next step would be to collect data about predictor variables in the past: review medical records of people with the diagnosis of breast cancer and disease-free or overall survival, and collect age, stage, treatment, family history, alcohol intake, obesity, and other factors. The researcher would then gather data on outcome—disease-free or overall survival as measured in the present but not prospectively.
The advantages of a retrospective cohort design is that it can be a very simple design, can have accurate measurement of outcome variables, the long period of follow-up and large sample size can provide substantial statistical power, and study time is often of shorter duration because predictor measurements have already been made and documented. In addition, such studies can be less costly and time-consuming than prospective cohort studies. Disadvantages of this study design are the limited control over sampling of the population; limited control over nature and quality of the predictor variables; retrospective data may have been collected using outmoded technology, poor technique, or other inadequate factors; the predictor measurements that are important or relevant may not have been recorded in the health record; and confounding variables and causality are difficult or impossible to prove (true of all observational studies).
Cross-Sectional Study Design
Cross-sectional studies are used to examine associations between variables. All data (i.e., variables) are collected at the same point in time. These are not longitudinal; there is no present, past, and future as in cohort studies. Labeling which variables are predictors and which are outcomes depends on the cause-and-effect hypothesis put forth by the investigator. The sample is represented by the top half of the circle in Fig. 27.3 and is drawn from the entire population represented by the circle. In a cross-sectional study, the desired sample is selected from the population, and then the variables are measured. Cross-sectional designs are similar to cohort studies except that the measurements are all made at about the same time.
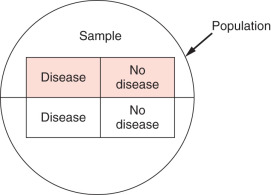
For example, suppose a group of researchers wants to know whether patients with pubertal obesity had a greater risk of breast cancer. First the researchers would select their sample from the population—for example, all women in a gynecology practice. They would then identify and measure the predictor and outcome variables (e.g., the predictor is having had childhood obesity, and the outcome is history of breast cancer). Note that there are many confounders that one may want to control for (e.g., age, family history). The researchers could then divide patients into quartiles based on body mass index at puberty and then determine whether they were more likely to get breast cancer depending on the quartile. The researchers assume that the sample is representative of the total population. They administer a questionnaire to gather information. The questionnaire is administered, and data for predictors and outcomes is gathered at the same time.
The advantages of this type of study is the immediacy (i.e., data can be collected quickly), no subjects are lost to follow-up, they tend to be inexpensive, and they can be included at the beginning of a cohort study (cross-sectional cohort design). However, it can be difficult to establish causal relationships from observational studies conducted at one point in time, and this design is impractical for rare diseases or conditions. Of note is that this type of study can measure prevalence (number of people with disease out of those at risk) but cannot measure incidence (prevalence over time).
Case-Control Study Design
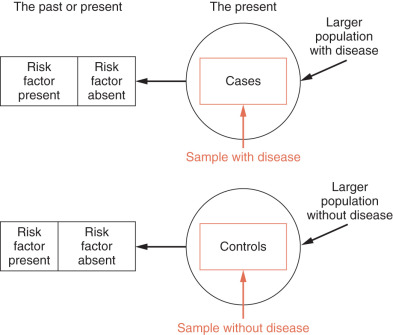
A case-control study is a retrospective study that identifies patients with and without a disease and looks back to identify the presence or absence of risk factors. In this type of study, the research selects a sample from a population with the disease or condition (cases), then selects a sample from the population at risk that is free of the disease (controls) and then measures predictor variables. It can also be used to look at outcomes (e.g., patients with or without lymphedema after axillary node dissection) ( Fig. 27.4 ).
The advantages of this type of study is that it may involve relatively few subjects; is inexpensive, of short duration, and useful to identify possible risk factors in rare diseases or conditions; may examine large numbers of predictor variables; is useful for generating hypotheses; and can provide an estimate of the strength of the association between predictor variables and the presence or absence of disease (odds ratio). However, case-control studies cannot yield estimates of incidence or prevalence of disease in a population (relatively low sample size); only one outcome variable can be studied; the sequence of events may not be clear; and they are susceptible to bias, including sampling bias, differential measurement bias, and recall bias (i.e., if you have a disease that is suspected of being caused by a drug, you may be more likely to recall exposure). Several strategies for controlling sampling bias that can be used are to select controls from the same hospital or clinic; matching of cases and controls; population-based samples (have become more common as registries have flourished); using more than one control group selected in different ways.
Interventional Trials
Interventional trials occur when a drug, device, or other treatment is applied to human subjects in a research setting. Interventional trials may be relatively simple uncontrolled trials or may involve more complicated designs, which may employ crossover techniques, masking, placebos, comparators, etc. Some of the more common types are discussed below.
Uncontrolled Trials
Uncontrolled trials are clinical studies in which an intervention is studied without the use of a control group. Common examples would be some phase I studies or phase II trials and pilot studies. Pilot studies are often performed to assess the feasibility of a larger trial, to test methods that will be used in a larger trial, or to generate a new hypothesis for further research. Studies may also be designed without a control group for ethical reasons. The advantages of such studies are that they provide justification for conducting a large-scale randomized controlled trial (i.e., preliminary data), they limit the number of subjects exposed to new drugs or treatments (e.g., no placebo), and it may not be ethically possible to have a control group (e.g., major surgery with anesthesia vs. no anesthesia). Disadvantages include that at the end of the study, it may not be certain that the treatment, rather than a random factor, was responsible for the outcome; the investigator cannot measure any placebo effect; such trials are susceptible to overinterpretation; and it is easy to introduce investigator bias (i.e., the desire of the investigator to see the new treatment work may lead to unconscious—or conscious—bias in selecting subjects).
Historical Controls
An uncontrolled trial may also make use of historical controls—that is, comparison of the results of a new study with results from previous reports (i.e., historical data). There are many potential confounders using this approach, such as differences in diagnostic methodology, ancillary treatments, or complications, for example. An investigator should consider this design only if there is no other way to compare outcomes.
Controlled Trials
Control implies the use of a randomization scheme (random assignment to one of two or more interventions or sequences of interventions) to reduce the risk of bias. In recent years, clinical trials have demonstrated the value of treatment for many diseases, including breast cancer. With the development of more detailed statistical theories and applications, experimental design and biostatistical analysis have become more important in evaluating the effectiveness of diagnostic techniques, as well as treatments. Several key components of well-performed clinical trials, such as trial design, randomization, sample size determination, interim monitoring, and evaluation of clinical effects, are highly dependent on successful application of biostatistics and an understanding of probabilities. Input from an experienced biostatistician is valuable and highly desirable during the design of the study.
For trials involving FDA-regulated products, the application of biostatistics is relevant throughout phase I, II, III, and IV clinical trials. Phase I trials introduce investigational drugs or devices to humans. The primary objectives of a phase I trial are to generate preliminary information on the biochemical properties of a drug, such as metabolism, pharmacokinetics, and bioavailability, and to determine a safe drug dose, dosing ranges, or schedule of administration. Phase I studies may also provide preliminary evidence of a drug's activity by means of a pharmacodynamic or biomarker response. The focus of the phase I trial is assessment of safety and dose selection; a phase I trial is usually a nonrandomized dose-escalation study with no more than 20 to 80 normal volunteers or patients with disease. For trials involving drugs with significant known toxicity, patients with the target disease or condition are usually used in phase I trials. For less toxic compounds (e.g., an antihypertensive drug), healthy adult volunteers are often used.
In oncology trials, one goal of phase I is usually to determine a safe and/or potentially effective dose to be used in phase II. For cytotoxic agents, the primary objective of the phase I trial is often to determine the maximum tolerated dose (MTD) for a new drug and to evaluate qualitative and quantitative toxicities. For noncytotoxic agents, the primary objective of the phase I trial is to identify the optimal biologically effective dose. For target or novel agents, the phase I trial is designed to determine the minimum effective blood concentration level of the agent or minimum expression level of a molecular target.
Phase II trials provide preliminary information on the efficacy of a drug and additional information on safety and dosing ranges. These trials may be designed to include a control or may use a single-arm design, enrolling 20 to 200 or more patients with disease. It is important that phase II studies provide data on the doses or interventions to be used in phase III, although this may not be as easy as it appears. For phase II oncology trials, tumor response rate is usually the primary end point. Time to progression also may serve as the primary end point, when the estimated median time to progression is relatively short for the study agent. In addition, an early stopping rule is common in phase II oncology trials to prevent the testing of ineffective drugs or agents in more patients.
The phase III trial is a full-scale treatment evaluation, with the primary goal of comparing efficacy of a new treatment with that of the standard regimen. Phase III trials are usually randomized controlled studies enrolling several hundred to several thousand patients with disease. For oncology phase III trials, overall survival is usually the primary end point; however, time to progression also may serve as the primary end point if the estimated median overall survival time is relatively long for the study agent. Two distinct treatment regimens might be compared, but often an add-on design is used in which standard therapy and standard therapy plus an investigational agent are compared. Other study designs are possible as well.
To look for uncommon long-term side effects, phase IV or postregistration trials may be conducted after regulatory approval of a new treatment or drug. Thus phase IV trials evaluate agents or drugs already available for physicians to prescribe, rather than new drugs still being developed. These trials can be designed as randomized studies, but they are usually prospective observational studies with thousands of patients.
Trial Design for Phase I Oncology Studies
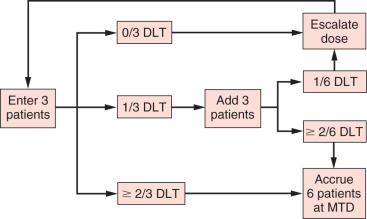
As mentioned in the previous section, the primary objective of the phase I oncology trial is usually to determine the MTD of a new cytotoxic drug or agent. The most common phase I oncology trial design is the 3 + 3 design ( Fig. 27.5 ). In this design, at least three patients are studied at each dose level and evaluated for toxicity. At any given dose level, three patients are accrued. If none of these patients experiences a dose-limiting toxicity (DLT), the dose is escalated. If one of these patients experiences a DLT, three additional patients are treated. If none of the additional patients develops a DLT, the dose is escalated; otherwise, escalation ceases. If at any time at least two patients (≥2 of 3 or ≥2 of 6) experience a DLT, the MTD has been exceeded. For a dose level at which a patient has a high probability of developing a DLT, the probability of escalation to a higher dose level should be low. As shown in Table 27.1 , if the dose level has a true DLT rate of 70%, the probability of escalating a certain dose is only 3%.
| True dose-limiting toxicity rate | 10% | 20% | 30% | 40% | 50% | 70% | 80% | 90% |
| Probability of escalating | 0.91 | 0.71 | 0.49 | 0.31 | 0.17 | 0.03 | 0.01 | 0.001 |
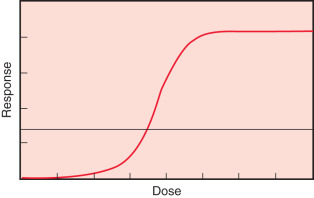
Another commonly used phase I oncology trial design is the continual reassessment method, introduced by O’Quigley, Pepe, and Fisher. Like the 3 + 3 design, the continual reassessment method is designed to determine MTD. This method can be described as a one-parameter Bayesian-based logit model ( Fig. 27.6 ), which describes the association between dose level (x-axis) and toxicity level (y-axis). The investigator picks a target toxicity level for the study agent, for example, 30%. Given this target toxicity, the investigator then selects a first or starting dose associated with this toxicity, using a prior dose-toxicity curve, which may be based on an animal model, results from a similar study, or the investigator's experience. After testing the first dose, the investigator recalculates the dose associated with the target probability of toxicity. This estimated dose is used to treat the next patient(s). The process of treating, evaluating toxicity, statistical model fitting, and dose estimation is repeated until the model converges (i.e., data from additional patients do not improve the model). The advantages of the continual reassessment method are that it is somewhat more efficient than the 3 + 3 design and has an unbiased estimation method. Several other designs, many involving adaptive methods, have been proposed. The goal of these methods is to improve upon the ability of the 3 + 3 design to identify the dose and toxicity of investigational compounds. No one method for conducting phase I trials has proven to be superior to the others in all instances.
Trial Design for Phase II Oncology Studies
One of the primary objectives of a phase II oncology trial of a new drug or agent is to determine whether the agent has sufficient antitumor activity to warrant more extensive development. Two-stage phase II designs are widely used in oncology studies. Several two-stage designs are discussed in this section: Gehan's, Fleming's, Simon's optimal, Simon's minimax, and Fei and Shyr's balanced two-stage designs.
Gehan's Design
Gehan's design is a two-stage design that estimates response rate while providing for early termination if the drug shows insufficient antitumor activity or effectiveness in the case of a device. The design is most commonly used with the first stage of 14 patients. If no responses (completed or partial) are observed, the trial is terminated. The rationale for stopping is that if the true response probability were at least 20%, at least one response would likely be observed in the first 14 patients; if no responses are seen, it is unlikely that the true response rate is at least 20%. If at least one response is observed in the first 14 patients, then the second stage of accrual is carried out to obtain an estimate of the response rate. The number of patients to accrue in the second stage depends on the number of responses observed in the first stage and the precision desired for the final estimate of response rate. If the first stage consists of 14 patients, the second stage consists of between 1 and 11 patients if a standard error of 10% is desired and between 45 and 86 patients if a standard error of 5% is desired. A common use of Gehan's design is to accrue 14 patients in the first stage and an additional 11 patients in the second stage, for a total of 25 patients. This provides an estimate of response rate with a standard error of about 10%, which corresponds to very broad confidence limits. For example, if three responses are observed among 25 patients, a 95% confidence limit for the true response rate is from about 3% to about 30%.
A limitation of Gehan's design is that a poor drug may be allowed to move to the second stage. For example, if a drug has a response rate of only 5%, there exists a 51% chance of at least one response among the first 14 patients. Thus the first stage of 14 patients will not effectively screen out all inactive drugs.
Fleming's Design
Fleming presented a multistage design for testing the hypothesis that the probability of a true response is less than some uninteresting level (e.g., 5% response rate) against the hypothesis that the probability of a true response is at least as large as a target level (e.g., 20% response rate). Table 27.2 shows two examples of Fleming's design.
| P0 | P1 | n1 | n | REJECT DRUG IF RESPONSE RATE | ACCEPT DRUG IF RESPONSE RATE | α | β | ||
|---|---|---|---|---|---|---|---|---|---|
| ≤r1/n1 | ≤r/n | ≥r1/n1 | ≥r/n | ||||||
| 0.05 | 0.20 | 15 | 35 | 0/15 | 3/35 | 3/15 | 4/35 | 0.10 | 0.08 |
| 0.05 | 0.25 | 15 | 25 | 1/15 | 2/25 | 3/15 | 3/25 | 0.09 | 0.09 |
As a third example, consider a design with an uninteresting level of a 5% response rate and a clinically interesting (i.e., clinically significant) level of a 20% response rate, for which both error limits (type I and type II) are to be less than 10%. These constraints can be met with a two-stage Fleming's design with 15 patients in the first stage and 20 in the second stage, as follows:
- 1.
If no responses are observed in the first 15 patients, then the trial is terminated and the drug is rejected.
- 2.
If at least three responses are observed in the first 15 patients, then the trial is terminated and the drug is accepted.
- 3.
If one to two responses are observed in the first 15 patients, then 20 more patients are accrued.
- 4.
After all 35 patients are evaluated, the drug is accepted if the response rate is 11.4% or greater (≥4 responses in 35 patients), and the drug is rejected if the response rate is 8.6% or less (≤3 in 35 patients).
Fleming's design is the only two-stage design covered here that may terminate early with an “accept the drug” conclusion.
Simon's Optimal Design
Simon's optimal two-stage designs are optimal in the sense that the expected sample size is minimized if the regimen has low activity subject to type I and type II error probability constraints. The following values provide an example of Simon's optimal design:
Clinically uninteresting level = 5% response rate
Clinically interesting level = 20% response rate
Type I error (α) = 0.05
Type II error (β) = 0.20
Power = 1 − type II error = 0.80
Stage I: Reject the drug if the response rate is ≤0/10
Stage II: Reject the drug if the response rate is ≤3/29
In this example, the first stage consists of 10 patients. If no responses are seen in the first 10 patients, the trial is terminated. Otherwise, accrual continues to a total of 29 patients. If there are at least four responses in the total of 29 patients, the trial may move to a phase III study. The average sample size is 17.6, and the probability of early termination is 60% for a drug with a response rate of 5% (low activity). Simon's optimal design is the most commonly used two-stage design.
Simon's Minimax Design
Simon's minimax two-stage design minimizes maximum sample size subject to type I and type II error probability constraints. The following values provide an example of Simon's minimax design:
Clinically uninteresting level = 5% response rate
Clinically interesting level = 20% response rate
Type I error (α) = 0.05
Type II error (β) = 0.20
Power = 1 − type II error = 0.80
Stage I: Reject the drug if the response rate is ≤0/13
Stage II: Reject the drug if the response rate is ≤3/27
In this example, the first stage consists of 13 patients. If no responses are seen in the first 13 patients, the trial is terminated. Otherwise, accrual continues to a total of 27 patients. If there are at least four responses in the total of 27 patients, the trial may move to a phase III study. The average sample size is 19.8, and the probability of early termination is 51% for a drug with a response rate of 5% (low activity).
Comparisons of the Optimal and Minimax Designs
Simon's optimal two-stage design minimizes expected sample size, but it does not necessarily minimize maximum sample size, subject to error probability constraints. As a result, the minimax design may be more attractive when the difference in expected sample sizes is small and the accrual rate is low. Consider, for example, the case of distinguishing the uninteresting response rate of 10% from the clinically interesting response rate of 30% with α = β = 10%. The optimal design has an expected sample size of 19.8 and a maximum sample size of 35. The minimax design has an expected sample size of 20.4 and a maximum sample size of 25. If the accrual rate is only 10 patients per year, it could take 1 year longer to complete the optimal design than the minimax design. This may be more important than the slight reduction in expected sample size.
Fei and Shyr's Balanced Design
As discussed in the previous subsections, Simon's optimal and minimax two-stage designs are commonly used for phase II oncology trials. The optimal design minimizes expected sample size, and the minimax design minimizes maximum sample size. Neither method, however, considers balance between sample sizes in stages I and II (n1 and n2, respectively). For example, with the minimax design, if the investigator is testing a 15% improvement (0.50 vs. 0.65) in response rate, 66 patients are required in stage I but only two patients in stage 2 (n1/n2 = 33). Thus there is little value in early termination; this saves enrolling only two patients. As another example, with the optimal design, if the investigator is testing a 15% improvement (0.35 vs. 0.50) in response rate, 19 patients are required in stage I and 68 additional patients in stage II (n1/n2 = 0.28). In a case such as this, clinical investigators may resist early termination, given that stage I includes only 22% of the total target accrual. To address issues such as these, Fei and Shyr proposed a balanced two-stage design focused on balancing the sample size ratio (n1/n2), subject to type 1 and type 2 error probability constraints. With Fei and Shyr's balanced two-stage design, expected sample size is less than that of the minimax design, and/or maximum sample size is less than that of the optimal design. Tables 27.3 and 27.4 provide examples of balanced design, with comparison to optimal design (see Table 27.3 ) or minimax design (see Table 27.4 ). Tables 27.5 and 27.6 provide a more detailed comparison of stage I sample sizes, total sample sizes, expected sample sizes, probability of early termination, and sample size ratios for optimal, minimax, and balanced designs.
| P 0 | P 1 | α | β | OPTIMAL DESIGN | BALANCED DESIGN | ||||
|---|---|---|---|---|---|---|---|---|---|
| n 1 | n 2 | n 1 : n 2 | n 1 | n 2 | n 1 : n 2 | ||||
| 0.75 | 0.95 | 0.05 | 0.20 | 3 | 19 | 0.16 | 11 | 11 | 1 |
| 0.35 | 0.50 | 0.10 | 0.20 | 19 | 68 | 0.28 | 43 | 44 | 0.98 |
| 0.70 | 0.90 | 0.05 | 0.20 | 6 | 21 | 0.29 | 14 | 14 | 1 |
| P 0 | P 1 | α | β | MINIMAX DESIGN | BALANCED DESIGN | ||||
|---|---|---|---|---|---|---|---|---|---|
| n 1 | n 2 | n 1 : n 2 | n 1 | n 2 | n 1 : n 2 | ||||
| 0.45 | 0.60 | 0.05 | 0.10 | 93 | 2 | 46.5 | 58 | 58 | 1 |
| 0.50 | 0.65 | 0.05 | 0.20 | 66 | 2 | 33 | 39 | 39 | 1 |
| 0.70 | 0.90 | 0.05 | 0.20 | 6 | 21 | 0.29 | 14 | 14 | 1 |
| p 0 | p 1 | OPTIMAL DESIGN | MINIMAX DESIGN | BALANCED DESIGN | ||||||||||||
|---|---|---|---|---|---|---|---|---|---|---|---|---|---|---|---|---|
| REJECT DRUG IF RESPONSE RATE | REJECT DRUG IF RESPONSE RATE | REJECT DRUG IF RESPONSE RATE | ||||||||||||||
| ≤r 1 /n 1 | ≤r/n | EN (p 0 ) | PET (p 0 ) | n 1 : n 2 | ≤r 1 /n 1 | ≤r/n | EN (p 0 ) | PET (p 0 ) | n 1 : n 2 | ≤r 1 /n 1 | ≤r/n | EN (p 0 ) | PET (p 0 ) | n 1 : n 2 | ||
| 0.05 | 0.20 | 0/12 | 3/37 | 23.5 | 0.54 | 0.48 | 0/18 | 3/32 | 26.4 | 0.4 | 1.29 | 1/19 | 3/38 | 23.7 | 0.75 | 1 |
| 0/10 | 3/29 | 17.6 | 0.6 | 0.53 | 0/13 | 3/27 | 19.8 | 0.51 | 0.93 | 0/14 | 3/28 | 21.2 | 0.49 | 1 | ||
| 1/21 | 4/41 | 26.7 | 0.72 | 1.05 | 1/29 | 4/38 | 32.9 | 0.57 | 3.22 | 1/21 | 4/42 | 26.9 | 0.72 | 1 | ||
| 0.10 | 0.25 | 2/21 | 7/50 | 31.2 | 0.65 | 0.72 | 2/27 | 6/40 | 33.7 | 0.48 | 2.08 | 2/24 | 7/48 | 34.5 | 0.56 | 1 |
| 2/18 | 7/43 | 24.7 | 0.73 | 0.72 | 2/22 | 7/40 | 28.8 | 0.62 | 1.22 | 2/21 | 7/42 | 28.4 | 0.65 | 1 a | ||
| 2/21 | 10/66 | 36.8 | 0.65 | 0.47 | 3/31 | 9/55 | 40 | 0.62 | 1.29 | 4/32 | 10/64 | 38.8 | 0.79 | 1 a | ||
| 0.20 | 0.35 | 5/27 | 16/63 | 43.6 | 0.54 | 0.75 | 6/33 | 15/58 | 45.5 | 0.5 | 1.32 | 6/32 | 16/62 | 45.9 | 0.54 | 1.07 |
| 5/22 | 19/72 | 35.4 | 0.73 | 0.44 | 6/31 | 15/53 | 40.4 | 0.57 | 1.41 | 7/31 | 17/62 | 39.4 | 0.73 | 1 a | ||
| 8/37 | 22/83 | 51.4 | 0.69 | 0.8 | 8/42 | 21/77 | 58.4 | 0.53 | 1.2 | 8/39 | 21/78 | 53.7 | 0.62 | 1 a | ||
| 0.3 | 0.45 | 9/30 | 29/82 | 51.4 | 0.59 | 0.58 | 16/50 | 25/69 | 56 | 0.68 | 2.63 | 12/39 | 28/78 | 53.9 | 0.62 | 1 a |
| 9/27 | 30/81 | 41.7 | 0.73 | 0.5 | 16/46 | 25/65 | 49.6 | 0.81 | 2.42 | 11/34 | 26/68 | 44.4 | 0.69 | 1 a | ||
| 13/40 | 40/110 | 60.8 | 0.7 | 0.57 | 27/77 | 33/88 | 78.5 | 0.86 | 7 | 18/53 | 39/106 | 64.4 | 0.78 | 1 a | ||
| 0.4 | 0.55 | 16/38 | 40/88 | 54.5 | 0.67 | 0.76 | 18/45 | 34/73 | 57.2 | 0.56 | 1.61 | 19/44 | 40/80 | 56.2 | 0.72 | 1 a |
| 11/26 | 42/88 | 46.2 | 0.67 | 0.42 | 28/59 | 34/70 | 60.1 | 0.9 | 5.36 | 17/39 | 38/78 | 49.3 | 0.73 | 1 a | ||
| 19/45 | 49/104 | 64 | 0.68 | 0.76 | 24/62 | 45/94 | 78.9 | 0.47 | 1.94 | 23/53 | 50/105 | 66.7 | 0.74 | 1 | ||
| 0.5 | 0.65 | 18/35 | 47/84 | 53 | 0.63 | 0.71 | 19/40 | 41/72 | 58 | 0.44 | 1.25 | 20/39 | 44/78 | 53.6 | 0.63 | 1 a |
| 15/28 | 48/83 | 43.7 | 0.71 | 0.51 | 39/66 | 40/68 | 66.1 | 0.95 | 33 | 21/39 | 46/78 | 49.2 | 0.74 | 1 a | ||
| 22/42 | 60/105 | 62.3 | 0.68 | 0.67 | 28/57 | 54/93 | 75 | 0.5 | 1.58 | 25/50 | 58/100 | 72.2 | 0.56 | 1 a | ||
| 0.6 | 0.75 | 21/34 | 47/71 | 47.1 | 0.65 | 0.92 | 25/43 | 43/64 | 54.4 | 0.46 | 2.05 | 24/38 | 50/76 | 49 | 0.71 | 1 |
| 17/27 | 46/67 | 39.3 | 0.69 | 0.68 | 18/30 | 43/62 | 43.8 | 0.57 | 0.94 | 22/34 | 46/67 | 41.7 | 0.77 | 1.03 | ||
| 21/34 | 64/95 | 55.6 | 0.65 | 0.56 | 48/72 | 57/84 | 73.2 | 0.9 | 6 | 28/45 | 61/90 | 59.7 | 0.67 | 1 a | ||
| 0.7 | 0.85 | 14/20 | 45/59 | 36.2 | 0.58 | 0.51 | 15/22 | 40/52 | 36.8 | 0.51 | 0.73 | 18/26 | 40/52 | 38 | 0.54 | 1 |
| 14/19 | 46/59 | 30.3 | 0.72 | 0.47 | 16/23 | 39/49 | 34.4 | 0.56 | 0.88 | 21/28 | 44/56 | 34.2 | 0.78 | 1 a | ||
| 18/25 | 61/79 | 43.4 | 0.66 | 0.46 | 33/44 | 53/68 | 48.5 | 0.81 | 1.83 | 28/38 | 59/76 | 47.7 | 0.74 | 1 a | ||
| 0.80 | 0.95 | 5/7 | 27/31 | 20.8 | 0.42 | 0.29 | 5/7 | 27/31 | 20.8 | 0.42 | 0.29 | 5/7 | 27/31 | 20.8 | 0.42 | 0.29 |
| 7/9 | 26/29 | 17.7 | 0.56 | 0.45 | 7/9 | 26/29 | 17.7 | 0.56 | 0.45 | 7/9 | 26/29 | 17.7 | 0.56 | 0.45 | ||
| 16/19 | 37/42 | 24.4 | 0.76 | 0.83 | 31/35 | 35/40 | 35.3 | 0.94 | 7 | 18/22 | 39/44 | 29.3 | 0.67 | 1 | ||
Stay updated, free articles. Join our Telegram channel

Full access? Get Clinical Tree


