Fig. 2.1
Application of FISH in lymphoma diagnostics and research. (a) Scheme of the dual-color, break-apart probe for BCL6 translocations (www.abbottmolecular.com); Scheme of the dual-color, dual-fusion translocation probe for the t(14;18)/IGH-BCL2 (www.abbottmolecular.com) (b); (c–d) metaphase and interphase FISH with LSI IGH/BCL2 and LSI BCL6 performed on cases with t(3;14) and t(14;18) and t(3;14), respectively. Note the one fusion-one green-one red signal pattern in (d) the two fusions-one green-one red signal pattern in (c) and (e) Example of M-FISH. Arrows indicate abnormal chromosomes
An algorithm for diagnostic FISH evaluation of lymphomas currently used by clinical laboratories consists of initial testing with a simple “break-apart” assay for the locus of interest. If this screening is positive, one or more dual-fusion assays for specific translocation(s) can be applied, if the identification of the specific partner gene is clinically relevant.
In addition to specific structural rearrangements, FISH methods can also be used to detect copy number gains, losses, and amplifications of specific loci. True amplifications, as seen in solid tumors, are relatively rare in lymphomas. Furthermore, the detection of low copy number gains and losses in tissue sections is much more problematic than the detection of breakpoints, for which probes have been developed that generate easily distinguishable signal patterns. Identification and enumeration of signals is particularly challenging on sections from formalin-fixed, paraffin-embedded (FFPE) tissues, where the accuracy is compromised by factors such as cutting artifacts and nuclear overlap related to the thickness and homogeneity of the tissue sections and the size of the nuclei, as well as the fixation.
2.1.2.1 FISH on FFPE Tissues
FISH on FFPE tissues is a powerful alternative for clinical evaluation of lymphomas for which cells from fresh or frozen tissues are not available. In addition, the use of fixed tissues provides the opportunity to analyze large numbers of archival cases of rare anomalies (Haralambieva et al. 2002; Ventura et al. 2006). FISH analysis of FFPE tissue can be performed on unstained histological tissue sections or on disaggregated, intact nuclei (Schofield and Fletcher 1992; Kuchinka et al. 1995). Unstained sections allow preservation of tissue morphology and precise histopathologic correlation of multiple foci of normal cells, premalignant lesions, and tumor cells within a single specimen, including study of intra-tumor heterogeneity. However, this approach results in many incomplete nuclei, which can lead to a loss of some chromosomal material (the so-called truncation artifact) and subsequently to underestimation of chromosome copy number. Interpretation of results, therefore, requires rigorous assay validation. Analysis of large numbers of control samples has to be performed initially, to establish laboratory cutoff values for each anticipated signal pattern. An alternative approach involving extraction of intact nuclei from 50 μm tissue sections is not frequently used in routine clinical testing. A comprehensive review of technical issues related to performing FISH analysis on FFPE tissues is beyond the scope of this text but can be found in other review articles and book chapters (Hopman et al. 1997; Weremowicz and Schofield 2007; Muller et al. 2009).
FISH results on tissue sections are typically available in 3–7 days. FISH on paraffin sections is labor-intensive and time-consuming; however, the opportunity to acquire valuable clinical information that otherwise would not be obtainable and to evaluate archival material far outweighs these considerations.
2.1.2.2 Multicolor FICTION
Multicolor fluorescence immunophenotyping and interphase cytogenetics technique (M-FICTION) has been developed as a tool for phenotypic and genotypic analyses of neoplastic cells (Martin-Subero et al. 2002). This approach enables the simultaneous detection of morphologic, immunophenotypic, and genetic features of single cells and is particularly useful in studies of tumors characterized by rare neoplastic cells, such as Hodgkin lymphoma. In practice, the multicolor FICTION combines a typical immunophenotypic detection of lineage- or tumor-specific antigens (e.g., CD20 in the case of mature B-cell lymphoma) with FISH using probe for the relevant loci (e.g., LSI BCL6) (for details, see Martin-Subero et al. 2002). FICTION can be applied on fresh (frozen) material, as well as on FFPE sections. Using DNA probes labeled with several fluorescence dyes and/or by combinatorial labeling schemes, multiple genetic aberrations may be simultaneously studied.
2.1.2.3 Spectral Karyotyping (SKY) and Multiplex Fluorescence In Situ Hybridization (M-FISH)
SKY and M-FISH are molecular cytogenetic techniques which allow simultaneous visualization of each chromosome in a different color, thus facilitating the identification of chromosomal aberrations (Speicher and Ward 1996; Veldman et al. 1997). Both methods use libraries of DNA probes produced from flow-sorted chromosomes that are specific for individual chromosomes or chromosomal regions. Chromosome-specific probes are labeled with five basic fluorescent dyes, which are used either alone or in combination with each other to create 24 color mixtures with distinct proportions of each dye. Thus, each chromosome is characterized by a unique spectral signature (Speicher et al. 1996; Tanke et al. 1999). Since the human eye is not capable of resolving small wavelength differences, a complex technical translation system has to be used for SKY/M-FISH analysis; the sophisticated equipment required is the major drawback of this technology.
Using SKY/M-FISH, complex structural abnormalities can be visualized readily and the chromosomal origin of abnormal structures, such as marker chromosomes, can be identified much more easily than by conventional cytogenetic analysis (Fig. 2.1e). However, because of the need for specific interpretative skills and more complex equipment than conventional cytogenetics, SKY and M-FISH are accessible to only a limited number of investigators, and it has remained a research tool.
2.1.3 Comparative Genomic Hybridization (CGH), Array CGH, and SNP Arrays
Comparative genetic hybridization (CGH) and its successor, array CGH (aCGH), are genome-wide methods that allow detection of copy number abnormalities (deletions, duplications, chromosome loss or gain) with a very high resolution and do not require dividing tumor cells. As a result of its improved resolution (<50–100 kb) (Fig. 2.2), aCGH or “matrix CGH” has replaced conventional CGH. In aCGH, normal DNA and tumor DNA are differentially labeled with fluorescent dyes [frequently used dyes are cyanin 3 (Cy3) and cyanin 5 (Cy5)]. After blocking of repetitive DNA, these labeled DNAs are competitively hybridized to a high-density array of probes spotted on a glass slide and analyzed using a microarray scanner and specialized software. Equal hybridization of tumor and control DNA (comparable signal intensities between two colors) indicates the absence of deletions or duplications in the tumor sample. In contrast, increased or decreased signal intensities from tumor DNA relative to the control sample are indicative of duplications or deletions of specific genomic regions in the tumor. DNA isolated from blocks of paraffin-embedded tissue can be used successfully for hybridization. Although the application of aCGH in mature B-cell and T-cell lymphomas has allowed the detection of distinct patterns of gains and losses characteristic of particular lymphoma subtypes, a major drawback of both conventional CGH and aCGH is that balanced chromosomal alterations such as translocations cannot be detected.
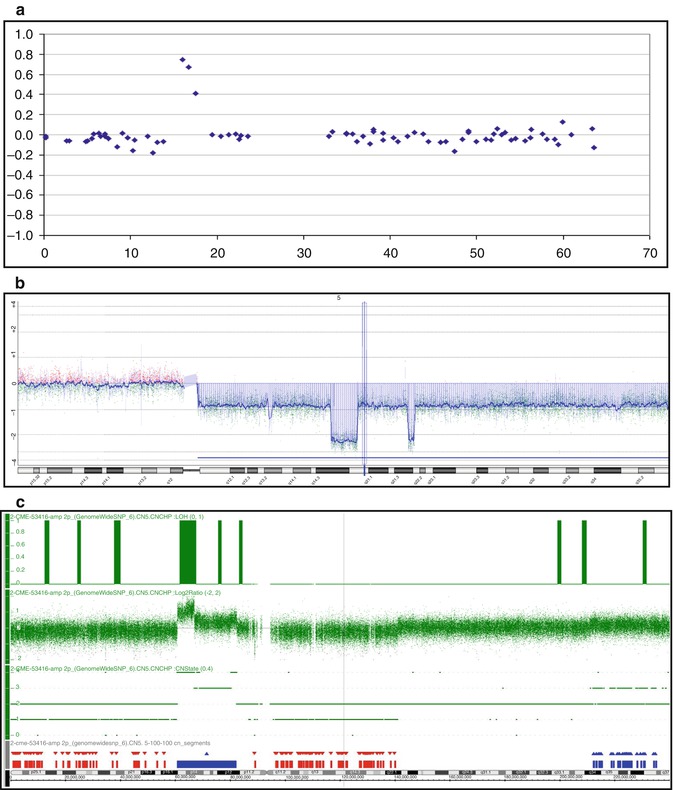

Fig. 2.2
Examples of array CGH analysis using platforms with an increased resolution. (a) 1 Mb BAC array (3,500 clones); (b) Agilent Oligo 400 k (400,000 oligos); (c) Affymetrix SNPs 6.0 (1.8 mln SNPs)
Single nucleotide polymorphism (SNP) array analysis is the newest, clinically applicable whole genome method. A unique advantage of SNP analysis over other available methods is that not only changes in copy number but also regions of loss of heterozygosity (LOH) without loss or gain of DNA can be detected (i.e., copy-neutral LOH or uniparental disomy – UPD), indicating that both alleles are homozygous and derived from the same parental chromosome. The acquired LOH is very important to detect in tumors, since it represents a common mechanism of eliminating the wild-type alleles of tumor suppressor genes and oncogenes and duplicating mutated alleles. Regions of LOH, therefore, frequently harbor tumor suppressor genes with inactivating (loss-of-function) mutations or oncogenes with activating (gain-of-function) mutations. Alternatively, regions with UPD may contain biallelic hypermethylated and, thus, silenced (candidate tumor suppressor) genes. SNP analysis is a promising approach to genome-wide analysis in lymphoma and is now supported by efficient commercially available platforms.
2.2 Cytogenetic Aspects of Individual Lymphomas
Cytogenetic findings in individual subtypes of rare lymphomas are discussed below and summarized in Tables 2.1 and 2.2.
Table 2.1
Recurrent abnormalities in mature T- and NK-cell neoplasms
Lymphoma type | Recurrent abnormalitiesa | Primary (diseasecharacteristic) abnormalities |
|---|---|---|
Adult T-cell leukemia | Gains: X, 3, 5, 7; 1q, 3p (acute type), 2p, 4q, 7p, 7q (CGH) | Not described |
Losses: X, Y, 13, 6q, 10p, 3q, 5q, 9q, 13q, 1p, and 7p; 6q, 10p, 13q, 16q, 18p (CGH) | ||
Structural aberrations: t(14;14)(q11.2;q32), inv(14)(q11.2q32), del(14)(q11.2q13) | ||
Common breakpoints: 14q11.2 (TCRA and TCRD) | ||
Amplifications: 1p36, 6p25, 7p22 (CARD11), 7q, 14q32 | ||
Nasal NK-cell lymphoma | Gains: X; Xp, 2p, 10q (CGH); 2q (aCGH) | Not described |
Losses: 6q21-q25, 13q, 17p; 6q, 13q, 17p, 1p, 12q (CGH); 6q16–q27, 11q22–q23, 5p14, 5q34, 1p36, 2p16, 4q12, 4q31 (aCGH) | ||
Structural aberrations: i(1q), i(7q), i(17q) | ||
Enteropathy-associated lymphoma | Gains: 1q22–q44, 5q, 9q31.3–qter (aCGH) | Not described |
Losses: 16q12.1 (aCGH) | ||
Amplifications: 8q24.2 (MYC) | ||
Hepatosplenic T-cell lymphoma | Gains: 8 | i(7)(q10) |
Losses: Y | ||
Structural aberrations: i(7)(q10) | ||
Cutaneous T-cell lymphomas: | ||
Mycosis fungoidesand Sézary syndrome | Gains: 8, 18, 8q, 17q (CGH) | Not described |
Losses: 1p, 6q, 10q, 13q, 17p, 19 (CGH) | ||
Common breakpoints: 12q21 (NAV3) | ||
Primary cutaneousanaplasticlarge cell lymphoma | Losses: 9p21 (CDKN2A) (CGH) | Not described |
Amplifications (CGH): 8p22 (CTSB), 3p25 (RAF1), 2p16 (REL), 19p13.2 (JUNB) | ||
Peripheral T-cell lymphoma,not otherwise specified | Gains: 7q (CDK6), 8q (MYC), 17q, 22q (CGH and aCGH) | t(5;9)(q33;q22)/ITK-SYKin PTCL-F |
Losses: 4q, 5q, 6q, 9q, 10q, 12q, 13q (CGH and aCGH) | ||
Structural aberrations: t(5;9)(q33;q22) in follicular variant | ||
AngioimmunoblasticT-cell lymphoma | Gains: X, 3, 5, 21 | Not described |
Losses: 6q, 13q | ||
Anaplastic large cell lymphoma | ||
ALK-positive ALCL | Gains: 7, 17p, 17q (CGH) | t(2;5)(p23;q35)/NPM1-ALK1, variant 2p23/ALK aberrations |
Losses: 4, 11q, 13q (CGH) | ||
Structural aberrations: t(2;5)(p23;q35) and variants – Table 2.3 | ||
ALK-negative ALCL | Gains: 1q, 6p21, 6q, 7 | t(6;7)(p25.3;q32.3) |
Losses: 13q | ||
Structural aberrations: t(6;7)(p25.3;q32.3) |
Table 2.2
Recurrent abnormalities in mature B-cell neoplasms
Lymphoma type | Recurrent abnormalitiesa | Primary (diseasecharacteristic) abnormalities |
|---|---|---|
B-cell prolymphocytic leukemia | Losses: 13q14, 11q23, 17p (FISH) | Not described |
Structural aberrations: chr 7 | ||
Marginal zone lymphoma | ||
MALT | Gains: 3, 6p, 7, 8q, 9q, 11q, 12, 18 | t(11;18)/API2-MALT1, t(1;14)/IGH-BCL10, t(3;14)/IGH-FOXP1, t(14;18)/IGH-MALT1, t(X;14)/IGH-GPR34 |
Losses: 6q23 (aCGH and SNP array) | ||
Structural aberrations: t(11;18)(q21;q21.3), t(1;14)(p22;q32), t(3;14)(p13;q32), t(14;18)(q32;q21.3), t(X;14)(p12;q32) | ||
Nodal MZL | Gains: 3, 18, 7q, 8q, 13q; 1q23–q25, 3q23–q24, 12q (CGH) | t(X;14)/IGH-GPR34 (rare) |
Losses: 1p21–p22, 11q21–q22, 13q14, 15q25–q26 (CGH) | ||
Structural aberrations: t(X;14)/IGH-GPR34 | ||
Splenic MZL | Gains: 3, 18, 12 | Not described |
Losses: 7q, 6q, 13q | ||
Common breakpoints: 14q32 (IGH) | ||
Mantle cell lymphoma | t(11;14)(q13;q32)/IGH-CCND1 | |
Structural aberrations: t(11;14)(q13;q32) or 11q13 variants | ||
CNS lymphoma | Gains: 12q, 18q21, 22q | Not described |
Losses: 9p21 (CDKN2A), 6q (CGH) | ||
Primary mediastinal B-cell lymphoma | Gains: 2p, 9p, 12q, Xq (CGH); 7q22, 9q34, 11q23, 12q, 18q21 (aCGH) | Not described |
Losses: 6p21, 11q13.3 (aCGH) | ||
Amplification: 2p16 (REL and BCL1A), 9p24 (JAK2, CD274/PDL1 and PDCD1LG2/PDL2) (aCGH) | ||
Cutaneous B-cell lymphoma | ||
PCMZL | Structural aberrations: t(14;18)(q32;q21.3)/IGH-MALT1 | |
PCFCL | Structural aberrations: t(14;18)(q32;q21.3)/IGH-BCL2 | |
DLBL – leg type | Gains:18q, 1q, 7, 12q, Xp (CGH) | Not described |
Losses: 6q (CGH); 9p21.3 (aCGH) | ||
Amplification: 18q (BCL2, MALT1) (aCGH) | ||
Common breakpoints: 3q27 (BCL6), 8q24.2 (MYC), 14q32 (IGH) (FISH) | ||
Waldenstrom macroglobulinemia | Gains:4 | Not described |
Losses: 6q | ||
HIV-associated lymphoma | ||
Primary effusion lymphoma | Gains: 7, 12, 12q22–q23, 12q12–q23 (CGH) | Not described |
Common breakpoints: 1q21-q25 | ||
Adult Burkitt lymphoma | Gains: 1q, 7, 12 | t(8;14)(q24.2;q32)/IGH-MYC, t(2;8)(p12;q24.2)/IGK-MYC, t(8;22)(q24.2;q11.2)/IGL-MYC |
Losses: 6q, 17p, 13q32–q34 | ||
Structural aberrations: t(8;14)(q24.2;q32), t(2;8)(p12;q24.2), and t(8;22)(q24.2;q11.2) | ||
Nodular lymphocyte-predominant Hodgkin lymphoma | Gains: 1q | Not described |
Losses: 4q28–q32, 7, 13q | ||
Common breakpoints: 14q32 (IGH), 3q27 (BCL6) |
2.2.1 Mature T- and NK-Cell Neoplasms
The 2008 World Health Organization’s (WHO’s) classification of lymphoid malignancies recognized 18 subtypes of mature T- and NK-cell neoplasms (Swerdlow et al. 2008). These tumors are relatively uncommon and often clinically aggressive and their diagnosis remains a challenge. With rare exceptions, the molecular pathogenesis of T-cell and NK-cell lymphomas is largely unknown.
2.2.1.1 Adult T-Cell Leukemia
Adult T-cell leukemia/lymphoma (ATLL) is a mature T-cell neoplasm caused by the human T-lymphotropic virus 1 (HTLV-1, also called T-cell leukemia virus). This tumor is endemic in those parts of the world where HTLV-1 is prevalent in the population, including Japan, the Caribbean basin and parts of central Africa (Swerdlow et al. 2008). HTLV-1 is the first human retrovirus shown to cause malignant transformation, which is mediated by the viral protein Tax. One of its effects on cellular processes is to impair DNA repair mechanisms by repressing the expression of DNA polymerase-β, an enzyme involved in base excision repair, and by repressing nucleotide excision repair, involved in repairing UV irradiation and DNA replication-induced damage. Tax can also directly inactivate the TP53 protein (Kannian and Green 2010; Yasunaga and Matsuoka 2011). HTLV-1-induced destabilization of the genome may explain the complex karyotypes (3 or more cytogenetic abnormalities) that are typically observed in ATLL.
Chromosome abnormalities have been found by conventional cytogenetic analysis in almost all ATLL samples examined; the changes are typically complex and variable, with abnormalities affecting any chromosome pair. Nonetheless, several recurring abnormalities have been described. Translocations are identified in ~10 % of ATLL cases. The T-cell receptor α/Δ gene (TCRA and TCRD) locus at 14q11.2 is frequently rearranged, often as a t(14;14)(q11.2;q32), inv(14)(q11.2q32), or del(14)(q11.2q13) or as a rearrangement of 14q11.2 with one of several other chromosome arms, including Xq, 1p, 1q, 3p, 3q, 8q, 10p, 11p, 12q, and 18p (Kamada et al. 1992). The numerical abnormalities most frequently noted by conventional cytogenetic analysis comprised −X, −Y, −13, +X, +3, +5, and +7, whereas frequently observed segmental aneuploidies included deletions of 6q, 10p, 3q, 5q, 9q, 13q, 1p, or 7p (Schlegelberger et al. 1994a).
Genome profiles of ATLL have been extensively studied by conventional CGH. The most frequently observed imbalances were losses at 6q and 13q and gains at 7q and 3p. CGH analysis also showed abnormalities at numerous other chromosomal regions, including 1p, 1q, 3q, 5p, 5q, 9q, 10p, 10q, 11q, 12q, 18q, and Y. Comparison of genome profiles detected by CGH revealed differences between the acute and lymphoma types of ATLL, with the lymphoma type more frequently showing gains on 1q, 2p, 4q, 7p, and 7q and losses from 10p, 13q, 16q, and 18p and the acute type manifesting gains of 3p. Recurrent high-level amplifications were found at 1p36, 6p25, 7p22, 7q, and 14q32 in the lymphoma type, with CARD11 identified as a candidate oncogene in 7p22 (Tsukasaki et al. 2001; Oshiro et al. 2006).
Specific CGH profiles correlate with distinct clinical features. Aberrations of 1p, 1q, 1q10–21, 10p, 10p13, 12q, 14q, and 14q32 are associated with features such as hepatosplenomegaly, elevated LDH, and an unusual immunophenotype, which are all indicators of clinical severity in ATLL. Multiple changes; abnormalities of 1p, 1q22, 1q10–21, 2q, 3q, 3q10–12, 3q21, 14q, 14q32, and 17q; and partial losses from chromosome arms 2q, 9p, 14p, and 17q are correlated with shorter survival (Tsukasaki et al. 2001).
2.2.1.2 Nasal NK-Cell Lymphoma
Nasal NK-cell lymphoma is characterized by complex karyotypes, which do not appear to be disease specific. Wong et al. (1997) reported a common deletion at 6q21–q25 in three of seven cases studied by conventional cytogenetic analysis, suggesting that this may be a nonrandom chromosomal aberration in this disease. Other recurring abnormalities detected by metaphase analysis include +X, i(1q), i(7q), +8, del(13q), del(17p), i(17q), and rearrangements of 11q23 (Wong et al. 1999). Conventional CGH studies identified del(6q), del(13q), del(17p), del(1p), del(12q), and partial gain of Xp, 2p, or 10q as recurrent abnormalities (Siu et al. 1999). Genome-wide array-based CGH studies identified a number of recurrent imbalances in nasal-type extranodal NK-/T-cell lymphoma, including gain of 2q and loss of 6q16–q27, 11q22–q23, 5p14, 5q34, 1p36, 2p16, 4q12, and 4q31 (Nakashima et al. 2005).
2.2.1.3 Enteropathy-Associated Lymphoma
Enteropathy-associated lymphoma (ETL) is an intestinal tumor of intraepithelial T lymphocytes usually presenting as a tumor composed of large lymphoid cells that show varying degrees of transformation (Swerdlow et al. 2008). Genetic studies of ETL are limited, but most ETL cases (58–70 %) are characterized by frequent complex gains of the 9q31.3-qter chromosome region or by deletions of 16q12.1 (Deleeuw et al. 2007; Zettl et al. 2002). The affected 9q region harbors several candidate genes, including ABL1 and NOTCH1, which are preferentially amplified in ETL (Cejkova et al. 2005). The 9q33–34 imbalances, however, are not specific for ETL, being found in almost 20 % of PTCL-NOS (Zettl et al. 2004). Other recurrent chromosomal aberrations include a partial trisomy of 1q22–q44 and gains of 5q reported in the classical form of ETL (Verkarre et al. 2003; Zettl et al. 2004) and amplifications of 8q24.2/MYC which are recurrently observed in the monomorphic variant (Zettl et al. 2002; Deleeuw et al. 2007). Furthermore, loss of heterozygosity at 9p21 is recurrent in classical ETL, and one or more genes in this region have been postulated to be involved in the pathogenesis of ETL (Obermann et al. 2004).
2.2.1.4 Hepatosplenic T-Cell Lymphoma
Hepatosplenic T-cell lymphoma (HSTCL) is a clinically aggressive subtype of PTCL, and the affected patients have a dismal outcome. This lymphoma accounts for 1.4 % of all mature T-cell neoplasms and represents <1 % of all non-Hodgkin lymphomas. The vast majority of HSTCLs express the γδ T-cell receptor (TCR) (HSγδTCL), but rare cases with the αβ TCR phenotype (HSαβTCL) have been also described (Lai et al. 2000; Suarez et al. 2000; Macon et al. 2001; Rashidi et al. 2012).
HSγδTCL is characterized by an isochromosome 7q [i(7)(q10)] (Fig. 2.3a), which has been identified by conventional cytogenetic and/or FISH analysis in almost all cases analyzed (Wang et al. 1995; Cooke et al. 1996; Jonveaux et al. 1996; Alonsozana et al. 1997). The i(7)(q10) can appear as the sole karyotypic abnormality, what suggests its primary and critical role in the development of HSγδTCL. The molecular consequences of i(7)(q10) are largely unknown, however, gene dosage effect resulting from the associated loss of 7p and gain of 7q (Fig. 2.3b) has been postulated. The tendency of HSγδTCL to select clones with increased copies of i(7)(q10) (Wlodarska et al. 2002) (Fig. 2.3c) or with the amplified 7q sequences (Shetty et al. 2006; Tamaska et al. 2006) suggests that this chromosome harbors genes potentially important for its pathogenesis. One of the candidate genes is cyclin-dependent kinase 6 (CDK6), known as a target of the t(2;7)(p12;q21) in splenic marginal zone lymphoma (Corcoran et al. 1999). Despite a strong association of the i(7)(q10) with HSγδTCL, this aberration is not specific for the entity, being observed at a lower frequency in a broad spectrum of hematological malignancies (Mertens et al. 1994). Secondary aberrations frequently associated with i(7)(q10) in HSγδTCL include trisomy 8 and loss of the Y chromosome (Alonsozana et al. 1997; Jonveaux et al. 1996; Wlodarska et al. 2002). The role of these abnormalities in the pathogenesis of HSγδTCL is unknown. Early cytogenetic studies reported rare HSγδTCL cases with abnormal karyotypes, but lacking i(7)(q10) (Ross et al. 1994; Salhany et al. 1997a, b; Weidmann et al. 2000); these findings, however, have not been validated by FISH.
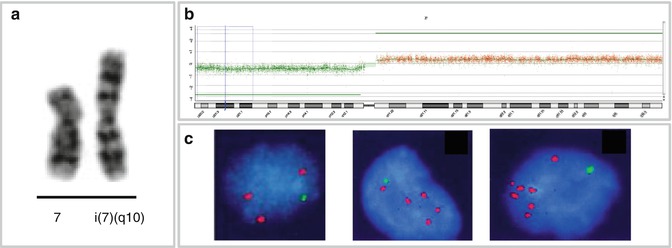

Fig. 2.3
Isochromosome 7q and HSγδTCL. (a) Partial karyotype with i(7)(q10); (b) aCGH profile of chromosome 7 in case of HSγδTCL showing loss of 7p and gain of 7q associated with i(7)(q10); (c) interphase FISH with probes for 7p (green) and 7q (red) in cases of HSγδTCL with one (left), two (middle), and three (right) copies of the i(7)(q10) (Wlodarska et al. 2002, unpublished data)
2.2.1.5 Cutaneous T-Cell Lymphoma
T-cell lymphomas showing primary localization in the skin include mycosis fungoides and Sézary syndrome, primary cutaneous CD30+ lymphoproliferative disorders including primary cutaneous anaplastic large cell lymphoma and lymphomatoid papulosis, subcutaneous panniculitis-like T-cell lymphoma, and some rare lymphomas such as primary cutaneous aggressive epidermotropic CD8+ T-cell lymphoma (provisional), cutaneous γ/δ T-cell lymphoma (provisional), and primary cutaneous CD4+ small-/medium-sized pleomorphic T-cell lymphoma (provisional) (Swerdlow et al. 2008).
Complex karyotypes have been observed in mycosis fungoides (MF) and Sézary syndrome (SS), but no disease-specific abnormalities have been described (Prunieras 1974; Thangavelu et al. 1997). Karenko et al. reported recurrent rearrangements with a breakpoint at 12q21, targeting the NAV3 (POMF1L1) gene (Karenko et al. 2007). Translocations involving TCR loci are notably absent in MF/SS (Salgado et al. 2011). CGH studies have revealed common deletions at 1p, 6q, 10q, 13q, and 17p and on chromosome 19 and gains of chromosomes 7 and 18 and at 8q and 17q (Mao et al. 2002).
Complex karyotypes are also characteristic for primary cutaneous anaplastic large cell lymphoma (C-ALCL). The t(2;5)(p23;q35), characteristic for ALK-positive ALCL, is detected in only rare cases. NPM1-ALK transcripts were detected by PCR in the absence of ALK protein expression in these tumors; thus, their pathogenetic significance is uncertain (Wood 1998). Deletions at 9p21, affecting the CDKN2A/p16 locus, are present in some C-ALCLs. CGH studies also demonstrated oncogene amplifications involving CTSB at 8p22, RAF1 at 3p25, REL at 2p16, and JUNB at 19p13.2 (Mao et al. 2003; van Kester et al. 2010).
Cytogenetic studies of regressing lymphomatoid papulosis lesions demonstrated either a normal karyotype or abnormalities of chromosomes 7, 10, and 12. The t(2;5) has not been found (Mao et al. 2002).
2.2.1.6 Peripheral T-Cell Lymphoma, Not Otherwise Specified
Peripheral T-cell lymphoma, not otherwise specified (PTCL-NOS) is the largest and most common category of PTCL, accounting for approximately 30 % of all PTCLs in the Western world. This entity is very heterogeneous comprising cases that do not correspond to any of the PTCL subtypes recognized in the current WHO classification (Swerdlow et al. 2008). Cytogenetic analysis showed that karyotypes of PTCL-NOS are typically very complex. Both conventional and array CGH studies detected recurrent gains of 7q/CDK6, 8q/MYC, 17q, and 22q and recurrent losses of 4q, 5q, 6q, 9q, 10q, 12q, and 13q (Thorns et al. 2007; Nagel et al. 2008). Deletions of 5q, 10q, and 12q correlate with a better prognosis (Zettl et al. 2004). Notably, genomic profiles of PTCL-NOS differ from those observed in AITL and ALCL. The regions 6q16–q22, 9p21, and 11p11.2 are predominantly lost in PTCL-NOS when compared to AITL and gains of 7q22 and 8q24.1–q24.3 are more frequent in PTCL-NOS than in AITL- and ALK-negative ALCL. Common genetic events identified in these entities include a recurrent gain of 11q13 in both AITL and PTCL-NOS and loss of 6q21 in both ALK-negative ALCL and PTCL-NOS (Zettl et al. 2004; Thorns et al. 2007; Nelson et al. 2008).
The WHO classification recognized three variants of PTCL-NOS: lymphoepithelioid (Lennert’s lymphoma), follicular, and T-zone variants (Swerdlow et al. 2008). Genetic data are mainly available for the follicular variant (PTCL-F), in which the growth pattern mimics follicular B-cell lymphoma or T-cell lymphomas with a perifollicular growth pattern (Rudiger et al. 2000; Ikonomou et al. 2006; Huang et al. 2009). This lymphoma is characterized by a recurrent t(5;9)(q33;q22), which involves two protein tyrosine kinase genes: ITK, the IL-2-inducible T-cell kinase gene located at 5q33, and SYK, the spleen tyrosine kinase gene mapped at 9q22 (Streubel et al. 2006b). The resulting ITK-SYK fusion protein revealed a constitutively active SYK tyrosine kinase, which has shown to be transforming both in vitro and in vivo (Rigby et al. 2009; Dierks et al. 2010; Pechloff et al. 2010). SYK plays an important key role in TCR signaling; overexpression and activation of SYK is a common feature of PTCL, and therefore, the gene represents a potential therapeutic target (Feldman et al. 2008; Wilcox et al. 2010). Although the t(5;9)/ITK-SYK has been detected in 17 % of PTCL-NOS, it seems to be restricted to PTCL-F (Streubel et al. 2006b; Feldman et al. 2008). Given the rarity of PTCL-F, the prognostic significance of the t(5;9) is unknown.
2.2.1.7 Angioimmunoblastic T-Cell Lymphoma
Angioimmunoblastic T-cell lymphoma (AITL) accounts for 1–2 % of all non-Hodgkin lymphomas and for 25–30 % of PTCL cases in Europe and North America (Rudiger et al. 2002). Clonal chromosomal aberrations have been detected in up to 90 % of the cases analyzed (Weiss et al. 1986; Tan et al. 2006; Attygalle et al. 2007). The recurrent aberrations include trisomies of chromosomes 3, 5, and 21; gain of X; and loss of 6q and 13q (Schlegelberger et al. 1994b; Thorns et al. 2007; Nelson et al. 2008; reviewed by Dogan et al. 2003). Chromosomal breakpoints affecting the TCR gene loci seem to be very scarce (Leich et al. 2007). Although the cellular derivation is uncertain, recent findings suggest that MAF-expressing follicular helper T cells (TFH) represent the normal counterpart of AITL (Thielen et al. 2011).
2.2.1.8 Anaplastic Large Cell Lymphoma
ALK-Positive Anaplastic Large Cell Lymphoma
Anaplastic large cell lymphoma expressing the anaplastic lymphoma kinase (ALK-positive ALCL) is a well-defined subtype of PTCL accounting for approximately 3 % of all NHLs and for 60–80 % of all ALCLs. The tumor occurs predominantly in children and young adults. The aberrant expression of ALK in these tumors is caused by chromosomal rearrangements of ALK/2p23. The gene was initially identified as a partner of nucleophosmin (NPM1) in ALCL-associated t(2;5)(p23;q35) (Morris et al. 1995) (Fig. 2.4a–c). The NPM1-ALK fusion protein contains the N-terminal portion of the NPM1 protein and the intracellular kinase domain of ALK. The oncogenic potential of NPM1-ALK has been proven by a number of in vitro and in vivo studies (Falini et al. 1999; Kuefer et al. 1997; Lange et al. 2003). ALK codes for a transmembrane receptor tyrosine kinase, which is a member of the insulin receptor superfamily. The biological function of ALK is largely unknown, but its normal expression is restricted to scattered cells in the central nervous system (Iwahara et al. 1997; Morris et al. 1997). The t(2;5) occurs in approximately 75 % of ALK-positive ALCL cases and the remaining cases harbor one of the variant ALK/2p23 rearrangements. The identified variant ALK fusions are listed in Table 2.3, and the inv(2) resulting in the ATIC-ALK rearrangement is illustrated in Fig. 2.4b–d. CGH analysis revealed that secondary genetic alterations are common in ALK-positive ALCL. Particularly frequent are gains of 7, 17p, and 17q and losses of 4, 11q, and 13q (Salaverria et al. 2008a; Swerdlow et al. 2008).
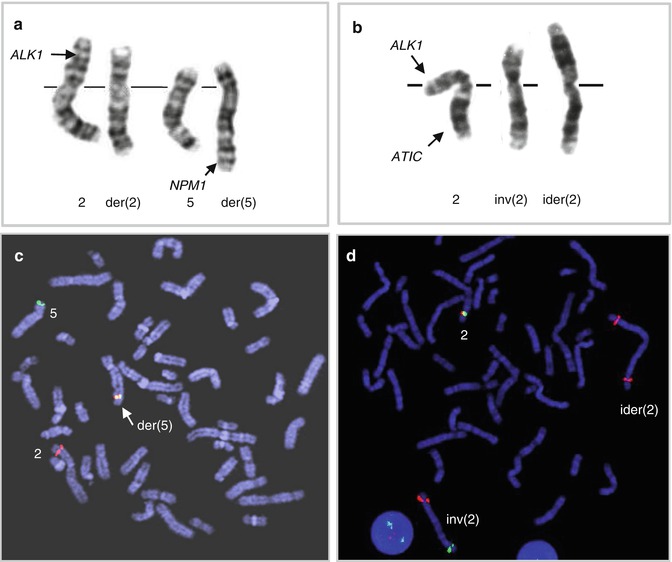

Fig. 2.4
The 2p23/ALK rearrangements in ALK-positive ALCL. (a) Classical t(2;5)(p23;q35)/ALK-NPM1 rearrangement and (b) variant 2p23 aberration, inv(2)(p23q35), involving ALK and ATIC; this aberration is commonly accompanied by ider(2)(q10)inv(2)(p23q35); (c) FISH with probes covering the 3′ end of ALK (red) and the 5′ end of NPM1 (green) in t(2;5)-positive lymphoma; note a fused signal on der(5); (d) FISH with LSI ALK break-apart probe in the inv(5)-positive tumor; note split ALK signals on inv(2) and two extra red signals (3′ ALK) on ider(2)(q10)inv(2)(p23q35) (Ma et al. 2000)
Table 2.3
Recurrent chromosomal rearrangements involving 2p23/ALK in ALK-positive ALCL
Chromosomalaberration | Fusion partner | Molecular weight ofhybrid protein (kDa) | Cellular localization | References |
|---|---|---|---|---|
t(2;5)(p23;q35) | NPM1 | 80 | Nuclear, nucleolar,and diffuse cytoplasmic | |
t(1;2)(q25;p23)a | TPM3 | 104 | Diffuse cytoplasmicand membranous | |
inv(2)(p23;q35) | ATIC | 96 | Diffuse cytoplasmic | |
t(2;3)(p23,q21)a | TFG | 85–97 | Diffuse cytoplasmic | |
t(2;17)(p23;q23) | CLTC | 250 | Granular cytoplasmic | Touriol et al. (2000) |
t(2;19)(p23;p13.1) | TPM4 | 94–105 | Cytoplasmic | Meech et al. (2001) |
t(X;2)(q11;p23)a | MSN | 125 | Membranous | |
t(2;17)(p23;q25) | ALO17 | ND | Cytoplasmic | Cools et al. (2002) |
t(2;22)(p23;q11)a | MYH9 | 220 | Diffuse cytoplasmic | Lamant et al. (2003) |
All 2p23 aberrations lead to overexpression of the ALK protein and constitutive tyrosine kinase activation of ALK. Of note, cellular localization of the ALK fusion in tumor cells is determined by the biological function of the partner gene (reviewed by Drexler et al. 2000 and Stein et al. 2000). Oncogenic potential of ALK, demonstrated in various lymphoid and non-lymphoid malignancies, is mediated by interaction in multiple signaling pathways, including the JAK3/STAT3 and PI3K/AKT pathways (reviewed by Amin and Lai 2007; Webb et al. 2009; de Leval and Gaulard 2011). ALK expression is an important prognostic factor for ALCL patients, since the 5-year survival rate of ALK-positive patients is significantly higher as compared to ALK-negative cases (Shiota et al. 1995; Falini et al. 1999; Gascoyne et al. 1999; Savage et al. 2008). Given that the ALK protein is not expressed by lymphoid cells, immunostaining with ALK-specific antibodies is routinely used for the diagnosis of ALK-positive tumors.
Interestingly, ALK fusions have been also identified in DLBCL, inflammatory myofibroblastic tumors, non-small cell lung cancer, and squamous cell carcinoma of the esophagus (Arber et al. 1996; Griffin et al. 1999; De Paepe et al. 2003; Jazii et al. 2006; Du et al. 2007; Rikova et al. 2007; Soda et al. 2007), highlighting the crucial role of ALK in tumorigenesis. Given that several small-molecule ALK inhibitors have been recently developed and tested preclinically, ALK-positive ALCL patients may also benefit from this novel targeted therapy.
ALK-Negative Anaplastic Large Cell Lymphoma
The genetic mechanisms underlying development of ALK-negative ALCL are poorly understood, but recent studies, including genome-wide molecular analyses, have identified novel genetic lesions in this entity and provided new insights into its pathogenesis. It has been shown that approximately 25 % of ALK-negative ALCLs harbor recurrent chromosomal translocations affecting 6q25.3 (Feldman et al. 2009, 2011; Pham-Ledard et al. 2010; Wada et al. 2011). Surprisingly, these aberrations appeared to target two different genes, IRF4 and the telomerically located DUSP22. IRF4 encodes a transcription factor which plays an important role in the regulation of normal lymphoid differentiation and tumorigenesis (Falini et al. 2000; Michaux et al. 2005). Thus far, partner chromosomes involved by the 6p25.3/IRF4 translocations have not been identified and molecular consequences of these rearrangements are also unclear, particularly that the expression of IRF4 in these tumors is not dysregulated (Feldman et al. 2011). More than 50 % of cases with the 6p25.3 aberrations involving DUSP22 affect 7q32.3. Interestingly, the recurrent t(6;7)(p25.3;q32.3) is associated with downregulation of DUSP22 and overexpression of MIR29 (Feldman et al. 2011). DUSP22 is a phosphatase that inhibits T-cell antigen receptor signaling in reactive T cells by inactivating the MAPK/ERK2 pathway (Alonso et al. 2002); thus, its downregulation as a result of the t(6;7) suggests that the gene acts as a tumor suppressor in ALK-negative ALCL. MIR29 is known to target the TCL1 oncogene (Ruiz-Ballesteros et al. 2007), which is not expressed in ALCLs. Further investigations are necessary to decipher the functional consequences of the 6p25.3 rearrangements in ALK-negative ALCL. Given that these aberrations occur only sporadically in other PTCL entities (Feldman et al. 2009, 2011; Pham-Ledard et al. 2010; Wada et al. 2011), their detection may be helpful in the diagnosis of ALK-negative ALCL.
Array CGH analysis of ALK-negative ALCL identified chromosomal imbalances in two-third of the cases analyzed; gains of 1q and 6p21 were more frequent in ALK-negative ALCL when compared to ALK-positive ALCL, but gains of chromosome 7 and 6q and loss of 13q were commonly seen in both subtypes (Salaverria et al. 2008a). In rare ALK-negative ALCL cases expressing PAX5, numerical changes of the PAX5/9p13 locus have been detected (Feldman et al. 2010).
2.2.2 Mature B-Cell Neoplasms
The 2008 WHO classification of lymphoid malignancies recognizes 30 entities of mature B-cell neoplasms (Swerdlow et al. 2008). Two of them, diffuse large B-cell lymphoma (DLBCL) and follicular lymphoma (FL) account for approximately 66 % of all B-cell lymphoma; the prevalence of the remaining 28 subtypes ranges from less than 1 to 12 %. The available (cyto)genetic data of these rare B-cell lymphomas are reviewed below.
2.2.2.1 B-Cell Prolymphocytic Leukemia
B-cell prolymphocytic leukemia (B-PLL) is a rare lymphoid neoplasm characterized by peripheral blood, bone marrow, and splenic involvement by a clonal proliferation of prolymphocytes. The cytogenetic pattern of B-PLL has been poorly characterized due to the rarity of the disease, the difficulty in obtaining mitoses of the rather mature leukemic cells, and the overlap with other entities that previously may have been considered to be B-PLL. The t(11;14)(q13;q32)/CCND1/IGH rearrangement has previously been reported in up to 20 % of B-cell PLL cases (Brito-Babapulle et al. 1987); however, these cases are now considered leukemic manifestations of MCL (Ruchlemer et al. 2004). More recent studies that focused on confirmed cases of B-PLL showed the presence of complex karyotypes, with frequent abnormalities of chromosome 7 (Schlette et al. 2001). FISH analysis has been used in B-PLL to test for abnormalities at specific genetic loci; this resulted in detection of 13q14 deletions involving the RB1 gene in approximately 50 % of the cases. Additionally, deletions were frequently noted at band 11q23 and at 17p (TP53 locus) (Lens et al. 2000). None of the aberrations reported thus far in B-PLL have been disease specific.
2.2.2.2 Marginal Zone Lymphoma
Marginal zone lymphoma (MZL) encompasses three distinct entities: extranodal MZL of the mucosa-associated lymphoid tissue (MALT lymphoma), nodal MZL (NMZL), and splenic MZL (SMZL) (Swerdlow et al. 2008). It is believed that these indolent malignancies, which develop in different anatomical sites, originate from post-follicular memory B cells. MZL share several morphologic, immunophenotypic, and genetic features, including trisomies 3 and 18; however, the pathogenesis of these lymphomas is poorly understood.
MALT Lymphoma
MALT lymphoma represents 50–70 % of MZLs and involves a variety of extranodal sites. Approximately 25 % of MALT lymphomas harbor balanced chromosomal translocations (Remstein et al. 2006), including the most frequent t(11;18)(q21;q21.3) and less common t(1;14)(p22;q32), t(3;14)(p13;q32), t(14;18)(q32;q21.3), and t(X;14)(p12;q32) (Fig. 2.5). These translocations are mutually exclusive and occur at variable frequencies in MALT lymphoma of different sites.
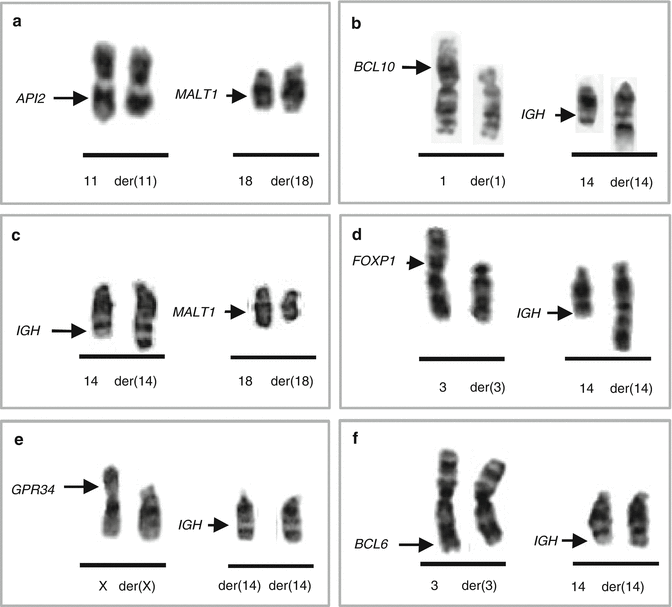

Fig. 2.5
MALT lymphoma-associated translocations and the involved genes. (a) t(11;18)(q21;q21.3)/API2-MALT1; (b) t(1;14)(p22;q32)/IGH-BCL10; (c) t(14;18)(q32;q21.3)/IGH-MALT1; (d) t(3;14)(p13;q32)/IGH-FOXP1; (e) t(X;14)(p11.2;q32)/IGH-GPR34; (f) t(3;14)(q27;q32)/IGH-BCL6
t(11;18)(q21;q21.3) typically occurs as the sole chromosomal aberration (Auer et al. 1997; Ott et al. 1997; Zhou et al. 2006). The translocation fuses the amino-terminus of the API2 (alias BIRC3) gene (11q21) with three intact BIR domains to the carboxyl-terminus of the MALT1 gene (18q21.3) containing an intact caspase-like domain, generating a functional API2-MALT1 fusion (Akagi et al. 1999; Morgan et al. 1999; Dierlamm et al. 2000a). API2 is an inhibitor of apoptosis, whereas MALT1 is involved in antigen receptor mediated NF-κB activation (Ruland et al. 2003). The t(11;18) is specific for extranodal MZL and occurs at variable frequencies in MALT lymphoma of different sites, being most frequent in tumors from lung (38–53 %), followed by those from stomach (24 %), conjunctiva (19 %), the intestine (12.5 %), and the ocular adnexa/orbit (3–14 %) (Streubel et al. 2004; Ye et al. 2003a). The translocation is rare or absent in MALT lymphomas from the skin, thyroid, salivary gland, and liver. The t(11;18) has been associated with adverse clinical features. Gastric MALT lymphomas with the t(11;18) are negative for H. pylori (Ye et al. 2003b) and hence do not respond to H. pylori eradication (Liu et al. 2001). Despite controversial initial data, recent studies suggest that t(11;18)-positive gastric MALT lymphomas evolve to a more aggressive DLBCL, as the API2-MALT1 fusion was detected in both gastric MALT lymphomas and gastric DLBCLs at approximately equivalent frequencies (Toracchio et al. 2009).
t(1;14)(p22;32) occurs in a small minority of MALT lymphomas and has not been observed in other lymphoma subtypes. The translocation brings the entire BCL10 gene under the regulatory control of IGH and, hence, dysregulates its expression (Willis et al. 1999; Zhang et al. 1999). BCL10 encodes a protein containing a caspase recruitment domain (CARD) homologous to that found in several apoptotic molecules. Experimental data indicate that BCL10 is essential for both the development and function of B and T lymphocytes, specifically connecting antigen receptor signaling to the NF-κB pathway (Ruland et al. 2001; Xue et al. 2003). The t(1;14) is primarily seen in intestine (12.5 %) and pulmonary (6.7 %) MALT lymphoma (Streubel et al. 2004). Of note, gastric MALT lymphomas with t(1;14) and/or a strong BCL10 nuclear expression do not respond to H. pylori eradication (Ye et al. 2006). Interestingly, the IGK variant translocation, t(1;2)(p22;p12), has been identified in a case of pulmonary MALT lymphoma (Chuang et al. 2007).
t(14;18)(q32;q21.3) associated with MALT lymphoma is molecularly different from the follicular lymphoma-related t(14;18)/IGH-BCL2, as it targets the MALT1 gene located 4.5 Mb proximal to BCL2 (Sanchez-Izquierdo et al. 2003; Streubel et al. 2003). Thus, MALT1 is rearranged by two different translocations in MALT lymphoma, either as a fusion partner of API2 in the t(11;18)(q21;q21.3) or being upregulated by IGH due to the t(14;18)(q32;q21.3). The latter translocation has also been observed in rare cases of extranodal DLBCL (Cook et al. 2003; Sanchez-Izquierdo et al. 2003). Amplification of the 18q21.3/MALT1 region, considered as an alternative mechanism of dysregulation of MALT1, was detected in cell lines derived from MZL as well as from Burkitt lymphoma and primary cutaneous DLBCL (Sanchez-Izquierdo et al. 2003). The t(14;18)/IGH-MALT1 also occurs at variable frequencies in MALT lymphoma of different sites (Murga Penas et al. 2003; Streubel et al. 2003, 2004), primarily in lymphomas from the liver (17 %), ocular adnexa (7 %), and lung (6 %), but was not found in those from the stomach, salivary gland, thyroid, and skin (Ye et al. 2005).
t(3;14)(p13;q32) is present in approximately 4 % of MALT lymphoma (Goatly et al. 2008). The translocation is mediated by IGH and dysregulates expression of FOXP1 (Streubel et al. 2005), which belongs to the Forkhead box (FOX) family of winged-helix transcription factors that play diverse biological functions. Experimental data indicate that FOXP1 is essential for development of B/T lymphocytes and monocytes (Hu et al. 2006; Shi et al. 2008; Feng et al. 2010). The t(3;14)/IGH-FOXP1 was detected in MALT lymphomas arising in the thyroid, ocular adnexa, skin, and stomach and, also, in rare cases of extranodal DLBCL (Streubel et al. 2005; Wlodarska et al. 2005; Haralambieva et al. 2006; Fenton et al. 2006; Goatly et al. 2008). Rare translocations of FOXP1 involving non-IG partner genes have also been reported (Wlodarska et al. 2005; Goatly et al. 2008). Notably, a significant fraction of MALT lymphomas and DLBCLs harbor a strong nuclear FOXP1 expression, which is independent from FOXP1 rearrangements and gains (Wlodarska et al. 2005; Sagaert et al. 2006a; Barrans et al. 2007). Some studies indicate that aberrant expression of FOXP1 in these tumors predicts poor prognosis (Barrans et al. 2004; Banham et al. 2005; Wlodarska et al. 2005) and transformation to DLBCL in MALT lymphomas (Sagaert et al. 2006b; Han et al. 2009).
t(X;14)(p12;q32) is a recently identified IGH-mediated chromosomal translocation affecting GPR34 (Baens et al. 2012), found in two cases of pulmonary MALT lymphoma and single cases of nodal MZL and gastric DLBCL. GPR34 encodes a G-protein-coupled receptor, belonging to the largest family of cell surface molecules involved in signal transduction (Lappano and Maggiolini 2011). These proteins play important roles in many physiological and pathological processes, including tumorigenesis. Thus fra, the functional consequences of t(X;14) remain unknow.
In addition, the DLBCL-related t(3;14)(q27;q32)/IGH-BCL6 was reported in sporadic cases of extranodal MZL (Dierlamm et al. 1997; Ye et al. 2008). Recently, novel IGH translocations targeting CNN3 (1p21.3), ODZ2 (5q34), or JMJD2C (9p24) were identified in single cases of MALT lymphoma (Vinatzer et al. 2008). Approximately 75 % of MALT lymphomas, however, do not harbor recurring translocations and their genetics is poorly understood. Trisomies or partial trisomies of several chromosomes including 3, 6p, 7, 8q, 9q, 11q, 12, and 18 are frequently observed in MALT lymphoma (Wotherspoon et al. 1995; Brynes et al. 1996; Dierlamm et al. 1996a; Streubel et al. 2004; Zhou et al. 2006; Kim et al. 2007; Rinaldi et al. 2011). Of note, trisomies 3, 12, and 18 are often concurrent and present in both translocation-negative and translocation-positive cases, with the exception of the (11;18). Recently, array CGH/SNP array studies identified loss of TNFAIP3/A20 (6q23) in 21.8 % of MALT lymphomas (Kato et al. 2009), preferentially in translocation-negative MALT lymphoma of the ocular adnexa and salivary gland (Honma et al. 2008; Chanudet et al. 2009).
NMZL
Nodal MZL is a heterogeneous disorder accounting for less than 2 % of all lymphoid malignancies (Nathwani et al. 1999; Berger et al. 2000) and approximately 10 % of MZL (Braggio et al. 2012). Genetic data are scarce for NMZL, and thus far, no typical genetic defects have been identified in this entity. In addition, most genetic lesions observed in NMZL can also be found in extranodal MZL, especially in MALT lymphoma (Brynes et al. 1996; Dierlamm et al. 1996a; Traverse-Glehen et al. 2006; Arcaini et al. 2009; Rinaldi et al. 2011; Braggio et al. 2012). Trisomies 3 and 18 detected in 20–30 % of NMZL cases can occur either as a sole genetic aberration or together; hence, it is unclear whether they represent primary or secondary cytogenetic changes. The molecular consequences of these imbalances remain elusive; however, a dosage effect of tumor-associated genes located on chromosome 3 (e.g., FOXP1, BCL6) and 18 (MALT1, BCL2) has been hypothesized. Other recurrent cytogenetic alterations in NMZL include imbalances of chromosomes 1; gain of 7q, 8q, and 13q (Rinaldi et al. 2011); and structural rearrangements of chromosome 1 (Dierlamm et al. 1996b). Focal imbalances detected by CGH in 15–25 % of NMZL include loss of 1p21.2–p22.1, 11q21–q22/ATM, 13q14.3, and 15q25.3–q26.2 and gain of 1q23.3–q25.3, 3q23–q24, and 12q13.13–q21.31 (Braggio et al. 2012). Deletions of the known tumor suppressor genes, including TP53, CDKN2A/p16, RB1, and TNFAIP3/A20, are absent or sporadic in NMZL (Dierlamm et al. 2000b; Novak et al. 2009; Braggio et al. 2012). Chromosomal translocations occurring in MALT lymphoma are usually not detected in NMZL. Rare exceptions include the t(X;14)/IGH-GPR34 (Baens et al. 2012) and t(3;14)/IGH-BCL6 (Traverse-Glehen et al. 2006).
SMZL
Splenic MZL represents approximately 20 % of MZL (Braggio et al. 2012). Current knowledge on the genetic background of SMZL is limited. Early cytogenetic, FISH, and metaphase CGH studies performed on small series of SMZL showed that the disease is frequently associated with a complex karyotype, deletion of 7q, trisomy or partial trisomy 3, and alterations of chromosomes 1, 8, and 14 (Oscier et al. 1993; Dierlamm et al. 1996b, 1997; Sole et al. 2001; Callet-Bauchu et al. 2005). No single aberration was present in all cases. These findings were recently confirmed by a multicenter study of 330 cytogenetically documented SMZL cases published by the International Splenic Lymphoma Group (Salido et al. 2010). Clonal cytogenetic aberrations were found in 72 % of SMZL, of which 28 % harbored a single chromosomal aberration and 53 % had complex karyotypes. Deletion of 7q was the most common aberration observed in 39 % of cases analyzed and also the most frequent single aberration (32 %); this anomaly was followed in frequency by gains of chromosome 3/3q (25 %), translocations involving 14q32 (12 %), deletion of 6q (11.7 %), trisomy 18 (10 %), deletion of 17p (8.7 %), trisomy 12 (8 %), and deletion of 13q (5 %). The breakpoints of the del(7q) were heterogeneous and the smallest overlapping region was defined as 7q32.1–q32.2. This aberration has been investigated by several groups (Mateo et al. 1999; Hernandez et al. 2001; Andersen et al. 2004; Vega et al. 2008; Watkins et al. 2010; Rinaldi et al. 2011), and currently the smallest commonly deleted region comprises approximately 3 Mb at 7q32.1–q32.2 (127.03–130.07 Mb) (Watkins et al. 2010). This region harbors 44 coding genes and a cluster of six microRNAs. Lack of evidence of homozygous deletions and/or microdeletions in this region, however, hampers identification of a putative tumor suppressor gene at 7q32. Given that del(7q) is preferentially associated with SMZL and rarely seen in other mature B-cell malignancies (Watkins et al. 2010; Rinaldi et al. 2011), this aberration is potentially valuable in SMZL diagnosis and differential diagnosis.
One-quarter of SMZL cases displayed gain of material from chromosome 3, particularly 3q (Gruszka-Westwood et al. 1999; Sole et al. 2001), due to various unbalanced translocations. Gain of chromosome 3 is frequently associated with trisomies 12 and 18, considered as secondary changes in SMZL (Brynes et al. 1996; Sole et al. 2001; Andersen et al. 2004).
Chromosomal translocations involving IG loci at 14q32, 2p12, and 22q11.2 were found in 12 % of SMZLs. These aberrations targeted at least 11 partner chromosomes/genes (1p34, 1p22, 1q21, 6p21/CCND3, 7q22/CDK6, 8q24.2/MYC, 9p13/PAX5, 9p11.3, 11q21, 12q23, 19q13.3/BCL3) and only sporadically occurred as a single anomaly. Some of these translocations were previously published in SMZL (Callet-Bauchu et al. 2005; Remstein et al. 2008). Of note, typical translocations associated with NHL, such as the t(11;14), t(14;18), and t(3;14), and MALT-lymphoma-associated translocations were not found in SMZL (Remstein et al. 2000; Salido et al. 2010). As in other B-NHL, a fraction of SMZL (18 %) showed loss of 17p/TP53 (Gruszka-Westwood et al. 2001; Salido et al. 2010). This aberration and 14q abnormalities are associated with a shorter survival. The del(7q), gain of chromosome 3/3q, +18, and del(6q) have no impact on survival.
2.2.2.3 Mantle Cell Lymphoma
Mantle cell lymphoma (MCL) is a well-defined neoplasm originating from naïve pre-germinal-center B cells, associated with an aggressive clinical presentation, poor response to therapy, and a short survival (Swerdlow et al. 2008). Cytogenetically, MCL is defined by the t(11;14)(q13;q32), a translocation that brings the CCND1 gene (the breakpoint region was previously known as BCL1) under transcriptional control of the regulatory sequences of IGH (Fig. 2.6a–b) (Tsujimoto et al. 1984; Williams et al. 1991). CCND1 encodes cyclin D1 which plays an important role in the regulation of the G1-S transition following mitotic growth factor signaling (Hunter and Pines 1994); its aberrant expression in MCL is routinely detected by IHC (Fig. 2.6c). Of note, the t(11;14)(q13;q32) is also noted in a subset of multiple myeloma and related disorders (Fonseca et al. 2003). Conventional cytogenetic analysis identifies the t(11;14) in 60–80 % of MCL (Li et al. 1999; Wlodarska et al. 1999; Au et al. 2002); however, FISH detects the IGH-CCND1 rearrangement in almost all MCL cases examined (Li et al. 1999; Bentz et al. 2000, 2004; Frater et al. 2001). FISH analysis is particularly recommended in MCL cases with atypical karyotypes, because the t(11;14) may be cryptic or masked by complex secondary alterations (Gruszka-Westwood et al. 2002; Aventin et al. 2003; Gazzo et al. 2005) (Fig. 2.6d–e). Sporadic MCL cases display variant 11q13/CCND1 translocations involving either IGK/2p12 or IGL/22q11.2 (Fig. 2.7) (Komatsu et al. 1994; Wlodarska et al. 2004a; Espinet et al. 2010; Rocha et al. 2011). Rare cases of MCL that are negative for the translocation and cyclin D1 have been identified. Interestingly, these lymphomas are similar to classical MCL with a typical morphology, transcriptome profile, and pattern of secondary genetic alterations, but they express high levels of either cyclin D2 or cyclin D3 (Fu et al. 2005; Salaverria et al. 2007; Hartmann et al. 2010) and do not express SOX11 (Mozos et al. 2009). As documented in several cases, an aberrant expression of cyclin D2 and D3 in t(11;14)-negative MCL is a consequence of IG translocations targeting CCND2 and CCND3, respectively (Gesk et al. 2006; Herens et al. 2008; Wlodarska et al. 2008; Quintanilla-Martinez et al. 2009; Shiller et al. 2011) (Fig. 2.8).
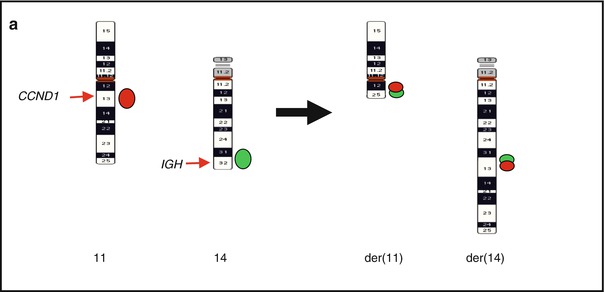
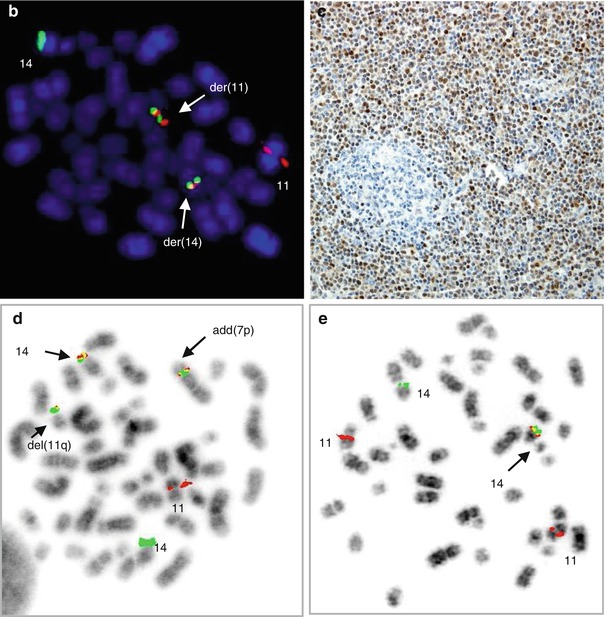
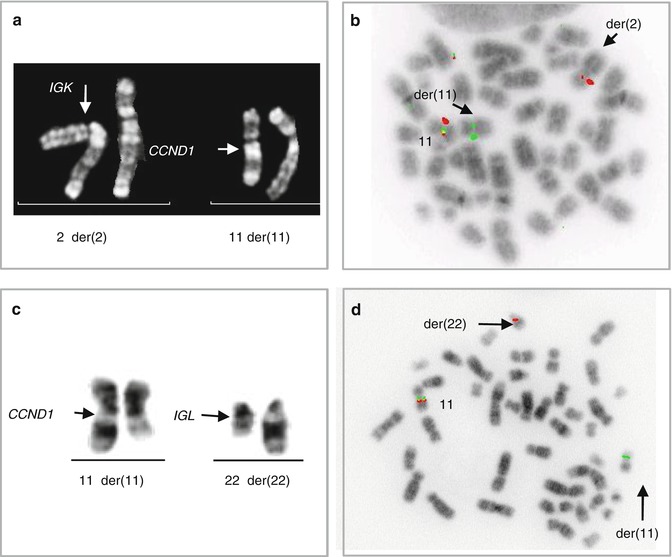
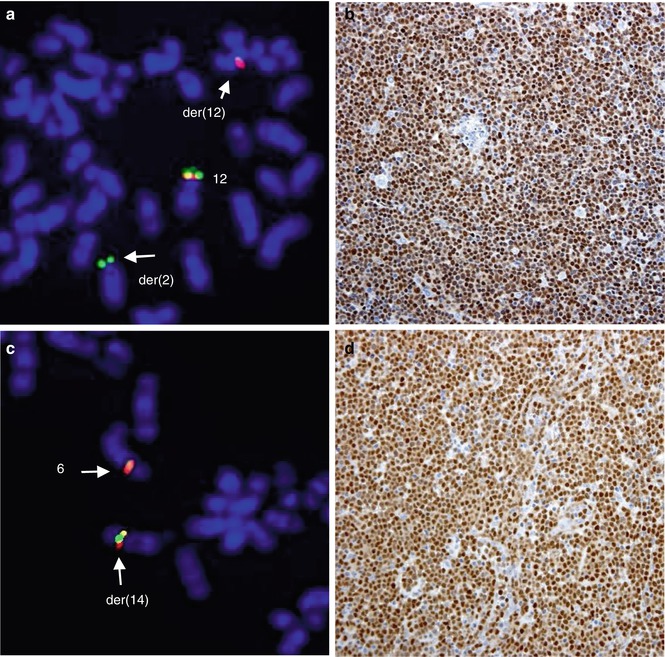


Fig. 2.6
Common and rare 11q13/CCND1 rearrangements in MCL. (a) Scheme of a classical t(11;14)(q13;q32) and distribution of FISH signals from the dual-color, dual-fusion LSI IGH/CCND1 probe; (b) FISH image of a metaphase cell with LSI IGH/CCND1; (c) an aberrant expression of cyclin D1 in MCL shown by IHC; (d) cryptic IGH-CCND1 fusion in case of t(11;14)-negative MCL detected with LSI IGH/CCND1; (e) cryptic insertion of CCND1 at 14q32/IGH in a case of t(11;14)-negative MCL detected with LSI IGH/CCND1 (Wlodarska et al. 2004a, unpublished data)

Fig. 2.7
Variant CCND1 aberrations in MCL. (a) Partial R-banded karyotype of t(2;11)(p12;q13) and (b) the related FISH image showing a rearrangement of CCND1 (CCND1 break-apart probe); (c) partial karyotype of t(11;22)(q13;q11.2) and (d) the related FISH image showing a rearrangement of CCND1

Fig. 2.8
Alternative translocations in t(11;14)-negative MCL. The t(2;12)(p12;p13)-associated rearrangement of CCND2 (CCND2 break-apart probe) (a) resulting in aberrant expression of cyclin D2 demonstrated by IHC (b); t(6;14)(p21;q32) affecting CCND3 (CCND3 break-apart probe) (c) and the underlying aberrant expression of cyclin D3 demonstrated by IHC (d) (Wlodarska et al. 2008)
Approximately one-third of MCLs have the t(11;14)(q13;q32) as a sole cytogenetic aberration or together with 1–2 additional chromosomal changes. Remarkably, these cases are usually associated with a leukemic (non-nodal) disease, an indolent clinical course, and a long survival (Fernandez et al. 2010; Royo et al. 2012). In contrast, classical aggressive MCLs display complex karyotypes characterized by a high number of nonrandom secondary chromosomal changes, initially shown by cytogenetic studies (Li et al. 1999; Wlodarska et al. 1999; Au et al. 2002) and further demonstrated by genome-wide screening approaches (reviewed by Royo et al. 2011). These aberrations are commonly associated with genomic gains and losses. Balanced translocations are infrequent in MCL. An exception is the t(8;14)(q24.2;q32)/IGH-MYC and variant MYC aberrations, which have been recurrently seen in MCLs with blastoid morphology (Tirier et al. 1996; Au et al. 2000; Vaishampayan et al. 2001; Hao et al. 2002; Michaux et al. 2004). As in the well-known MYC/BCL2 “double-hit” lymphomas, survival of patients with MCLs with MYC/8q24.2 alterations is extremely short.
The genomic profile of MCL was initially investigated using conventional CGH (Monni et al. 1998; Bea et al. 1999; Bentz et al. 2000; Martinez-Climent et al. 2001; Allen et al. 2002; Jarosova et al. 2004; Salaverria et al. 2007). These studies identified numerous recurrent genomic imbalances in MCL, of which the most frequent were losses of 1p, 6q, 8p, 9p, 10p, 11q, 13q, and 17p and gains of 3q, 7p, 8q, 12q, 15q, and 18q (Table 2.4, adapted from Royo et al. 2011). These findings were further confirmed using high-resolution CGH and SNP arrays that mapped the minimal regions of loss and gain and identified new submicroscopic deletions and duplications (Schaffner et al. 2000; Kohlhammer et al. 2004; Rubio-Moscardo et al. 2005; Schraders et al. 2005; Tagawa et al. 2005; Rinaldi et al. 2006; Flordal et al. 2007; Bea et al. 2009; Kawamata et al. 2009; Vater et al. 2009; Halldorsdottir et al. 2011). The results and candidate target genes are shown in Table 2.5. The genes postulated to be involved in the pathogenesis of MCL include TNFAIP3 (6q23), CDKN2A (9p21), ATM (11q22.3), RB1 (13q14), and TP53 (17p13) located in the recurrently deleted regions and BMI1(10p12), CDK4/MDM2 (12q14), and BCL2 (18q21.3), which are found to be gained and/or amplified in MCL. In addition, SNP array analysis identified CN-LOH events in up to 60 % of MCL (Bea et al. 2009; Kawamata et al. 2009; Vater et al. 2009; Fernandez et al. 2010; Hartmann et al. 2010; Halldorsdottir et al. 2011). CN-LOH frequently affects 6p, 9p, 11q, 17p, and 20q, which are recurrently deleted regions in MCL. Whether CN-LOH represents an alternative mechanism of biallelic inactivation of tumor suppressor genes remains to be determined.
Table 2.4
Recurrent secondary genomic alterations in MCL detected by CGH and potential target genesa
Monni et al. (1998) | Bea et al. (1999) | Bentz et al. (2000) | Martinez-Climent et al. (2001) | Allen et al. (2002) | Salaverria et al. (2007) | Jarosova et al. (2004) | |||
|---|---|---|---|---|---|---|---|---|---|
Number of cases | 27 | 45 | 27 | 28 | 30 | 77 | 30 | ||
% altered cases | 100 | 89 | 85 | 95 | 100 | 90 | 80 | ||
Mean numberof alterationsper case | 4 | 6 | 4 | 6 | 7 | 4 | 6 | ||
Chromosomal region | % cases | % cases | % cases | % cases | % cases | % cases | % cases | Minimal region | Potential target genes |
Loss 1p | 33 | 24 | 33 | 26 | 33 | 52 | 27 | 1p21–p22 | |
Loss 3p | 4 | 7 | – | 5 | – | 5 | – | 3p13–p14 | |
Loss 6q | 30 | 27 | 19 | 32 | 37 | 20 | 13 | 6q21–q22; 6q25–q26 | |
Loss 8p | 7 | 7 | 30 | 79 | 23 | 13 | 33 | 8p21–p22 | |
Loss 9p | 30 | 16 | 30 | 16 | 17 | 18 | 7 | 9p21 | CDKN2A |
Loss 9q | 15 | 13 | 14 | 5 | 13 | 21 | 20 | 9q21–q22 | |
Loss 10p | – | 18 | 11 | 10 | 17 | 3 | 17 | 10p14–p15 | |
Loss 11q | 30 | 22 | 19 | 26 | 27 | 28 | 37 | 11q22–q23 | ATM |
Loss 13q | 41 | 40 | 70 | 32 | 60 | 17 | 33 | 13q13–q14; 13q33–q34 | |
Loss 17p | 19 | 16 | 4 | 26 | 20 | 13 | 30 | 17p13 | TP53 |
Gain 3q | 52 | 49 | 37 | 37 | 70 | 32 | 40 | 3q27–q28 | |
Gain 7p | 15 | 27 | 7 | 5 | 23 | 8 | 7 | 7p22 | |
Table 2.5
Recurrent minimal regions and target genes detected in MCL by CGH and SNP arraysa
Loss/homozygous loss | SNPa(range %) | CGH(range %) | Candidate genes | Pathways |
|---|---|---|---|---|
Loss 1p21.2 | 17–55 | 29–50 | ||
Loss 1p22.2–p22.3 | 13–55 | 29–50 | ||
Loss 1p32.3–p33 a | 4–14 | – | CDKN2C, FAF1 | Cell cycle/cell survival |
Loss 1q32 | 5–18 | – | PROX1 | Proliferation |
Loss 2q13 a | 3–4 | 17 | BCL2L11 | Cell survival |
Loss 2q37.1 | 15–33 | – | SP100, SP140 | DNA damage |
Loss 6q23.3 | 19–23 | 26–36 | TNFAIP3 | NF-κB inhibitor |
Loss 6q25 | 19–28 | 23–36 | LATS1 | Hippo signaling pathway |
Loss 8p21.3 | 25–31 | 17–34 | MCPH1 | DNA damage |
Loss 9p21.2 | 19–24 | 10–36 | MOBKL2B
Stay updated, free articles. Join our Telegram channel
Full access? Get Clinical Tree
 Get Clinical Tree app for offline access

|

