Fig. 1
Lung cancer incidence and mortality rates by sex and age, United States, 2006–2010. Rates are per 100,000 and age-adjusted to the 2000 U.S. standard population
During 2006–2010, the average annual lung cancer incidence rate among United States men ranged from 1.3 cases per 100,000 in age 30–34 years to 585.9 in age 85–89 years. Among women, incidence ranged from 1.4 in age 30–34 years to 365.8 in age 75–79 years. The median age at diagnosis of lung cancer of men and women combined was about 70 years, with approximately 10 % of cases occurring in those younger than 55 years, 53 % in those 55–74 years, and 37 % in those 75 years and older [17].
Mortality patterns by age closely follow incidence patterns. In 2006–2010, mortality rates among men ranged from 0.6 per 100,000 among those 30–34 years to 522.8 among those 80–84 years. Mortality rates among women ranged from 0.5 per 100,000 among those 30–34 years to 291.2 among those 80–84 years. The median age at death from lung cancer for men and women combined was about 72 years, with about 9 % of deaths occurring among those younger than 55 years, 50 % in those 55–74 years, and 41 % in those 75 years and over [17].
Race/Ethnicity
During 2006–2010, male lung cancer incidence rates were highest among blacks (94.7 per 100,000), followed by non-Hispanic whites (82.9 per 100,000), American Indians/Alaska Natives (70.2 per 100,000), Asians/Pacific Islanders (48.8 per 100,000), and Hispanics (45.9 per 100,000) (Fig. 2). Among women, incidence rates were highest among non-Hispanic Whites (59.9 per 100,000), followed by American Indians/Alaska Natives (52.1 per 100,000), Blacks (50.4 per 100,000), Asians/Pacific Islanders (28.0 per 100,000), and Hispanics (26.6 per 100,000) (Fig. 2). These differences primarily reflect historical smoking patterns. Historically, black men smoked at higher rates than white men and men of other racial/ethnic groups. In contrast, black and white women historically smoked at similar rates. However, in the past few decades, black teenagers initiated smoking at lower rates than white teenagers.
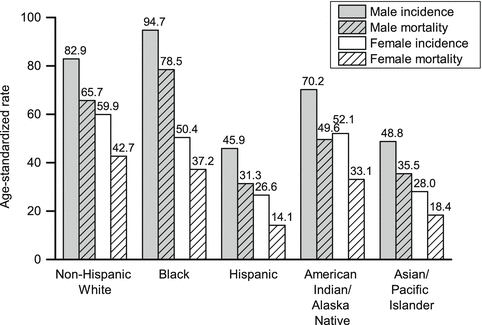
Fig. 2
Lung cancer incidence and mortality rates by sex and race/ethnicity, United States, 2006–2010. Rates are per 100,000 and age-adjusted to the 2000 U.S. standard population. Nonwhite race categories are not mutually exclusive of Hispanic origin (Source: Siegel et al. [2])
Among males, Blacks have the highest mortality rates, followed by non-Hispanic Whites; among females, non-Hispanic Whites have the highest mortality rates, followed by Blacks. Among both males and females, these are followed by American Indians/Alaska Natives, Asians/Pacific Islanders, and Hispanics (Fig. 2). However, it is worth noting that significant heterogeneity in lung cancer rates exist within these broad racial/ethnic groups according to geography and subpopulation. For instance, lung cancer incidence rates in 1999–2004 among American Indian/Alaska Native men range from 22.1 per 100,000 in the Southwest to 116.5 in Alaska. Among women, incidence rates in 1999–2004 range from 10.3 per 100,000 in the Southwest to 97.4 in the Northern Plains [18]. Among Asian Americans, lung cancer incidence rates in 2004–2008 ranged from 30.1 per 100,000 among Asian Indian and Pakistani men to 73.4 among Vietnamese men, while they ranged from 12.1 per 100,000 among Asian Indian and Pakistani women to 31.8 among Vietnamese women [19].
In men, lung cancer mortality rates have been decreasing in all racial/ethnic groups except American Indians/Alaska Natives during the most recent time period (Fig. 4). However, the magnitude of the decreases vary by race/ethnicity. From 2001 to 2010, rates decreased annually by an average of 3.3 % in Black males, 2.8 % in Hispanics, 2.4 % in Whites, and 1.6 % in Asians/Pacific Islanders, while rates were stable in American Indians/Alaska Natives [20]. Among females, lung cancer mortality rates are decreasing among all racial/ethnic groups except American Indians/Alaska Natives and Asians/Pacific Islanders (Fig. 4). From 2001 to 2010, rates decreased annually by an average of −1.1 % in Hispanic females, −1.0 % in Black females, and −0.9 % in Whites, while rates remained stable in American Indians/Alaska Natives and Asians/Pacific Islanders [20].
Sex
Lung cancer mortality rates among females have historically been lower than males, peaking at about 40 deaths per 100,000, or about half of the peak rate of 90 deaths per 100,000 among males (Fig. 3). These patterns are similar when broken down by racial/ethnic group (Fig. 4).
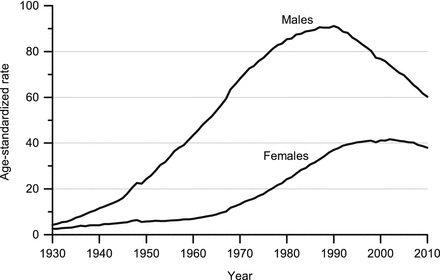
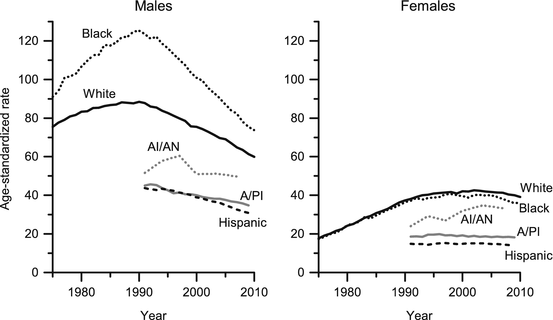
Fig. 3
Lung cancer mortality rates by sex, United States, 1930–2010. Rates are per 100,000 and age-adjusted to the 2000 U.S. standard population. Due to changes in ICD coding, numerator information has changed over time; rates include deaths from lung, bronchus, pleura, trachea, mediastinum, and other respiratory organs (Source: US Mortality Volumes 1930–1959, US Mortality Data 1960–2010, National Center for Health Statistics, Centers for Disease Control and Prevention)
Fig. 4
Lung cancer mortality rates by sex and race/ethnicity, United States, 1975–2010. Rates are per 100,000 and age-adjusted to the 2000 U.S. standard population. Rates for American Indians/Alaska Natives are based on the Contract Health Service Delivery Area counties. Hispanic is not mutually exclusive from whites, blacks, Asian/Pacific Islanders, and American Indians/Alaska Natives. Data for whites rather than non-Hispanic whites is presented because ethnicity data was not available prior to 1990. Mortality data for Hispanics exclude cases from Connecticut, the District of Columbia, Louisiana, Maine, Maryland, Minnesota, Mississippi, New Hampshire, New York, North Dakota, Oklahoma, South Carolina, Vermont, and Virginia. Abbreviations: AI/AN American Indian/Alaska Native; A/PI Asian/Pacific Islander
Lung cancer incidence and mortality among males began to increase around the 1920s following the uptake of smoking among men around the turn of the twentieth century [1]. Lung cancer mortality has been decreasing among men since the early 1990s, reflecting widespread smoking cessation that began around 1964 with the release of the United States Surgeon General’s report, which concluded that smoking was causally related to lung cancer [21]. Lung cancer incidence and mortality rates among women began to increase in the 1960s (Fig. 3), reflecting the later uptake of smoking among women around the 1930s and 1940s [22]. Smoking cessation among women in the United States began around the 1980s, [22] and mortality rates have been decreasing among women since the 2000s [17].
Socioeconomic Status
Lung cancer rates are primarily linked to socioeconomic status through smoking patterns. In the United States, those with more education and resources are more likely to quit or not initiate smoking [23, 24]. In 2012, smoking prevalence among adults was 32.1 % among those with a 9–11th grade education, 23.1 % among those with a high school education, and 9.1 % among college graduates [25]. The smoking prevalence among those below the poverty threshold was 27.9 %, while the prevalence among those at or above the threshold was 17.0 % [25]. People with a high school diploma or an incomplete high school education are less likely than those with a partial or complete college education to attempt to quit smoking [26].
The higher smoking prevalence among individuals of lower socioeconomic status is reflected in higher lung cancer rates. Among a cohort of US cancer patients diagnosed between 1973 and 2001, the lung cancer incidence rate among men with less than a high school diploma was 166.6 per 100,000, while the rates among high school graduates and college graduates were 123.9 and 57.6, respectively. The relationship was similar among women, with an incidence rate of 71.6 among those with less than a high school diploma, followed by rates of 59.1 among high school graduates and 35.9 among college graduates [27]. In the same cohort, rates also demonstrated a similar trend by family income, ranging from 91.0 per 100,000 among men in the highest income group to 150.9 among men in the lowest income group; rates among women were 45.9 in the highest income group and 81.4 in the lowest income group [27].
Geographic Variation
There is significant regional and state variation in lung cancer rates (Table 1) [13]. Among males, lung cancer mortality rates during 2006–2010 ranged from 27.5 in Utah to 97.1 in Kentucky. Rates were also high in Mississippi (95.4), Arkansas (90.1), Tennessee (89.5), and Alabama (87.4). The lung cancer burden is generally highest in states where tobacco has historically been grown and processed [13]. In addition to Utah, mortality rates were low in New Mexico (43.4), Colorado (44.2), California (47.2), and Hawaii (48.8). Among females, mortality rates during 2006–2010 ranged from 16.8 in Utah to 55.8 in Kentucky. The low rates in Utah can be attributed to the cultural prohibition against smoking among the large Mormon population [13]. Other states with low rates include Hawaii (25.9), New Mexico (28.6), Colorado (31.3), and North Dakota (32.2). Other states with high rates in women were West Virginia (50.9), Delaware (47.7), Indiana (46.7), Oklahoma (46.6), and Tennessee (46.6).
Table 1
Lung cancer incidence and mortality rates (per 100,000 population, age-adjusted to the 2000 Standard US population) by sex, race, and state, United States, 2006–2010
All races | White | Black | ||||||||||||||||
|---|---|---|---|---|---|---|---|---|---|---|---|---|---|---|---|---|---|---|
Both sexes | Males | Females | Both sexes | Males | Females | Both sexes | Males | Females | ||||||||||
State | Incidence | Mortality | Incidence | Mortality | Incidence | Mortality | Incidence | Mortality | Incidence | Mortality | Incidence | Mortality | Incidence | Mortality | Incidence | Mortality | Incidence | Mortality |
Alabama | 74.9 | 60.3 | 103.2 | 87.4 | 54 | 40.8 | 77.5 | 62.1 | 103 | 86.9 | 58.2 | 43.6 | 65.1 | 54 | 105 | 90.9 | 39 | 30.6 |
Alaska | 70.8 | 52.8 | 83.8 | 61.8 | 60.4 | 45.8 | 68.6 | 50.9 | 78.3 | 58.1 | 60.6 | 45.2 | 62.8 | 51 | ^ | ^ | ^ | ^ |
Arizona | 54 | 40.6 | 61.8 | 49.8 | 47.9 | 33.2 | 55.3 | 41.8 | 63 | 51 | 49.1 | 34.3 | 53.3 | 42 | 59.7 | 55.2 | 49.2 | 32.8 |
Arkansas†‡ | 81.1 | 64.6 | 108.4 | 90.1 | 60.4 | 45.4 | 81.6 | 64.9 | 107.5 | 89.1 | 61.8 | 46.5 | 77.8 | 65.6 | 117.6 | 104.8 | 50.3 | 39.1 |
California | 51.2 | 38.7 | 60.4 | 47.2 | 44.4 | 32.3 | 52.9 | 40 | 60.8 | 47.6 | 47 | 34.4 | 63.8 | 50.9 | 81.1 | 67.2 | 51.7 | 39.3 |
Colorado | 49.2 | 36.7 | 56.1 | 44.2 | 44.2 | 31.3 | 49.4 | 36.9 | 56.1 | 44.1 | 44.7 | 31.7 | 54.9 | 43.8 | 65.8 | 56.5 | 47.1 | 34.7 |
Connecticut | 66.1 | 44.2 | 75.5 | 52.7 | 59.5 | 38.2 | 66.9 | 44.8 | 75.2 | 52.7 | 61.3 | 39.3 | 60.3 | 42 | 80.5 | 58.6 | 46.3 | 31 |
Delaware | 74.9 | 56.4 | 87.1 | 68.2 | 65.8 | 47.7 | 76.6 | 57.5 | 87.9 | 68.6 | 68.1 | 49.2 | 67.9 | 53.1 | 84.4 | 68.9 | 56.1 | 41.6 |
Washington DC | 60.3 | 46.1 | 77.5 | 61.9 | 48.1 | 35 | 39.4 | 31.4 | 46.6 | 37.6 | 32.8 | 25.8 | 71.5 | 55.3 | 97 | 78.6 | 55.1 | 40.6 |
Florida | 66.8 | 48.8 | 79.4 | 61.4 | 56.7 | 38.8 | 68.4 | 50 | 79.7 | 61.8 | 59.3 | 40.5 | 53.6 | 41.1 | 78.6 | 63.7 | 35.8 | 25.4 |
Georgia | 71 | 52.9 | 93.3 | 73.1 | 55 | 38.7 | 74.6 | 55.2 | 94.2 | 73.7 | 60.1 | 41.7 | 62.5 | 48.1 | 94.5 | 75 | 42.6 | 31.8 |
Hawaii | 50 | 36 | 64.3 | 48.8 | 38.7 | 25.9 | 55.1 | 42.8 | 62.6 | 50 | 48.5 | 36.4 | 46.3 | 39.8 | ^ | ^ | ^ | ^ |
Idaho | 53.5 | 41 | 61.5 | 49.2 | 47.2 | 34.5 | 53.5 | 41.3 | 61.7 | 49.6 | 47.2 | 34.7 | ^ | ^ | ^ | ^ | ^ | ^ |
Illinois | 71.5 | 51.8 | 86.7 | 65.8 | 60.9 | 41.9 | 71.4 | 51.4 | 85.4 | 64.6 | 61.5 | 42 | 81.7 | 63.2 | 106.6 | 86.3 | 65.5 | 48.6 |
Indiana | 77.4 | 60.5 | 96.4 | 79.4 | 63.5 | 46.7 | 77.1 | 60.4 | 95.6 | 79 | 63.7 | 46.9 | 84.4 | 68.1 | 111.5 | 94.7 | 65.6 | 50.4 |
Iowa | 67.6 | 49.3 | 84.7 | 64.1 | 54.9 | 38.3 | 67.4 | 49.3 | 84.4 | 63.9 | 54.7 | 38.4 | 101.3 | 71.9 | 128.4 | 97.2 | 82.1 | 52 |
Kansas | 65.7 | 51.2 | 80.2 | 66.8 | 54.5 | 39.4 | 65.2 | 50.7 | 79.4 | 65.9 | 54.3 | 39.1 | 76.5 | 64 | 95.6 | 86.5 | 62.8 | 48.9 |
Kentucky | 99.6 | 73.2 | 125.9 | 97.1 | 80.3 | 55.8 | 99.8 | 73.2 | 125.6 | 96.7 | 80.7 | 56 | 106.8 | 80.7 | 144.2 | 114.1 | 82.9 | 59.1 |
Louisiana | 75.7 | 59.4 | 99.6 | 80.9 | 57.7 | 43.6 | 74.9 | 58.4 | 94.5 | 76.1 | 60 | 45.3 | 79.5 | 63.7 | 118.4 | 98.4 | 53 | 40.3 |
Maine | 77.5
Related posts:Stay updated, free articles. Join our Telegram channel
Full access? Get Clinical Tree
 Get Clinical Tree app for offline access

| |||||||||||||||||
