Fig. 6.1
The preclinical phase in cancer screening
6.2.2 Cancer Prevalence
Another key attribute for screening is a cancer’s prevalence, particularly in its preclinical phase [4]. Prevalence is a function of the incidence of the disease and its duration in its preclinical phase. Thus, if the incidence of a cancer is low or the duration between biological onset of a tumor and symptomatic disease is short, the cancer’s prevalence will be too low to make population-based screening effective. Recent screening in a population can also decrease the frequency of preclinical disease in a population. Although the prevalence of a cancer may be low in the general population, it may be possible to define a subgroup of individuals with an increased likelihood of the cancer based on risk factor profiles. For example, the prevalence may be higher for lung cancer among long-term cigarette smokers, hepatocellular carcinoma among carriers of the hepatitis B virus, or mammography screening among women who carry mutations in BRCA1. If the relation between these factors and cancer incidence is of sufficient strength, prevalence in these subgroups may be high enough for screening to be useful.
6.2.3 Cancer Metastases and Mortality
The development of metastatic disease in cancer is the major cause of cancer death in patients. A key goal of cancer screening is to identify and treat cancer at a window of time before the metastasis has occurred. For a cancer to be suitable for screening, the rate of metastasis or death should be sufficiently high. Moreover, earlier intervention and treatment before symptoms occurs should lead to substantial reductions both in morbidity from the cancer and its treatment and in its mortality. As a corollary, screening requires a clear understanding of the cancer’s natural history, including the rate at which the disease in its various forms progresses, an understanding of the signs and symptoms of the different forms of disease, and the cancer’s amenability at each phase to treatment. Most cancer sites do have sufficiently high risks of metastasis and cancer death to warrant screening.
6.3 Characteristics of a Suitable Screening Test
There are several prerequisite criteria for the suitability of a screening test. The test should be relatively simple to administer and perform. For example, if the screening tool requires extensive training or its methodology is complex, there can be considerable variation in how well the test is administered across centers. The test should be rapid, both in its conduct and in its turnaround time to obtain results. The test should have a relatively low cost to benefit ratio. The screening tool and its follow-up exams should be safe, and should cause as little discomfort or potential harm as possible. This is of particular importance since the majority of individuals screened will not have the cancer of interest. Colonoscopy for colorectal cancers notably challenges some of these key tenets of suitability. For the patient, there is some discomfort associated with the colonoscopy preparation, and the procedure itself often requires sedation. The diagnosis of most cancers requires a follow-up biopsy after a positive screening result, and the biopsy can carry risk of discomfort, pain, and infection.
The immediate goal of screening is to correctly identify as positive those individuals who have a cancer in the preclinical phase and as negative those without cancer. Thus, the reliability and validity of the screening tool are essential to effective cancer screening. Reliability refers to the ability of the test to give the same result, whether correct or incorrect, on repeated applications of the test in the same person with a given level of disease [5]. Reliability depends on the intrinsic variability of the factor being measured, the variability of the method used, the skill of the individual performing the measurement and the accuracy of interpretation of the test results. For example, if the screening tool uses a biomarker level, it is critical to understand whether there are diurnal or other variations in these levels independent of the disease itself. Moreover, it is important that the test is reliably measured, whether in a small clinic or large teaching hospital.
6.3.1 Sensitivity and Specificity
Sensitivity and specificity are the most commonly used measures of a screening tool’s validity to estimate how well the tool correctly classifies someone as having or not having the disease [5]. The screening tool is compared to a gold standard that is accepted as the means by which the presence or absence of a particular disease is established. Figure 6.2 provides a contingency table, which cross-classifies individuals based on the results of a screening test compared to information on an individual’s disease status as determined by the gold standard. In this table, “a” represents true positives, or individuals who truly have the disease of interest and are correctly classified by the screening test, “d” represents true negatives, or individuals who truly do not have the disease, “b” represents false positives, or individuals who are incorrectly labeled by the screening test as having the disease, and “c” represents false negatives, or individuals incorrectly labeled by the test as being negative when in fact they have the disease.
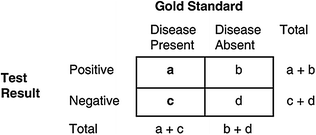

Fig. 6.2
A 2 × 2 contingency table for determining test characteristics of a screening test: sensitivity, specificity, positive, and negative predictive values
Sensitivity indicates the proportion of individuals with cancer correctly classified by the screening test as having the disease. It is calculated as: True positives (a)/[True positives (a) + False negatives (c)]. The number of false negatives is determined largely by the sensitivity of a test, and also depends on the distribution of preclinical disease stages in the population selected for testing [3, 5]. When cancer is early in the preclinical phase, it is more difficult to detect by a screening test, and the detectability of the disease tends to increase as the preclinical phase progresses [4]. Thus, change in detectability of each case as the disease progresses suggests a sensitivity function, whereby sensitivity increases according to the point in the preclinical phases at which cases are tested [4].
There can therefore be real challenges in determining sensitivity, since the number of individuals who truly have the disease must be determined by another (diagnostic) test. Depending on the cancer, it may be challenging to apply a definitive diagnostic test to asymptomatic individuals. In addition, a screening test may not be as sensitive when applied to a different population [5]. Finally, sensitivity will appear relatively high in the first screening of a population since there is a pool of prevalent preclinical cases.
Specificity is the probability that individuals without cancer will be correctly classified by the screening test as being disease-free. This is calculated as the number of patients without disease who test negative divided by the total number without cancer [True negatives (d)/True negatives (d) + False positives (b)]. The same conceptual difficulties emerge in estimating specificity as in determining sensitivity, since knowledge of numbers in the denominator must be determined on the basis of a given diagnostic test that may or may not in actuality be a true gold standard. For many cancers, the diagnostic tests have inherent risks, and therefore would not be done on asymptomatic people with negative screening test results.
Biomarkers often provide information on a continuous scale. Screening tests that use a biomarker will make decisions about positivity and negativity at a dichotomous cutoff point, such that values above a certain level will indicate a decision for further testing. Receiver operator characteristic (ROC) curves provide a graphic display for studying the effects of using different cutoff points on the performance of a screening test or as a method for comparing competing screening tests. The ROC plots the true-positive rate (Sensitivity) against the false positive rate (1—Specificity) and illustrates the trade-off that exists between them. Defining a specific cutoff point requires tradeoffs. Changing a cutoff point to improve sensitivity will lead to concomitant decreases in specificity, and conversely changing it to improve specificity will decrease sensitivity. The area under the curve is a measure of the test’s accuracy. An area that equals 1 indicates a perfect test, while an area that equals 0.5 indicates that the test did no better in predicting disease than chance alone.
For serious diseases it is often best to optimize sensitivity (and thus reduce the number of false negatives), particularly when the subsequent diagnostic test is of low risk to the individual and of relatively low cost. For cancer, this will avoid a missed early diagnosis, which could allow the disease to progress to a more advanced phase before the emergence of symptoms prompt further diagnostic tests. However, in this setting the specificity will be decreased, prompting more falsely positive diagnoses, more retrospectively unnecessary tests and patient anxiety over a disease that ultimately is proven not to be present.
In contrast, it may be preferable to optimize specificity (and thus reduce false positives) when the disease is of low risk for progression and therefore of low consequence, particularly when the subsequent diagnostic tests are of high attendant risk and cost. In these instances, not making a diagnosis earlier may be of benefit in avoiding intensive and protracted treatments. The exception to this might involve an opportunity of facilitating the efficacy of treatments for an earlier phase of disease or even of reversing its full manifestation so that a later expression, even if indolent, can be avoided.
The primary screening tool for prostate cancer is the blood biomarker prostate-specific antigen, PSA. Clinically, a man would come to his physician for a usual-care medical visit without any symptoms, and have a blood drawn. The blood level of PSA provides the patient and his physician information on how likely or less likely he is to have prostate cancer. PSA blood levels are continuous, and a cut point of 4.0 ng/ml or higher generally is used to determine if a follow-up prostate biopsy is needed. Within the Prostate Cancer Prevention Trial (PCPT) study, a PSA of 4.0 ng/ml or higher has a sensitivity of 20 % and a specificity of 98 %. Given this estimate of sensitivity, 20 % of men with prostate cancer will be correctly classified as having prostate cancer with a cutpoint of 4.0 or higher, and the false negative rate is 80 %. Given this estimate of specificity, 98 % of men without prostate cancer will be correctly classified as not having prostate cancer, and the false positive rate is 2 %.
6.3.2 Positive and Negative Predictive Value
Two additional measures of the validity of a test are its positive predictive value (PPV) and negative predictive value (NPV). PPV is the proportion of individuals classified by the screening test as having the disease among the total number of individuals who have tested positive [True positives (a)/True positives (a) + False positives (b)]. The number of false positives is determined primarily by the specificity of the test because the number of non-diseased individuals in most settings greatly exceeds the number of diseased individuals. Thus, a small decrease in specificity may lead to a very large increase in the number of false positives and thus a large decrease in the PPV. If a positive test result is followed by a repeat screen test or other noninvasive procedure, then a low PPV may be acceptable to the population. However, if a positive screening test is followed by an expensive or potentially harmful diagnostic evaluation, then it is important to use a test that has a high PPV (i.e., a low number of false positive results, indicated by a good specificity). The PPV may influence acceptance of a screening program by the target population, since when the PPV is low a positive screening test represents a false alarm more often, consequently leading to unnecessary testing and anxiety. For instance, the PPV of mammography for breast cancer in screened populations such as the United States is estimated to be between 15 and 30 %.
The NPV is the proportion of individuals classified by the screening test as being disease-free who do not have the disease. This is represented in the contingency table as true negatives (d)/False negatives (c) + True negatives (d). A test with an NPV that approximates a value of 1 indicates that testing negative on the test will be reassuring. However, if the NPV is <1 by a value comparable to that of the prevalence of preclinical disease, then most of the preclinical disease will be missed, and the screening test will have a large number of false negative results. A low NPV is more likely to be the result of poor sensitivity than poor specificity.
Stay updated, free articles. Join our Telegram channel

Full access? Get Clinical Tree


