Cancer bioinformatics
John N. Weinstein, MD, PhD
Overview
Bioinformatics is a rapidly developing scientific field in which computational methods are applied to the analysis and interpretation of biological data, usually at the cell or molecular level and usually in the form of large, multivariate datasets. In the context of cancer, the most frequent scenario is molecular profiling at the DNA, RNA, protein, and/or metabolite level for basic understanding of the biology, for identification of potential therapeutic targets, and/or for clinical prediction. The new massively-parallel sequencing technologies are generating a data deluge—literally quadrillions of numbers in all—that strain the capacity of our hardware, software, and personnel infrastructures for bioinformatics; hence, the computational aspect of a sequencing project is now generally more expensive and time-consuming than the laboratory work.
Bioinformatic analysis can be hypothesis-generating or hypothesis-testing. When it is hypothesis-generating, the assumption is that one can afford a large number of false-positive findings in order to identify one or a few evocative or useful ones; when it is hypothesis-testing, the full rigor of statistical inference should be applied. A large number of statistical and machine-learning algorithms, scripts, and software packages are now available for the analysis, and options are multiplying rapidly. Because the datasets are often so large, however, an important aspect of bioinformatics is data visualization, for example display of data arrayed along the length of the genome or, most commonly, in the form of a clustered heat map.
Cancer biologists and clinical researchers should preferably take the lead in biological interpretation of the massive datasets, but statistical analysis should be done by (or under the vigilant aegis of) a professional in informatics; when there are more variables (e.g., genes) than cases (e.g., patients), there is a tendency for the untrained to obtain overly optimistic p-values or see false patterns in even randomized datasets. In addition, subtle errors that arise in the unglamorous tasks of data management and pre-processing often lead to misleading or frankly wrong conclusions from the data.
As high-throughput molecular profiling projects have become cheaper and easier, they have been incorporated progressively into the work of individual institutions, both academic and commercial. However, there are also growing numbers of large-scale public projects in the domain. At the level of cell lines, the first was the NCI-60, a panel of 60 human cancer lines used since 1990 by the U.S. National Cancer Institute to screen more than 100,000 chemical compounds plus natural products for anticancer activity. That panel was followed more recently by the Cancer Cell Line Encyclopedia, the Genomics of Drug Sensitivity in Cancer project, and others. At the clinical level, The Cancer Genome Atlas project has been center-stage, profiling more than 10,000 human cancers of 33 different types, and there is an alphabet-soup of acronyms for other such projects that are in progress or on the drawing board. Those projects, which require massive bioinformatics support, have spawned robust communities of bioinformatics expertise and served as testbeds for the development of new algorithms, software, and visualizations.
I can assure you that data processing is a fad that won’t last out the year.
– Editor for a major publishing house, 1957
A generation ago, the results of most laboratory studies on cancer could be processed in a simple spreadsheet and the results written into a laboratory notebook. The data were generally analyzed by experimentalists themselves, using very basic statistical algorithms. That landscape shifted progressively with the advent of microarrays in the mid-1990s and then massively parallel “second-generation” (or “next-generation”) sequencing a decade later. At the turn of the millennium, there was a prediction—only half in jest—that most biomedical researchers would soon abandon the wet laboratory and be hunched over their computers, mining the data produced by “biology factories.” That has not happened, of course; small wet laboratories are thriving. But we do see increasing numbers of biology factories, prominent among them the high-throughput sequencing centers. And, overall, the trend toward computation is unmistakable. That trend is largely a result of new, robotically-enhanced technologies that make it faster, cheaper, and more reliable to perform the laboratory portions of large-scale molecular profiling projects and screening assays. As a result, large centers and also small laboratories can churn out increasingly robust streams of data. Those trends have conspired to produce massive datasets that often contain many billions or trillions of entries, requiring more complex, larger-scale, often subtler statistical analyses and “biointerpretive” resources.
Just as the ‘Light-Year’ was introduced for astronomical distances too large to be comprehended in miles or kilometers, the ‘Huge’ (Human Genome Equivalent; about 3.3 billion base-pairs) can be defined for genomics. All of Shakespeare’s writings (plays, sonnets, and poems) contain a little over 5 million letters, less than 0.002 Huge. Storage, management, transmission, analysis, and interpretation of data are now most often the bottlenecks, not wet-laboratory data generation itself. The data deluge has variously been likened to an avalanche, a flood, a torrent, or a tsunami. Hence the rise and kaleidoscopic advance of bioinformatics, a multidisciplinary field based on statistics, computer science, biology, and medicine—a field crucial to current biomedical research and clinical progress but still in what might be characterized as an awkward adolescent phase.
The aim of this chapter is not to provide a comprehensive treatment of the sprawling, rapidly evolving arena of cancer bioinformatics. That would, in any case be impossible to do at any depth in the space available. Some sub-fields, for example analysis of the metabolome and the structural analysis of proteins and nucleic acids, will, unfortunately, be short-changed.
The aim is also not (with apologies) to give due credit to pioneers in the field or to cite all of the tools and resources that deserve mention. Rather, the aims are (1) to illuminate some generic aspects of cancer bioinformatics in its current and likely future states; (2) to highlight a sample of the statistical algorithms, computational tools, and data resources available; and (3) to showcase some issues that should be borne in mind by the nonspecialist who is trying to navigate the bioinformatics literature, to comprehend what bioinformatician collaborators are doing, or to use bioinformatics in a project for a better understanding of cancer or for the direct benefit of cancer patients and their families.
The definition and scope of bioinformatics
Definition of “bioinformatics”
The term “bioinformatics” is not new. It first appeared in print in 1970 with a very broad meaning,1 but its definition, as applied currently, is a matter of almost Talmudic debate. Multiple committees, academic surveys, and publications have struggled with the subject, even attempting to distinguish between “bioinformaticians” and “bioinformaticists”.2 For present purposes, an extended definition of bioinformatics attributed to the U.S. National Center for Biotechnology Information (NCBI) will suffice: “Bioinformatics is the field of science in which biology, computer science, and information technology merge into a single discipline. There are three important sub-disciplines within bioinformatics: the development of new algorithms and statistics with which to assess relationships among members of large data sets; the analysis and interpretation of various types of data including nucleotide and amino acid sequences, protein domains, and protein structures; and the development and implementation of tools that enable efficient access and management of different types of information.”
There can be no definitive line of demarcation between bioinformatics and related or overlapping disciplines such as computational biology and medical informatics. Computational biology “involves the development and application of data-analytical and theoretical methods, mathematical modeling and computational simulation techniques to the study of biological, behavioral, and social systems.”3 It includes, but extends far beyond, the focus on biological molecules characteristic of bioinformatics. Medical informatics has been defined as “the field of information science concerned with the analysis and dissemination of medical data through the application of computers to various aspects of health care and medicine.”4 Medical informatics is closely tied to the practical needs of clinical research and clinical practice, whereas bioinformatics is more closely allied with pre-clinical research. However, the two meet—and should synergize—in such projects as biomarker-driven clinical trials.
In the end, a word means what we collectively choose it to mean, and the best way to get a feel for the extent of the field is to list some key words associated with it. As per the famous dictum of U.S. Supreme Court Justice Potter Stewart, “I know it when I see it.” The ingredients of most bioinformatics projects include biological molecules, large databases, multivariate statistical analysis, high-performance computing, graphical visualization of the molecular data, and biological or biomedical interpretation. Typical sources of data for bioinformatic analysis include microarrays, DNA sequencing, RNA sequencing, mass spectrometry of proteins and metabolites, histopathological descriptors, and clinical records. Some of the salient datasets originate within studies being conducted in particular laboratories, but large, publicly available databases and search resources are playing ever-larger roles.
Questions typically addressed by bioinformatic analysis and interpretation
Questions addressed by bioinformatic analysis relate to biological mechanisms, pathways, networks, biomarkers and biosignatures, macromolecular structures, subsetting of cancer types, early detection, and prediction of clinical outcome variables such as risk, survival, metastasis, response to therapy, and recurrence. The paradigmatic bioinformatics project—the type that will be cited throughout this chapter—involves the design, statistical analysis, and biological interpretation of molecular profiles. Figure 1 shows a schematic view of the specimen and information flows in a generic sequencing project whose aim is to identify mutational and/or DNA copy number aberrations as possible biomarkers. The data from such studies can also be used to subset cancers or to make direct comparisons such as tumor versus paired normal tissue, tumor type versus tumor type, responder versus nonresponder, metastatic versus nonmetastatic, or primary versus recurrent cancer.
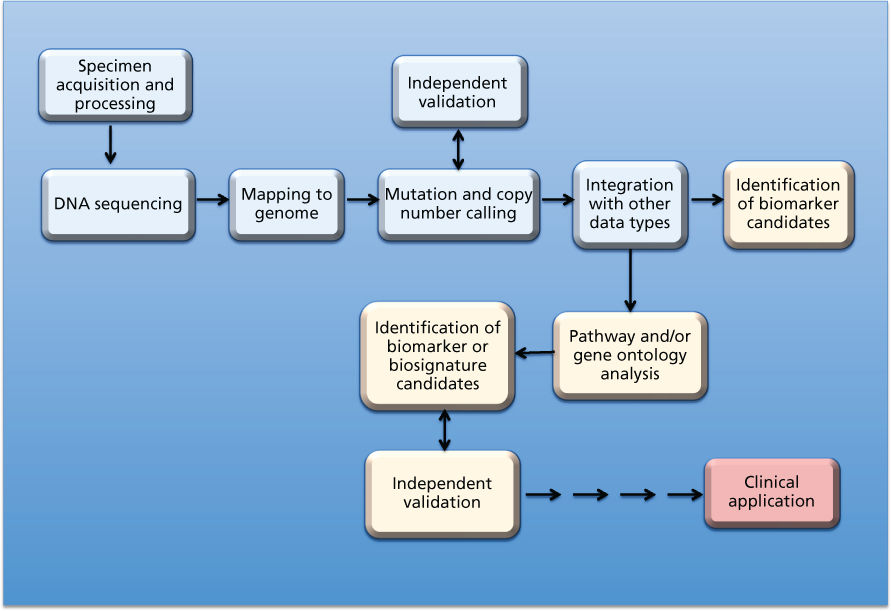
Figure 1 Schematic view of specimen and information flows for sequencing of cancers to identify mutations and/or copy number aberrations as possible biomarkers for clinical application. Amber boxes indicate downstream “biointerpretive” aspects of the pipeline. As indicated by the multiple arrows, many hurdles (scientific, technical, logistical, ethical, and regulatory) must be overcome before possible clinical application. Analogous schematics can be drawn for other data types at the DNA, RNA, protein, and metabolomic levels (including studies based on microarrays, rather than sequencing).
One frequent aim has been the identification of “prognostic” biomarkers for survival, time to recurrence, or metastasis. However, the interest in such biomarkers has been declining, in part because they do not specify a therapy and in part because the landscape of cancer therapy is changing so rapidly that natural history of the disease has lost much of its meaning. Instead, the focus has turned to “predictive” biomarkers. The term is curiously non-specific, and its etymology is unclear, but it has gained currency for molecular markers that predict which subpopulations of patients will respond to a particular therapy. An allied concept is that of the “actionable” biomarker. An actionable, predictive biomarker may be a target for therapy or it may simply be correlated with response. Historically, bioinformatic analysis has identified associations and correlations more often than it has identified causal relationships, but “bioperturbing” technologies such as siRNA, shRNA, CRISPR, and consequent synthetic lethal pharmacological screens are producing large datasets with immediate causal implications.
The analog (microarray) to digital (sequencing) transition
We are witnessing a transition from the primacy of microarrays (fundamentally analog technologies) to the primacy of DNA and RNA sequencing (fundamentally digital technologies). The digital revolution took hold in computing, then in television, in watches, in cameras and cars, and now in biomedical research. DNA and RNA sequencing provide more precise, incisive, and extensive information about the molecular profiles of cancers than could be obtained from microarrays. For example, sequencing the mixture of mRNAs in a tumor (RNA-seq) can yield information on mRNA splicing, mRNA editing, clonal heterogeneity and evolution, viral insertion, fusion gene expression, and allelic components of the overall expression level. In contrast, expression microarrays generally indicate only the relative amounts of the mRNA species present in a sample. However, the transition is not without its growing pains. As of 2015, sequencing is still generally more expensive than gene expression microarrays. And massively-parallel second-generation sequencing currently challenges the bioinformatics community at the levels of hardware, software, and “wetware” (i.e., personnel).
Hardware challenges
Moore’s law5 is familiar. It relates to the number of transistors that can be crammed into unit surface area on a very large integrated circuit. That number has increased in a remarkably consistent way, two-fold every other year since the 1960s. As a consequence, and because the speed of transistors has increased, the cost of computing power has been cut in half every 18 months. However, the Moore’s law decrease has not kept up with the decline in sequencing cost, which was cut 1,000-fold (from about $10 million per human genome to about $10 thousand) in the 4 years from late 2007 to late 2011 as second-generation sequencing became available (Figure 2). The decline in price has slowed dramatically since that time as we await cost-effectiveness of “third-generation” sequencing technologies such as those based on single-molecule sequencing. Nonetheless, even our high-performance computer clusters with large amounts of memory and thousands of CPUs operating 24 hours a day are often saturated with genomic calculations, principally sequence alignments to the genome. The computational demands are so great that heat dissipation and the availability of electricity are often limiting. Some large data centers require their own power stations. Also a big-data problem, it can take prohibitively long to transmit large numbers of sequences and associated annotations from place to place, even along high-speed lines. Cloud computing will help with our limitations of electrical power and storage space, but one must still get the large amounts of data to and from the cloud. Increasingly, computational tools are being brought to the data, rather than the reverse.
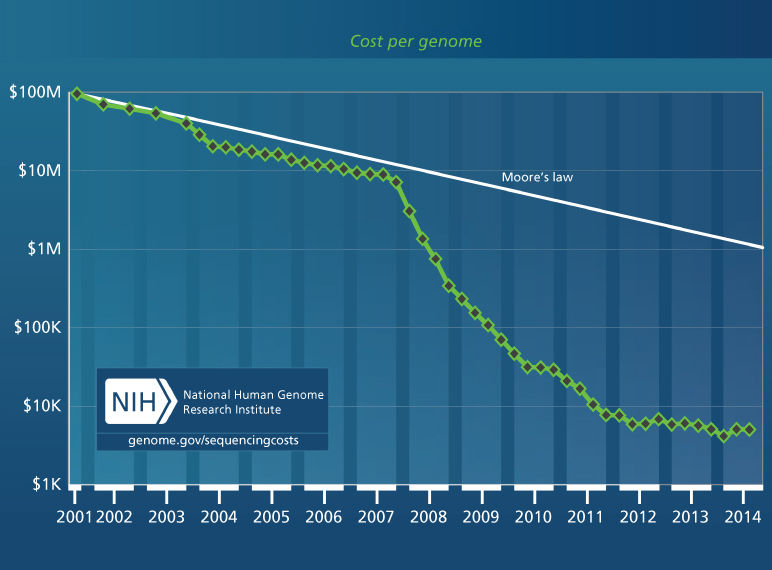
Figure 2 Cost per genome for human whole-genome sequencing. The figure shows an inflection point in late 2007 as massively-parallel sequencing came into practice. We are awaiting the maturation and cost-effectiveness of “third-generation” technologies, principally based on sequencing of single molecules. Source: genome.gov/sequencingcosts (The National Human Genome Research Institute).
Less familiar but an even more serious problem is Kryder’s law,6 analogous to Moore’s law but for the cost of data storage, rather than computing power. An original version of Kryder’s law in 2004 predicted that the cost would decrease by about two-fold every 6 months. In 2009, the projection was scaled down to a cost decrease of 40% per year, but the actual rate of decrease from 2009 through 2014 was only 15% per year. The storage space needed for a standard whole-genome BAM file (binary alignment map file/sequence) with 30-fold average coverage of the genome is “only” about 100 gigabytes, but to identify mutations in minority clones within a tumor can require genome coverage redundancies in the hundreds (if they can be identified at all). The storage space required can be reduced by coding only differences from a reference standard, but the reduction is limited by the need to record quality-control information and other types of annotations. Even large institutions are running out of storage space. It may be less expensive to re-sequence samples than to store sequencing data from them over time.
However, there are new possibilities for mass storage on the horizon, paradoxically including DNA itself. DNA may be the most compact storage medium in prospect. A single gram of DNA could encode about 700,000 gigabytes of data (roughly 7,000 whole-genome BAM files). One team has encoded all of Shakespeare’s sonnets in DNA and another has encoded an entire book—with an intrinsic error rate of only two per million bits, far better than magnetic hard drives or human proof-readers can achieve.7 They then replicated the DNA to produce 70 billion copies of the book—enough for each person in the world to own 10 copies (without taking up space on their bookshelves). Under the right storage conditions, DNA can remain stable, potentially for hundreds of thousands of years, even at room temperature. If you were faced with the challenge of passing knowledge down to future civilizations, DNA storage would be your best bet. The technology for getting information into and out of DNA is far too expensive for large-scale use at this time, but the price is decreasing rapidly.
Software challenges
Creative ideas are flowing through the field of bioinformatics software development. Many hundreds of capable software packages are being developed and deployed, some of them commercial but most of them academically developed, open-source, and publicly available. The range of choices for any given computational function is almost paralyzing. One result is fragmentation of the community of users, who, for the most part, have not yet coalesced around particular algorithms, software, or websites. Among bioinformaticians, the “not-invented-here” syndrome often applies. As a consequence, Bioinformatics is a classic Tower of Babel in which software packages usually fail to communicate nicely with each other. Various annotation schemes and data formats remain mutually incompatible, despite major international efforts at standardization.
Particularly in terms of sequencing, there are algorithmic challenges of major import.8 If the massively-parallel sequencing technologies and the data from them were truly digital, one should be able to identify with certainty whether there is or is not a mutation at a given DNA base-pair. However, that is not the case, as indicated in Figure 3, which shows a Venn diagram for the consistency of somatic mutation calls on the same sequencing data by three major sequencing centers. The differences are considerable, perhaps in part because of clonal heterogeneity, low percentage of tumor cells, poor coverage in some regions of the genome, and/or degradation of the DNA. An additional reason is probabilistic. If each of two callers were 99.999% accurate in identifying mutation at a given base-pair in a genome of three billion bases, then they would still disagree on tens of thousands of calls. Important calls, for example calls of driver mutations and other cancer biomarkers, must be validated by an independent technology. Three such strategies are (1) validation of DNA and RNA calls against each other for the same samples, (2) use of a consensus of calls by different sequencing centers,9 and (3) follow up with a different technology such as polymerase chain reaction focused on particular bases.
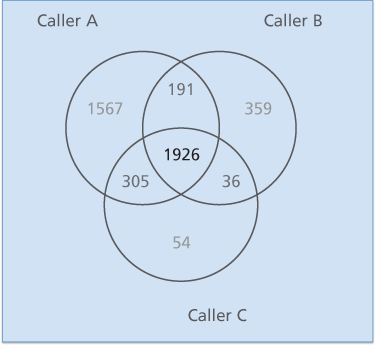
Figure 3 Venn diagram of the somatic point mutations detected by three different mutations callers circa 2013 on 20 TCGA endometrial tumor-normal exome-seq pairs. The differences for point mutations would be smaller now, but an analogous diagram for indels or structural variants would still show considerable lack of concordance. From9
Wetware challenges
At the present time, personnel (wetware) and expertise are even more seriously limiting than the hardware or software issues. Bioinformatics is highly multidisciplinary, at the interface of computer science, statistics, biology, and medicine. There are not many individuals with expertise in all of those disciplines to operate across the interfaces among them. Despite stereotyped pipelines for some parts of the necessary analyses—generally the steps from raw data to mapped sequence—bioinformatics projects usually require customization of analyses and the efforts of a multidisciplinary team.
The bioinformatics components of a typical large molecular profiling project can be divided roughly into data management, statistical analysis, and biointerpretation. Data management sounds mundane, but for a project that includes data from multiple molecular technologies and clinical data sources, it can be challenging in the extreme. When the Hubble telescope was launched in 1990, it was initially crippled by a 1.3-mm error in its mirror because a custom “null corrector” was substituted for the conventional one during final testing. In 1999, the Mars Climate Orbiter was lost because computer software produced output in pound-seconds instead of newton-seconds (metric units); the orbiter’s incorrect trajectory brought it too close to Mars, and it disintegrated in the atmosphere. Analogous data mismatch problems are endemic to bioinformatics. Missing or carelessly composed annotations often result in puzzlement or wrong conclusions about the exact meaning of a data field.
Roles in the multidisciplinary bioinformatics team: an opinion
Statistical analysis of highly multivariate data, unlike that of the simple laboratory experiment, generally calls for specialist expertise in computational analysis. The biomedical researcher should be involved in the statistical analysis, equipped with a basic understanding of the methods employed and the potential pitfalls. He or she should be prepared to provide the analyst with (1) questions to be asked of the data, (2) biomedical domain information, and (3) information on idiosyncrasies of the technologies and experimental design that may affect analysis. If a data analyst is not given those types of information, he or she will often generate the right answer to the wrong question or an answer based on incorrect premises. It is dangerous, however, for those untrained in statistics to perform the data management tasks and statistical analyses alone or without very close supervision. Experience has shown a remarkable tendency for the untrained to make mistakes, generally mistakes of over-optimism.10 They often achieve apparently positive, even ground-breaking, results that later prove to be meaningless. “Unnatural selection” plays a role in that phenomenon; there is a human tendency, reinforced by wishful thinking, to do analyses different ways until one of them gives the desired result. There is also a remarkable, highly tuned tendency for the human mind to find patterns in data where none exist. The analogy of allowing a statistician to perform brain surgery (or a brain surgeon to perform statistical analyses) overstates the case, but not dramatically so.
Bioinformatic analysis, visualization, and interpretation
Table 1 lists some molecular data types and phenomena that can be significant in the analysis of cancers, often for early detection or for prediction of cancer risk, diagnosis, prognosis, response to treatment, recurrence, or metastasis. The “omic” terminology sometimes seems strained, but it is compact, convenient, and etymologically justified. The suffix “-ome” is from the Greek for an “abstract entity, group, or mass,” so omics is the study of entities in aggregate.11 (A curiosity: we have genetics for the single-gene counterpart of genomics but not protetics for the single-gene counterpart of proteomics or metaboletics for the single-compound counterpart of metabolomics.)
Table 1 A potpourri of bioinformatic data types, phenomena, and data sources
| Data types Genomic—germline, somatic (DNA level)
Epigenomic
Transcriptomic (RNA level)
Proteomic
Metabolomic
|
