Trial |
Study Design |
Population |
N |
# With Breast Cancer |
Results |
Trials evaluating whole brain radiotherapy dose-fractionation schedulesa |
Borgelt et al., 1980 (51) |
First study |
30 Gy/10 fractions vs. 30
Gy/15 fractions vs. 40
Gy/15 fractions vs. 40
Gy/20 fractions |
Solid tumors |
910 |
166 |
More rapid symptom improvement with larger fractions (55% of patients achieved improved symptoms at 2 weeks with 30 Gy/10 fractions compared to 43% for other regimens, p = .06). No difference in OS among arms. |
Second study |
20 Gy/5 fractions vs. 30
Gy/10 fractions vs. 40
Gy/15 fractions |
Solid tumors |
902 |
146 |
More rapid symptom improvement with larger fractions (64% of patients achieved improved symptoms at 2 weeks with 20 Gy/5 fractions compared to 54% for the other regimens, p = .01). No difference in OS between arms. |
Borgelt et al., 1981 (61) |
First study |
10 Gy/1 fraction vs. protracted course (20, 30, or 40 Gy/10-20 fractions) |
Solid tumors |
26b |
2 |
No difference in rate of symptom improvement or OS. Shorter duration of improvement (4 weeks vs. 10 weeks, p = .02) and TTP (median 8 weeks vs. 11.5 weeks, p = .07) with high-dose radiation. |
Second study |
12 Gy/2 fractions vs. protracted course (20, 30, or 40 Gy/10-20 fractions) |
Solid tumors |
33a |
1 |
No statistically significant difference in rate of symptom improvement, duration of improvement, or OS with high-dose radiation. |
Murray et al., 1997 (63) |
32 Gy/20 fractions over 10 d followed by boost (24.4 Gy/14 fractions over 7 d) vs. 30 Gy/10 fractions |
Solid tumors |
429 |
43 |
No difference in OS with accelerated hyperfractionation (p = .52) |
Trials evaluating the role of surgery in addition to WBRT |
Patchell et al., 1990 (19) |
Surgery followed by WBRT (36 Gy/12 fractions) vs. WBRT alone |
Solid tumors, single brain metastasis |
48 |
3 |
Improved local control, 80% vs. 48% (p < .02), OS (median 40 weeks vs. 15 weeks, p < .01), and functionally independent survival (median 38 weeks vs. 8 weeks, p < .005). |
Noordijk et al., 1994 (42) |
Surgery followed by WBRT (40 Gy/20 fractions over 10 d) vs. WBRT alone |
Solid tumors, single brain metastasis |
63 |
12 |
Improved OS (median 10 months vs. 6 months, p = .04) and functionally independent survival (7.5 months vs. 3.5 months, p = .06). |
Mintz et al., 1996 (43) |
Surgery followed by WBRT (30 Gy/10 fractions) vs. WBRT alone |
Solid tumors, single brain metastasis |
84 |
10 |
No difference in OS (median 5.6 months vs. 6.3 months, p = .24) or proportion of functionally independent days (mean 0.32 for both arms, p = .98) |
Trials evaluating the role of WBRT in addition to local therapy |
Patchell et al., 1998 (53) |
Surgery + WBRT (50.4 Gy/28 fractions) vs. surgery alone |
Solid tumors, single brain metastasis status post complete surgical resection |
95 |
9 |
Improved local control (10% vs. 46%, p < .001) and distant control (recurrence in other sites in the brain 14% vs. 37%, p < .01). Decreased death due to neurologic causes (14% vs. 44%, p = .03). No difference in OS (median 48 weeks vs. 43 weeks, p = .39) or functionally independent survival (median 37 weeks vs. 35 weeks, p = .61). |
Aoyama et al., 2006 (54) |
WBRT (30 Gy/10 fractions) + SRS (with 30% dose reduction) vs. SRS alone |
Solid tumors, 1-4 lesions, all ≤3 cm |
132 |
9 |
Improved local control (89% vs. 73%, p = .002) at one year. Decreased likelihood of recurrence of tumor anywhere in the brain at 1 y (47% vs. 76%, p < .001). No difference in preservation of neurologic function. No difference in primary endpoint of OS (7.5 months vs. 8.0 months, p = .42). No difference in death due to neurologic causes (22.8% vs. 19.3%, p = .64). |
Kocher et al., 2011 (52) |
WBRT (30 Gy/10 fractions) vs. observation after either SRS or surgery |
Solid tumors, 1-3 lesions, stable systemic disease |
359 (199 SRS, 160 surgery) |
42 |
WBRT vs. observation (2 years) Surgery group recurrence
Local: 27% vs. 59%
DR: 23% vs. 42 % SRS group recurrence
Local: 19% vs. 31%
Distant: 33% vs. 48% No difference in OS (10.7 months vs. 10.9 months), survival with functional independence 9.5 months vs. 10 months). Patients in observation arm reported better QOL (66). |
Chang et al., 2009 (70) |
WBRT (30 Gy/12 fractions) + SRS vs. SRS alone |
Solid tumors, 1-3 lesions |
58 |
8 |
Study stopped early due to decrease in HVLT-R total recall at 4 months in WBRT arm (primary endpoint). Local (100% vs. 67%) and distant (73% vs. 45%) control at 1-yr improved with WBRT. WBRT arm had more deaths from systemic causes leading to worse OS (5.7 months vs. 15.2 months). |
Trials evaluating dose intensification of radiotherapy |
Kondziolka et al., 1999 (77) |
WBRT (30 Gy/12 fractions) + SRS vs. WBRT alone |
Solid tumors, 2-4 lesions, all ≤2.5 cm |
27 |
4 |
Improved local control (local recurrence rate at one year 8% vs. 100%; median time to local recurrence 36 months vs. 6 months, p = .0005). Longer time to recurrence of tumor anywhere in the brain (34 months vs. 5 months, p = .002). No difference in OS (11 months vs. 7.5 months, p = .22). |
Andrews et al., 2004 (65) |
WBRT (37.5 Gy/15 fractions) + SRS vs. WBRT alone |
Solid tumors, 1-3 lesions, all ≤4 cm |
333 |
34 |
Improved local control at 1 y (82% vs. 71%), p = .01). Higher likelihood of stable or improved performance status at 6 months (43% vs. 27%, p = .03). No difference in primary end point of OS (6.5 months vs. 5.7 months, p = .14). Survival advantage observed in subgroup of patients with a single brain metastasis (median 6.5 months vs. 4.9 months, p = .04). |
Trials evaluating radiosensitizers |
Mehta et al., 2003 (113) |
WBRT (30 Gy/10 fractions) + motexafin gadolinium vs. WBRT alone |
Solid tumors |
401 |
75 |
No difference in OS (median 5.2 months vs. 4.9 months, p = .48), time to neurologic progression (median 9.5 months vs. 8.3 months, p = .95), or death due to neurologic causes (49% vs. 52%, p = .60). |
Suh et al., 2006 (114) |
WBRT (30 Gy/10 fractions) + efaproxiral vs. WBRT alone |
Solid tumors, RPA class I or II |
515 |
107 |
No difference in OS (median 5.4 months vs. 4.4 months, p = .16), time to neurological progression, or death due to neurologic causes. In an exploratory subgroup analysis, improved OS (HR for death 0.51, p = .003) and response rate (54% vs. 41%, p = .01) in breast cancer patients. A subsequent trial limited to breast cancer patients was negative (116). |
Knisely et al., 2008 (118) |
WBRT 37.5 Gy/15
fractions) + thalidomide vs. WBRT alone |
Solid tumors, multiple (>3), large (>4 cm) or midbrain metastases |
175 |
31 |
No difference in OS (median 3.9 months for both arms), or in deaths due to neurologic causes. |
aAll fractions given once daily unless otherwise specified. |
bRepresents number of patients assigned to the high-dose arm. These patients were compared to 143 control patients who received a more protracted course of radiation. |
OS, overall survival; TTP, time to progression; WBRT, whole-brain radiotherapy; SRS, stereotactic radiosurgery; HR, hazard ratio. |
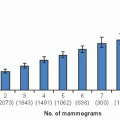 Breast Cancer Screening
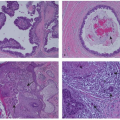 Ductal Carcinoma In Situ and Other Intraductal Lesions: Pathology, Immunohistochemistry, and Molecular Alterations
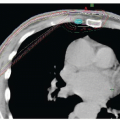 Postmastectomy Radiation Therapy
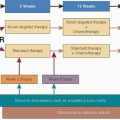 Preoperative Chemotherapy for Operable Breast Cancer
 Palliative Care in Breast Cancer
 Nursing Care in Patient Management and Quality of Life


