Energy Balance
Whether the net energy balance of an adult animal is positive or negative will depend upon energy intake versus energy expenditure as illustrated below (in growing animals another component must be added to this equation to account the energy requirements for growth).
The energy expenditure component consists of the basal metabolic rate (BMR) and activity increment components. The BMR for an adult (nongrowing) animal is constant and proportional to lean body mass, i.e. the active metabolizing tissue. The activity increment component, however, is variable and depends on the level of physical (muscular) activity performed by the animal. When a growing animal reaches maturity, lean body mass tissue plateaus and is maintained at this level even during periods of excessive caloric intake and fat accumulation.
When energy intake exceeds expenditure, excess nutrient-derived metabolites are initially diverted into storage as CHO, i.e. glycogen, and then into fat (Figure 1a). The only form in which dietary CHO can be stored is in the form of glycogen, a starch-like polymer of glucose. Although quantitatively it contributes little to body’s total energy reserve, liver glycogen is rapidly accessible and an immediate source of blood glucose. The liver is the only organ in which glycogen can be stored at substantial levels (up to ~5% of liver weight) and can be mobilized into the blood as glucose (although the kidney also contains the necessary enzymes, the amount of glycogen is relatively small). Only the hepatocyte (liver cell) possesses the necessary enzymatic machinery to convert glycogen into blood glucose during food deprivation (Figure 1b). The caloric equivalent of the entire glycogen reserve of the liver is only ~300kCal in an adult human, far less than the 1800kCal required daily for body maintenance. Although most other cell types, e.g. skeletal muscle, contain much lower levels of glycogen (<0.1% of tissue mass) for local use, only the liver (and to a minor extent the kidney) can produce blood glucose.
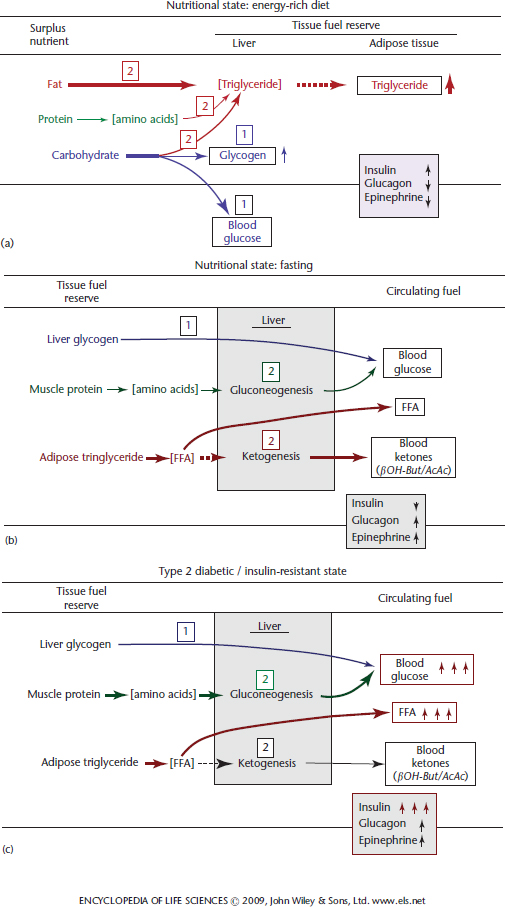
Figure 1 Effect of nutritional state (a and b) and Type-2 diabetes (c) on tissue fuel reserves and circulating physiological fuels. (a) When fed an energy-rich diet after fasting dietary CHO is first used to restore blood glucose level and replete liver glycogen reserves. Next excess dietary CHO and fat are diverted into triglyceride (fat) synthesis in the liver, which is transported to adipose tissue as very low-density lipoprotein to adipose tissue where fatty acids are released, resynthesized into triglyceride and stored. Under these circumstances the blood levels of insulin, glucagon and epinephrine change in the directions of the vertical arrows. (b) In the fasted state (food deprivation) liver glycogen is converted into glucose and is released into the blood stream. When this glycogen reserve is depleted, protein from tissues (primarily skeletal muscle) is mobilized as amino acids. The amino acids are transported in the blood to the liver where they are converted via gluconeogenesis into glucose, which is released into the blood stream. Concurrently, adipose tissue triglyceride is mobilized as fatty acids and released into the blood stream. The fatty acids are both used directly as fuels for many tissues (liver and muscle, but not brain) and also are taken up by the liver and converted into ketones (β-hydoxybutyrate and acetoacetate). The ketones are released into the blood stream and utilized as an alternative fuel for the brain (CNS neurons) and muscle. (c) In the pathological Type-2 diabetic state most cells become insulin resistant, which leads to hyperglycaemia and hyperlipidaemia (elevated blood fatty acid level) compounded by hyperinsulinaemia (see text for an explanation). The boxed numbers Cahill, 2006a and Wolfgang and Lane, 2006 indicate the sequence in which the transition occurs.
Once the hepatic glycogen reserve has been filled surplus nutrient-derived metabolites, whether from protein, CHO or fat, are diverted into fatty acid biosynthesis and deposited in adipose tissue as fat. Although fat reserves increase in obesity and can become massive, body protein and bone mass in obese individuals do not increase significantly. Thus, adipose tissue fat constitutes the major energy reserve of higher animals.
When energy balance becomes negative, i.e. when energy expenditure exceeds intake, glycogen reserves are rapidly depleted and tissue protein (primarily muscle protein) is mobilized and the constituent amino acids become the major precursors for hepatic glucose production (gluconeogenesis) (Figure 1b). Concurrently, the fat reserves of adipose tissue are mobilized and released into the blood stream as free fatty acids and provide a physiological fuel that can be metabolize by most tissues. A substantial fraction of the fatty acids released are converted into ketones in the liver to provide an alternate fuel (to glucose) for the central nervous system (CNS). During prolonged food deprivation/starvation ketones become the predominant fuel for the brain/CNS replacing glucose as the major fuel.
Blood Glucose and the Control of Energy Balance
Energy balance in higher animals is regulated through complex interconnected endocrine and neuroendocrine systems. The primary physiological indicator of global energy status is blood glucose, the level of which is maintained within relatively narrow limits. Blood glucose levels in healthy individuals in the postabsorptive state range between 4 and 5mM (80–100mgdl−1) normally decreasing to ~3mM during food deprivation and increasing to 6–7mM (120–140mgdl−1) following a CHO-containing meal. In a diabetic individual these levels are much higher, often as high as 200–400mg/dl, and persist much longer after a meal. Deviations from the ‘normal’ blood glucose level are controlled by the actions of hormones, largely those secreted by the pancreas, notably insulin and glucagon. Other hormone-secreting tissues come into play including the adrenal gland, which secretes both epinephrine and glucocorticoid, and neuroendocrine cells of the hypothalamus, which secrete neuropeptides, notably neuropeptide Y (NPY), Agouti-related protein (AgRP) and alpha melanocortin stimulating hormone (α-MSH), that elicit their effects in and through the CNS (Wolfgang et al., 2007).
Glucose Homoeostasis
Although glucose can be metabolized by all mammalian cell types, certain cell types, notably erythrocytes and neurons of the CNS, have an absolute requirement for glucose. Therefore, blood glucose is supplied continuously and its concentration maintained within relatively narrow limits (3–5mM in humans). Not surprisingly, blood glucose serves as an indicator of global energy status to which the secretion of key regulatory hormones respond. Changes in blood glucose level are sensed by specific cell types within the Islets of Langerhans of the endocrine pancreas, which respond by secreting insulin and glucagon (Muoio and Newgard, 2008). Thus, insulin and glucagon secreted by islet β- and α-cells, respectively, exert counter-regulatory effects on the energy metabolism of peripheral tissues. The β-cell is exquisitely sensitive to changes in blood glucose concentration, in part, because of its unique glucose transport/kinase system (Figure 2). The glucose transporter, GLUT2, and glucokinase, which are expressed only by β-cells and hepatocytes, exhibit KA/KM values (concentration at which activation/catalysis is half-maximal) poised at the midpoint of the physiological dynamic range of blood glucose (~5mM). This ensures that changes in blood glucose level produce corresponding changes in the uptake and phosphorylation that alter the rate of glucose metabolism. Thus, the downstream effects of glucose metabolism in β-cells produce a signal that activates insulin secretion (Figure 2). The catabolism of glucose gives rise to an increase in adenosine triphosphate (ATP) level, which in turn closes the plasma membrane ATP-dependent potassium (K+) channel causing membrane depolarization. Depolarization of the membrane causes opening of the K+-dependent Ca2+ channel and an influx of Ca2+. Elevated intracellular calcium then triggers fusion of insulin-containing secretory vesicles with the plasma membrane resulting in insulin release and an increase in blood insulin level. This rise in blood insulin triggers a variety of metabolic changes in insulin-responsive cells/tissues that promote energy storage.
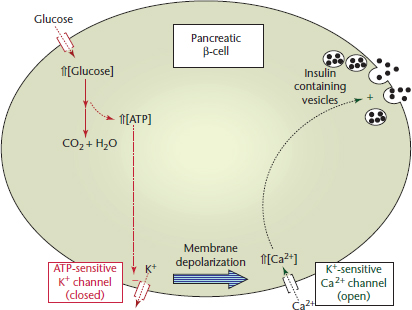
Figure 2 Glucose-activated insulin secretion by the pancreatic β-cell. When the blood glucose level rises the sequence of events lead to increased insulin (solid circles) secretion (see text for details). K+ and Ca2+ refer to the potassium and calcium ions, respectively.
Movement of Physiological Fuels Between Tissues
Whole body energy metabolism involves the flux of blood-borne physiological fuels (glucose, FFA and ketones) between remotely located tissues (Wahren and Ekberg, 2007). To understand how the movement of these circulating fuels is directed within and between tissues, it is instructive to compare their origins and fates in different physiological states, in particular the fed/energy-rich, fasted and diabetic states (Figure 1a, b and c). The liver occupies a central position in orchestrating this metabolite flow and serves as the switching point for the uptake, modification and distribution of physiological fuel molecules for transport in the blood to their ultimate tissue site of metabolism. The movement of physiological fuels between tissues is under direct hormonal control. Insulin promotes the movement of these fuels into energy storage pathways, whereas glucagon initiates the mobilization and catabolism of the stored energy reserves (liver glycogen, adipose tissue fat and muscle protein). Insulin activates glucose uptake and glycogen and fat synthesis and suppresses energy mobilization (Figure 1a and 1b, Figure 3 and Figure 4). Glucagon, however, counterbalances the effects of insulin by causing the mobilization of stored glycogen and fat and inhibiting energy storage pathways.
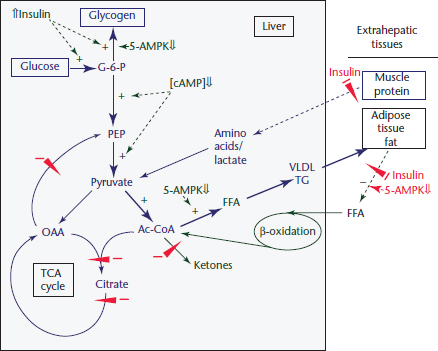
Figure 3 Regulation of hepatic energy metabolism in the ‘fed’ state. Under the physiological conditions described in Figure 1a the pathways illustrated by the broad arrows dominate over those represented by thin arrows. The control features shown by + and − illustrate the basis for the changes in flux through the pathways. Changes in the regulatory factors that cause these changes are described in the text. TCA, tricarboxylic cycle; Ac-CoA, acetyl-CoA; VLDL, very low-density lipoprotein; PEP, phosphoenolpyruvate; cAMP, cyclicAMP.
Related posts:

Stay updated, free articles. Join our Telegram channel

Full access? Get Clinical Tree


