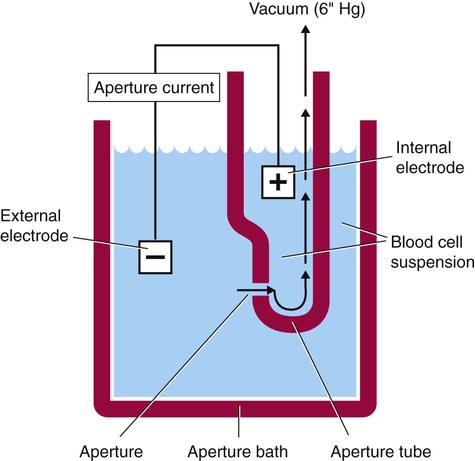
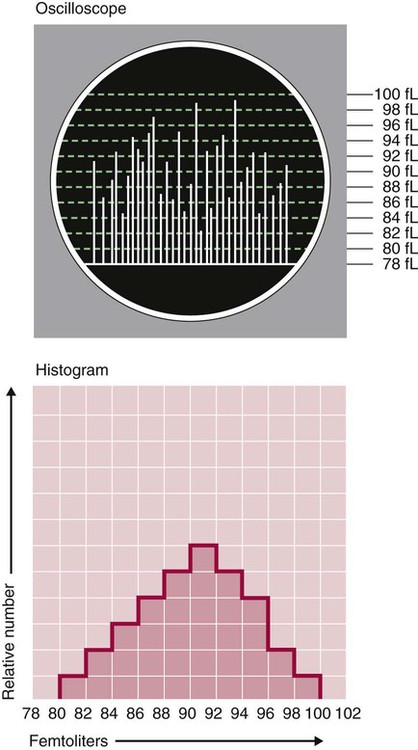
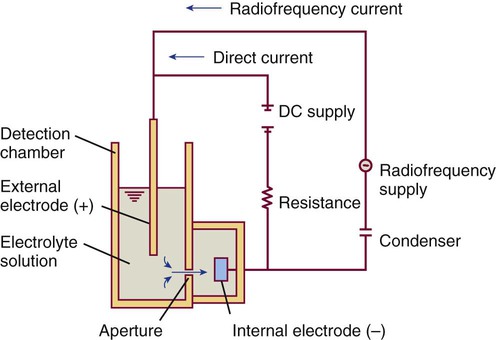
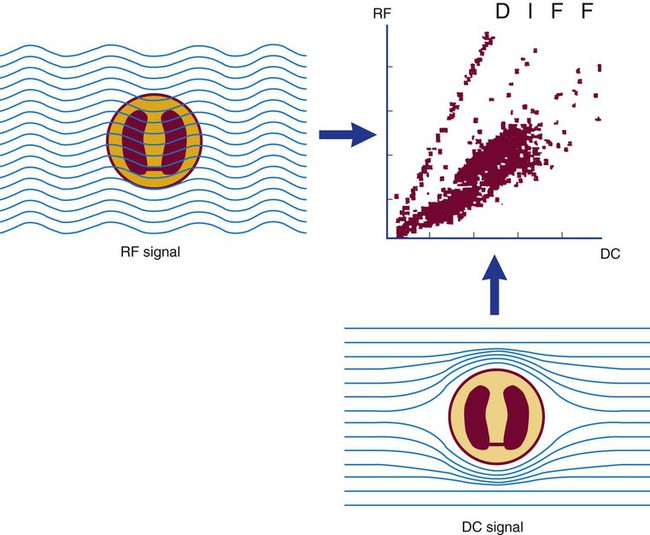
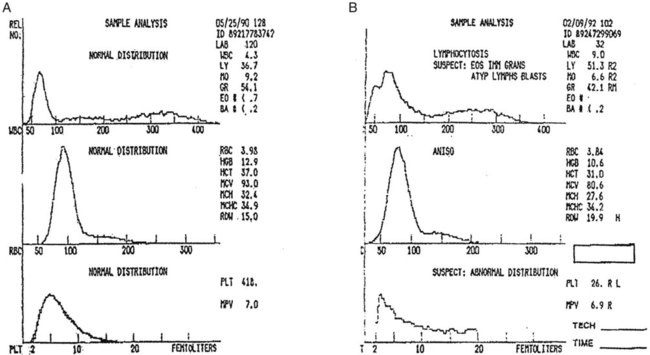
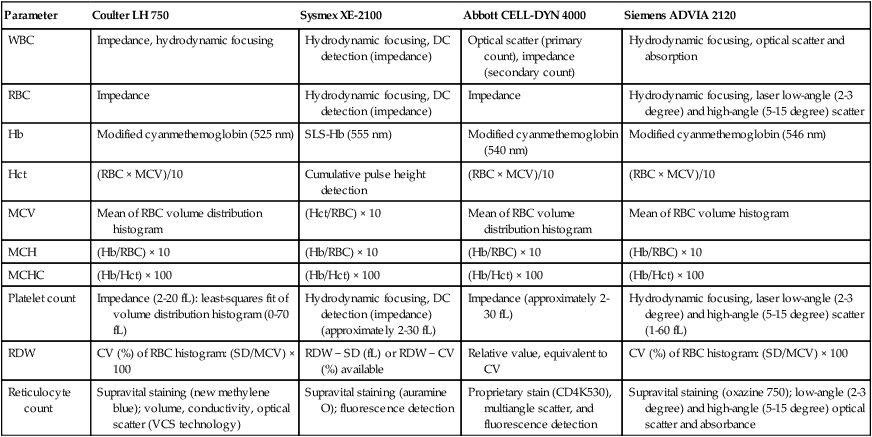
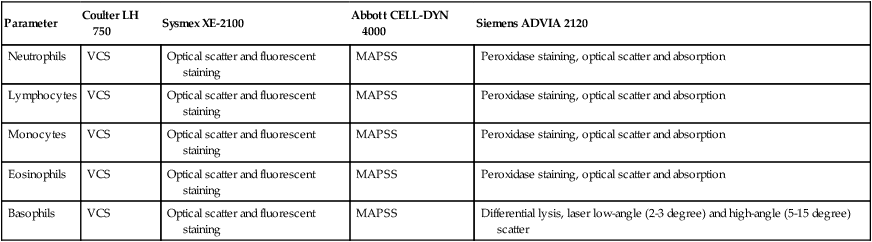
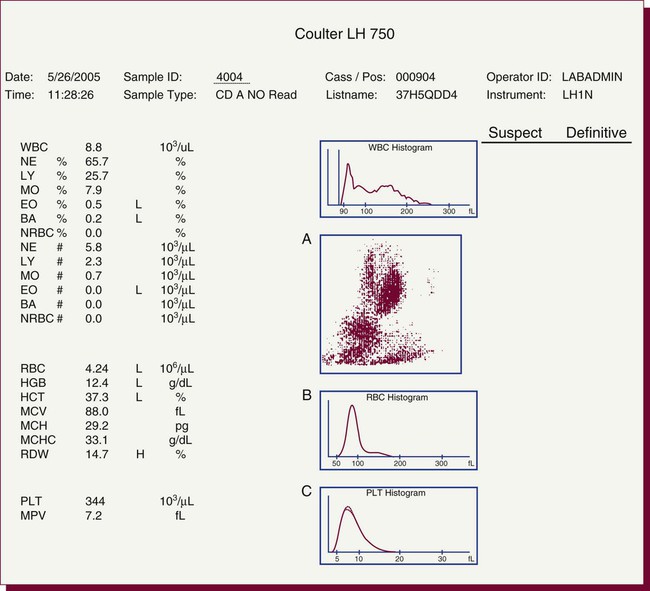
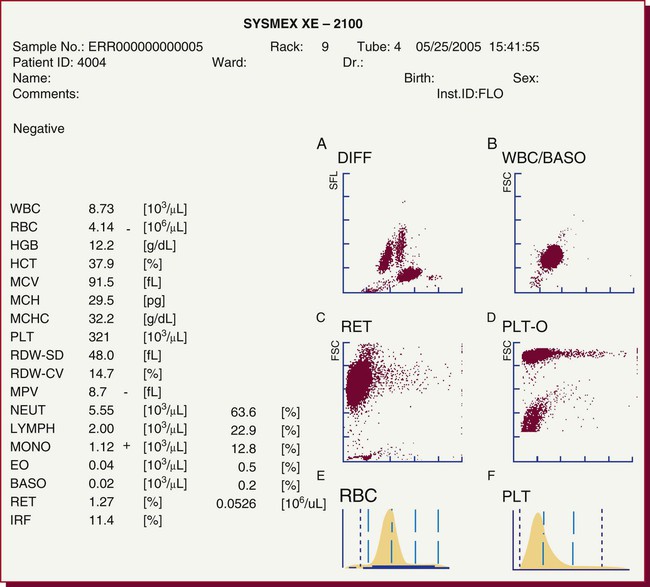
After completion of this chapter, the reader will be able to: 1. Explain the different principles of automated cell counting. 2. Describe how the general principles are implemented on the different instruments discussed. 3. Identify the hemogram parameters directly measured on the four analyzers discussed. 4. Explain the derivation of calculated or indirectly measured hemogram parameters for the same four analyzers. 5. Explain the derivation of the white blood cell (WBC) differential count on the different instruments discussed. 6. Interpret and compare patient data, including WBC and red blood cell histograms or cytograms or both, obtained from the major hematology instruments. 7. Explain the general principles of automated reticulocyte counting. 8. Identify sources of error in automated cell counting and determine appropriate corrective action. Despite the number of hematology analyzers available from different manufacturers and their varying levels of sophistication and complexity, most rely on only two basic principles of operation: electronic impedance (resistance) and optical scatter. Electronic impedance, or low-voltage direct current (DC) resistance, was developed by Coulter in the 1950s1,2 and is the most common methodology used. Radiofrequency (RF), or alternating current resistance, is a modification sometimes used in conjunction with DC electronic impedance. Technicon Instruments Corporation (Tarrytown, N.Y.) introduced darkfield optical scanning in the 1960s, and Ortho Clinical Diagnostics, Inc. (Raritan, N.J.), followed with a laser-based optical instrument in the 1970s.3 Optical scatter, using both laser and non-laser light, is frequently employed in today’s hematology instrumentation. The impedance principle of cell counting is based on the detection and measurement of changes in electrical resistance produced by cells as they traverse a small aperture. Cells suspended in an electrically conductive diluent such as saline are pulled through an aperture (orifice) in a glass tube. In the counting chamber, or transducer assembly, low-frequency electrical current is applied between an external electrode (suspended in the cell dilution) and an internal electrode (housed inside the aperture tube). Electrical resistance between the two electrodes, or impedance in the current, occurs as the cells pass through the sensing aperture, causing voltage pulses that are measurable (Figure 39-1).4,5 Oscilloscope screens on some instruments display the pulses that are generated by the cells as they interrupt the current. The number of pulses is proportional to the number of cells counted. The size of the voltage pulse is directly proportional to the size (volume) of the cell, which allows discrimination and counting of cells of specific sizes through the use of threshold circuits. Pulses are collected and sorted (channelized) according to their amplitude by pulse height analyzers. The data are plotted on a frequency distribution graph, or size distribution histogram, with relative number on the y-axis and size (channel number equivalent to a specific size) on the x-axis. The histogram produced depicts the volume distribution of the cells counted. Figure 39-2 illustrates the construction of a frequency distribution graph. Size thresholds separate the cell populations on the histogram, and the count is the cells enumerated between the lower and upper set thresholds for each population. Size distribution histograms may be used for the evaluation of one cell population or subgroups within a population.5 The use of proprietary lytic reagents to control shrinkage and lysis of specific cell types, as in the older Coulter S-Plus IV, STKR, and Sysmex E-5000 models, allows separation and quantitation of white blood cells (WBCs) into three populations (lymphocytes, mononuclear cells, and granulocytes) for the “three-part differential” on one size distribution histogram.6–8 Several factors may affect size or volume measurements in impedance or volume displacement instruments. Aperture diameter is crucial, and the red blood cell (RBC)/platelet aperture is smaller than the WBC aperture to increase platelet counting sensitivity. On earlier systems, protein buildup occurred, decreasing the diameter of the orifice, slowing the flow of cells, and increasing their relative electrical resistance. Protein buildup results in lower cell counts, which result in falsely elevated cell volumes. Impedance instruments once required frequent manual aperture cleaning, but current instruments incorporate “burn circuits” or other internal cleaning systems to prevent or slow protein buildup.6–9 Carryover of cells from one sample to the next also is minimized by these internal cleaning systems. Coincident passage of more than one cell at a time through the orifice causes artificially large pulses, which results in falsely increased cell volumes and falsely decreased cell counts. This count reduction, or coincident passage loss, is statistically predictable (and mathematically correctable) because of its direct relationship to cell concentration and the size or effective volume of the aperture.7–9 Coincidence correction typically is completed by the analyzer computer before final printout of cell counts from the instrument. Other factors affecting pulse height include orientation of the cell in the center of the aperture and deformability of the RBC, which may be altered by decreased hemoglobin (Hb) content.10,11 Recirculation of cells back into the sensing zone creates erroneous pulses and falsely elevates cell counts. A backwash or sweep-flow mechanism has been added to prevent recirculation of cells back into the sensing zone, and anomalously shaped pulses are edited out electronically.6,7,9 The use of hydrodynamic focusing avoids many of the potential problems inherent in a rigid aperture system. The sample stream is surrounded by a sheath fluid as it passes through the central axis of the aperture. Laminar flow allows the central sample stream to narrow sufficiently to separate and align the cells into single file for passage through the sensing zone.12–14 The outer sheath fluid minimizes protein buildup and plugs, eliminates recirculation of cells back into the sensing zone with generation of spurious pulses, and reduces pulse height irregularity because off-center cell passage is prevented and better resolution of the blood cells is obtained. Coincident passage loss also is reduced because blood cells line up one after another in the direction of the flow.15 Laminar flow and hydrodynamic focusing are discussed further in Chapter 33. Low-voltage DC impedance, as described previously, may be used in conjunction with RF resistance, or resistance to a high-voltage electromagnetic current flowing between both electrodes simultaneously. Although the total volume of the cell is proportional to the change in DC, the cell interior density (e.g., nuclear volume) is proportional to pulse size or change in the RF signal. Conductivity, as measured by this high-frequency electromagnetic probe, is attenuated by nucleus-to-cytoplasm ratio, nuclear density, and cytoplasmic granulation. DC and RF voltage changes may be detected simultaneously and separated by two different pulse processing circuits.15,16 Figure 39-3 illustrates the simultaneous use of DC and RF current. Two different cell properties, such as impedance and conductivity, can be plotted against each other to create a two-dimensional distribution cytogram or scatterplot (Figure 39-4). Such plots display the cell populations as clusters, with the number of dots in each cluster representing the concentration of that cell type. Computer cluster analysis can determine absolute counts for specific cell populations. The use of multiple methods by a given instrument for the determination of at least two cell properties allows the separation of WBCs into a five-part differential (neutrophils, lymphocytes, monocytes, eosinophils, and basophils). DC and RF detection are two methods used by the Sysmex analyzers to perform WBC differentials.15,16 Optical scatter may be used as the primary methodology or in combination with other methods. In optical scatter systems (flow cytometers), a hydrodynamically focused sample stream is directed through a quartz flow cell past a focused light source (see Figure 33-3). The light source is generally a tungsten-halogen lamp or a helium-neon laser (light amplification by stimulated emission of radiation). Laser light, termed monochromatic light because it is emitted at a single wavelength, differs from brightfield light in its intensity, its coherence (i.e., it travels in phase), and its low divergence or spread. These characteristics allow for the detection of interference in the laser beam and enable enumeration and differentiation of cell types.12,17 Optical scatter may be used to study RBCs, WBCs, and platelets. As the cells pass through the sensing zone and interrupt the beam, light is scattered in all directions. Light scatter results from the interaction between the processes of absorption, diffraction (bending around corners or the surface of a cell), refraction (bending because of a change in speed), and reflection (backward scatter of rays caused by an obstruction).18 The detection of scattered rays and their conversion into electrical signals is accomplished by photodetectors (photodiodes and photomultiplier tubes) at specific angles. Lenses fitted with blocker bars to prevent nonscattered light from entering the detector are used to collect the scattered light. A series of filters and mirrors separate the varying wavelengths and present them to the photodetectors. Photodiodes convert light photons to electronic signals proportional in magnitude to the amount of light collected. Photomultiplier tubes are used to collect the weaker signals produced at a 90-degree angle and multiply the photoelectrons into stronger, useful signals. Analogue-to-digital converters change the electronic pulses to digital signals for computer analysis.12,17 Forward-angle light scatter (0 degrees) correlates with cell volume or size, primarily because of diffraction of light. Orthogonal light scatter (90 degrees), or side scatter, results from refraction and reflection of light from larger structures inside the cell and correlates with degree of internal complexity. Forward low-angle scatter (2 to 3 degrees) and forward high-angle scatter (5 to 15 degrees) also correlate with cell volume and refractive index or with internal complexity.17,19,20 Differential scatter is the combination of this low-angle and high-angle forward light scatter and is primarily used on Siemens systems for cellular analysis. The angles of light scatter measured by the different flow cytometers are manufacturer and method specific. Scatter properties at different angles may be plotted against each other to generate two-dimensional cytograms or scatterplots, as on the Abbott CELL-DYN instruments.21,22 Optical scatter may also be plotted against absorption, as on the Siemens systems,23,24 or against volume, as on the larger Coulter systems.9 Computer cluster analysis of the cytograms may yield quantitative and qualitative information. Hematology analyzers are produced by multiple manufacturers, including, but not limited to, Abbott Laboratories (Abbott Park, Ill.),25 HORIBA Medical (Irvine, Calif.),26 Siemens Healthcare Diagnostics, Inc. (Deerfield, IL),27 Beckman Coulter, Inc. (Brea, Calif.),28 and Sysmex Corporation (Kobe, Japan).29 The following discussion is limited to instrumentation produced by four of these suppliers. Emphasis is not placed on sample size or handling, speed, level of automation, or comparison of instruments or manufacturers. Likewise, technology continues to improve, and the newest (or most recent) models produced by a manufacturer may not be mentioned. Instead, a detailed description of primary methods used by these manufacturers is given to show the application of, and clarify further, the principles presented earlier and to enable the technologist better to interpret patient data, including instrument-generated histograms and cytograms, in the hematology laboratory. Table 39-1 summarizes methods used for hemogram determination on four major hematology instruments. Table 39-2 summarizes methods used for WBC differential determination on the same four analyzers. TABLE 39-1 Methods for Hemogram and Reticulocyte Count Determination on Four Major Hematology Instruments TABLE 39-2 Methods for White Blood Cell Differential Determination on Four Major Hematology Instruments MAPSS, Multiangle polarized scatter separation; VCS, volume, conductivity, scatter. Beckman Coulter, Inc., manufactures an extensive line of hematology analyzers, including the smaller ONYX series that provide complete RBC, platelet, and WBC analysis with three-part differential; the larger MAXM and STKS systems that perform a CBC with five-part differential and reticulocyte analysis using off-line sample preparation; and the GEN-S and newer LH 780 systems, part of the LH 700 series, that provide a fully automated on-line reticulocyte analysis.28 The LH series also has the capability to perform CD4 and CD8 counts.30–32 Coulter instruments typically have two measurement channels in the hydraulics system for determining the hemogram data. The RBC and WBC counts and hemoglobin are considered to be measured directly. The aspirated whole-blood sample is divided into two aliquots, and each is mixed with an isotonic diluent. The first dilution is delivered to the RBC aperture chamber, and the second is delivered to the WBC aperture chamber. In the RBC chamber, RBCs and platelets are counted and discriminated by electrical impedance as the cells are pulled through each of three sensing apertures (50 µm in diameter, 60 µm in length). Particles 2 to 20 fL are counted as platelets, and particles greater than 36 fL are counted as RBCs. In the WBC chamber, a reagent to lyse RBCs and release hemoglobin is added before WBCs are counted simultaneously by impedance in each of three sensing apertures (100 µm in diameter, 75 µm in length). Alternatively, some models employ consecutive counts in the same RBC or WBC aperture. After counting cycles are completed, the WBC dilution is passed to the hemoglobinometer for determination of hemoglobin concentration (light transmittance read at a wavelength of 525 nm). Electrical pulses generated in the counting cycles are sent to the analyzer for editing, coincidence correction, and digital conversion. Two of the three counts obtained in the RBC and the WBC baths must match within specified limits for the counts to be accepted by the instrument.5,9 This multiple counting procedure prevents data errors resulting from aperture obstructions or statistical outliers and allows for excellent reproducibility on the Coulter instruments. Pulse height is measured and categorized by pulse height analyzers; 256 channels are used for WBC and RBC analysis, and 64 channels are used for platelet analysis. Size-distribution histograms of WBC, RBC, and platelet populations are generated. The RBC mean cell volume (MCV) is the average volume of the RBCs taken from the size distribution data. The hematocrit (Hct), mean cell hemoglobin (MCH), and mean cell hemoglobin concentration (MCHC) are calculated from measured and derived values. The RBC distribution width (RDW) is calculated directly from the histogram as the coefficient of variation (CV) of the RBC volume distribution, with a reference range of 11.5% to 14.5%.5 The RDW is an index of anisocytosis, but may be falsely skewed because it reflects the ratio of the standard deviation (SD) to MCV. That is, an RBC distribution histogram with normal divergence, but with a decreased MCV may imply a high RDW, falsely indicating increased anisocytosis. MCV and RDW are used by the instrument to flag possible anisocytosis, microcytosis, and macrocytosis.9 Platelets are counted within the range of 2 to 20 fL, and a size-distribution histogram is constructed. If the platelet size distribution meets specified criteria, a statistical least-squares method is applied to the raw data to fit the data to a log-normal curve. The curve is extrapolated from 0 to 70 fL, and the final count is derived from this extended curve. This fitting procedure eliminates interference from particles in the noise region, such as debris, and in the larger region, such as small RBCs. The mean platelet volume (MPV), analogous to the RBC MCV, also is derived from the platelet histogram. Reference values for the MPV are about 7.8 to 11.0 fL. The MPV increases slightly as the sample sits in the anticoagulant, ethylenediaminetetraacetic acid (EDTA).5 Many older-model Coulter instruments, such as the STKR, and the newer smaller models, such as the ONYX, provide three-part leukocyte subpopulation analysis, which differentiates WBCs into lymphocytes, mononuclear cells, and granulocytes. In the WBC channel, a special lysing reagent causes differential shrinkage of the leukocytes, which allows the different cells to be counted and sized based on their impedance. A WBC histogram is constructed from the channelized data. Particles between approximately 35 and 90 fL are considered lymphocytes; particles between 90 and 160 fL, “mononuclears” (monocytes, blasts, immature granulocytes, and reactive [“atypical”] lymphocytes); and particles between 160 and 450 fL, granulocytes. This allows the calculation of relative and absolute numbers for these three populations.6 Proprietary computerized algorithms further allow flagging for increased eosinophils or basophils or both and interpretation of the histogram differential, including flagging for abnormal cells, such as reactive lymphocytes and blasts.7 When cell populations overlap or a distinct separation of populations does not exist, a region alarm (R flag) may be triggered that indicates the area of interference on the size-distribution histogram. An R1 flag represents excess signals at the lower threshold region of the WBC histogram and a questionable WBC count. This interference is visualized as a “high takeoff” of the curve and may indicate the presence of nucleated RBCs, clumped platelets, unlysed RBCs, or electronic noise.6,7 Figure 39-5 shows composite printouts from the Coulter STKR that include the “interpretive differential.” More recent Coulter instruments, the STKS, MAXM, GEN-S, and LH 750, generate hemogram data (including the WBC count) exactly as before but use Coulter’s proprietary VCS (volume, conductivity, scatter) technology in a separate channel to evaluate WBCs for the determination of a five-part differential. The VCS technology includes the volumetric sizing of cells by impedance, conductivity measurements of cells, and laser light scatter, all performed simultaneously for each cell. After RBCs are lysed and WBCs are treated with a stabilizing reagent to maintain them in a near-native state, a hydrodynamically focused sample stream is directed through the flow cell past the sensing zone. Low-frequency DC measures size, whereas a high-frequency electromagnetic probe measures conductivity, an indicator of cellular internal content. The conductivity signal is corrected for cellular volume, which yields a unique measurement called opacity. Each cell also is scanned with monochromatic laser light that reveals information about the cell surface, such as structure, shape, and reflectivity. Coulter’s unique rotated light scatter detection method, which covers a 10-degree to 70-degree range, allows for separation of cells with similar size, but different scatter characteristics. More than 8000 WBCs are analyzed in each sample.31,33 Beckman Coulter’s newest analyzer, the UniCel DxH 800, utilizes the volume and conductivity as well as low angle scatter as in earlier models but also measures additional lower and higher median angle scatter to provide additional information for cell identification and flagging.34 This combination of technologies provides a three-dimensional plot or cytograph of the WBC populations, which are separated by computer cluster analysis. Two-dimensional scatterplots of the three measurements represent different views of the cytograph. The discriminate function 1 (DF 1) scatterplot of volume (y-axis) versus light scatter (x-axis) shows clear separation of lymphocytes, monocytes, neutrophils, and eosinophils. Basophils are hidden behind the lymphocytes in this scatterplot but are separated by conductivity owing to their cytoplasmic granulation. The DF 2 scatterplot of volume (y-axis) versus conductivity (x-axis) shows lymphocytes, monocytes, and neutrophils as the prominent populations. When the neutrophil population is removed from the DF 2 scatterplot, the basophil population may be visualized on the z-axis (DF 3 display). DF 2 and DF 3 scatterplots are available at operator request. Single-parameter histograms of volume, conductivity, and light scatter also are available.9,33 Figure 39-6 represents a standard patient printout from the Coulter LH 750 showing a DF 1 scatterplot. Two types of WBC flags (alarms or indicators of abnormality) are generated on all hematology analyzers that provide a WBC differential count: (1) user defined, primarily set for distributional abnormalities, such as eosinophilia or lymphocytopenia (based on absolute eosinophil or lymphocyte counts); and (2) instrument specific, primarily suspect flags for morphologic abnormalities. For distributional flags, the user establishes reference ranges and programs the instrument to flag each parameter as high or low. Suspect flags indicating the possible presence of abnormal cells are triggered when cell populations fall outside expected regions or when specific statistical limitations are exceeded. Instrument-specific “suspect” flags on the Coulter LH 700 series include immature granulocytes/bands, blasts, variant lymphocytes, nucleated RBCs, and platelet clumps. Inadequate separation of cell populations may disallow reporting of differential results by the instrument and may elicit a “review slide” message.9,35 On the LH 700 series, Coulter has added an IntelliKinetics application. This application is used to ensure consistency with the kinetic reactions. It provides the instrument the best signals for analysis independent of laboratory environment variations. Compared with earlier models Coulter IntelliKinetics provides better separation of cell populations for WBCs and reticulocytes, which enables better analysis by the system algorithms.35 Sysmex Corporation, formerly TOA Medical Electronics Company, Ltd., manufactures a full line of hematology analyzers, including the small KX-21N and K-4500 that provide complete RBC, platelet, and WBC analysis with three-part differential; the larger XT-1800i (SF-3000 and SE-9000) that performs a CBC with five-part differential; and the newer XE-5000 series that also provides a fully automated reticulocyte count.29,36,37 The WBC, RBC, hemoglobin, hematocrit, and platelet counts are considered to be measured directly. Three hydraulic subsystems are used for determining the hemogram: the WBC channel, the RBC/platelet channel, and a separate hemoglobin channel. In the WBC and RBC transducer chambers, diluted WBC and RBC samples are aspirated through the different apertures and counted using the impedance (DC detection) method for counting and sizing cells. Two unique features enhance the impedance technology: (1) in the RBC/platelet channel, a sheathed stream with hydrodynamic focusing is used to direct cells through the aperture, which reduces coincident passage, particle size distortion, and recirculation of blood cells around the aperture; and (2) in the WBC and RBC/platelet channels, “floating thresholds” are used to discriminate each cell population.8,15,16 As cells pass through the apertures, signals are transmitted in sequence to the analogue circuit and particle size distribution analysis circuits for conversion to cumulative cell size distribution data. Particle size distribution curves are constructed, and optimal position of the autodiscrimination level (i.e., threshold) is set by the microprocessor for each cell population. The lower platelet threshold is automatically adjusted in the 2- to 6-fL volume range, and the upper threshold is adjusted in the 12- to 30-fL range, based on particle volume distribution. Likewise, the RBC lower and upper thresholds may be set in the 25- to 75-fL and 200- to 250-fL volume ranges. This floating threshold circuitry allows for discrimination of cell populations on a sample-by-sample basis. Cell counts are based on pulses between the lower and upper autodiscriminator levels, with dilution ratio, volume counted, and coincident passage error accounted for in the final computer-generated numbers. In the RBC channel, the floating discriminator is particularly useful in separating platelets from small RBCs. The hematocrit also is determined from the RBC/platelet channel, based on the principle that pulse height generated by the RBC is proportional to cell volume. The hematocrit is the RBC cumulative pulse height and is considered a true relative percentage volume of erythrocytes.8,15 In the hemoglobin flow cell, hemoglobin is converted to oxyhemoglobin, which combines with sodium lauryl sulfate to become a sodium lauryl sulfate–hemoglobin hemachrome molecule, with concentration measured as absorbance at 555 nm.16,38 The following indices are calculated in the microprocessor using directly measured or derived parameters: MCV, MCH, MCHC, RDW-SD, RDW-CV, MPV, and plateletcrit. RDW-SD is the RBC arithmetic distribution width measured at 20% of the height of the RBC curve, reported in femtoliters, with a reference interval of 37 to 54 fL. RDW-CV is the RDW reported as a CV. Plateletcrit is the platelet volume ratio, analogous to the hematocrit. MPV is calculated from the plateletcrit and platelet count just as erythrocyte MCV is calculated from the hematocrit and RBC count. The proportion of platelets greater than 12 fL in the total platelet count may be an indicator of possible platelet clumping, giant platelets, or cell fragments.8,15,16 The XE series has the capability to run the platelet counting in the optical mode, which eliminates common interferences found with impedance counting. In the optical mode, a new parameter, immature platelet fraction or IPF, can be measured to provide additional information concerning platelet kinetics in cases of thromobocytopenia.39,40 The SE-9000/9500 uses four detection chambers to analyze WBCs and obtain a five-part differential: the DIFF, IMI, EO, and BASO chambers. The high-end instrumention such as the XE-5000 in the XE series has a six-part differential: neutrophils, lymphocytes, monocytes, eosinophils, basophils, and immature granulocytes. Every differential performed generates a percentage and absolute number for immature granulocytes, thus providing valuable information about the complete differential.37 In the DIFF detection chamber, RBCs are hemolyzed and WBCs are analyzed simultaneously by low-frequency DC and high-frequency current (DC/RF detection method). A scattergram of RF detection signals (y-axis) versus DC detection signals (x-axis) allows separation of the WBCs into lymphocytes, monocytes, and granulocytes. Floating discriminators determine the optimal separation between these populations. Granulocytes are analyzed further in the IMI (immature myeloid information) detection chamber to determine “immature (myeloid) information.” RBCs are lysed, and WBCs other than immature granulocytes are selectively shrunk by temperature and chemically controlled reactions. Analysis of the treated sample using the DC/RF detection method allows separation of immature cells on the IMI scattergram. A similar differential shrinkage and lysis method is also used in the EO and BASO chambers. That is, eosinophils and basophils are counted by impedance (DC detection) in separate chambers in which the RBCs are lysed and WBCs other than eosinophils or basophils are selectively shrunk by temperature and chemically controlled reactions. Eosinophils and basophils are subtracted from the granulocyte count derived from the DIFF scattergram analysis to determine the neutrophil count. User-defined distributional flags may be set, and instrument-specific suspect flags, similar to those described for the Coulter LH 700 series, are triggered for the possible presence of morphologic abnormalities.15,16 A POSITIVE or NEGATIVE interpretive message is displayed. Figure 39-7 shows a patient report from the XE-2100 analyzing the same patient sample for which data are given in Figure 39-6.
Automated Cell-Counting Instrumentation
General Principles of Hematology Instrumentation
Electronic Impedance
Radiofrequency
Optical Scatter
Principal Cell-Counting Instruments
Overview
Parameter
Coulter LH 750
Sysmex XE-2100
Abbott CELL-DYN 4000
Siemens ADVIA 2120
WBC
Impedance, hydrodynamic focusing
Hydrodynamic focusing, DC detection (impedance)
Optical scatter (primary count), impedance (secondary count)
Hydrodynamic focusing, optical scatter and absorption
RBC
Impedance
Hydrodynamic focusing, DC detection (impedance)
Impedance
Hydrodynamic focusing, laser low-angle (2-3 degree) and high-angle (5-15 degree) scatter
Hb
Modified cyanmethemoglobin (525 nm)
SLS-Hb (555 nm)
Modified cyanmethemoglobin (540 nm)
Modified cyanmethemoglobin (546 nm)
Hct
(RBC × MCV)/10
Cumulative pulse height detection
(RBC × MCV)/10
(RBC × MCV)/10
MCV
Mean of RBC volume distribution histogram
(Hct/RBC) × 10
Mean of RBC volume distribution histogram
Mean of RBC volume histogram
MCH
(Hb/RBC) × 10
(Hb/RBC) × 10
(Hb/RBC) × 10
(Hb/RBC) × 10
MCHC
(Hb/Hct) × 100
(Hb/Hct) × 100
(Hb/Hct) × 100
(Hb/Hct) × 100
Platelet count
Impedance (2-20 fL): least-squares fit of volume distribution histogram (0-70 fL)
Hydrodynamic focusing, DC detection (impedance) (approximately 2-30 fL)
Impedance (approximately 2-30 fL)
Hydrodynamic focusing, laser low-angle (2-3 degree) and high-angle (5-15 degree) scatter (1-60 fL)
RDW
CV (%) of RBC histogram: (SD/MCV) × 100
RDW − SD (fL) or RDW − CV (%) available
Relative value, equivalent to CV
CV (%) of RBC histogram: (SD/MCV) × 100
Reticulocyte count
Supravital staining (new methylene blue); volume, conductivity, optical scatter (VCS technology)
Supravital staining (auramine O); fluorescence detection
Proprietary stain (CD4K530), multiangle scatter, and fluorescence detection
Supravital staining (oxazine 750); low-angle (2-3 degree) and high-angle (5-15 degree) optical scatter and absorbance
Parameter
Coulter LH 750
Sysmex XE-2100
Abbott CELL-DYN 4000
Siemens ADVIA 2120
Neutrophils
VCS
Optical scatter and fluorescent staining
MAPSS
Peroxidase staining, optical scatter and absorption
Lymphocytes
VCS
Optical scatter and fluorescent staining
MAPSS
Peroxidase staining, optical scatter and absorption
Monocytes
VCS
Optical scatter and fluorescent staining
MAPSS
Peroxidase staining, optical scatter and absorption
Eosinophils
VCS
Optical scatter and fluorescent staining
MAPSS
Peroxidase staining, optical scatter and absorption
Basophils
VCS
Optical scatter and fluorescent staining
MAPSS
Differential lysis, laser low-angle (2-3 degree) and high-angle (5-15 degree) scatter
Coulter Instrumentation
Sysmex Instrumentation
Related posts:
![]()
Stay updated, free articles. Join our Telegram channel

Full access? Get Clinical Tree


Automated Cell-Counting Instrumentation