Acute Lymphoblastic Leukemia in Children


Acute Lymphoblastic Leukemia in Children


Elizabeth A. Raetz

Mignon Lee-Chuen Loh

Maureen M. O’Brien

James A. Whitlock


Acute lymphoblastic leukemia (ALL) is the most common childhood malignancy, accounting for approximately 20% of all cancers and 75% of all leukemias among patients younger than 20 years of age.1 Approximately 2,500 to 3,500 new cases of ALL are diagnosed in children each year in the United States with an incidence of 31.9 cases per one million person-years. Although most patients are younger than 5 years old, ALL occurs in an age-, gender-, ethnically, and socioeconomically diverse population.

Both in the clinic and in the laboratory, the vast heterogeneity of ALL is apparent. Patients may present with greater disease burden with symptoms of leukemic proliferation demonstrated, for example, by bone pain, lymphadenopathy, respiratory distress from a mediastinal mass, or abdominal discomfort secondary to organomegaly, or with no evident disease burden after a more insidious onset of symptoms related to marrow failure, such as, fatigue from anemia, fever from neutropenia, and bruising or bleeding from thrombocytopenia. Although most cases may be classified as B-precursor or T-cell ALL, great diversity is seen in the various combinations of B-, T-, and myeloid-associated membrane markers expressed by leukemia cells. Great diversity is also seen in the broad array of known cytogenetic and molecular abnormalities.2,3

ALL remained a fatal childhood disease until effective presymptomatic central nervous system (CNS) therapy was developed in the 1960s. Although combination chemotherapy provided frequent remissions (disappearance of microscopically detectable leukemia in the bone marrow with recovery of adequate marrow function), the subsequent appearance of leukemia cells in the CNS was common, and marrow relapse followed despite further treatment.

Over the following decades, better postinduction intensification has improved the 5-year event-free survival (EFS) from 50% to nearly 90% for children younger than 15 years of age (Fig. 76.1) and allowed replacement of craniospinal radiation for most patients with intrathecal therapy.4,5 Unlike other childhood cancers for which curative therapy is available, outcomes are best with prolonged treatment extending 2 to 3 years or more. Treatment is tailored to risk of relapse; patients at higher risk of relapse, as defined by specific clinical and biologic features, receive more aggressive treatment, whereas patients at lower risk of relapse obtain excellent outcomes with less morbid treatment. Initial response to induction therapy, assessed by multiparameter flow cytometry or PCR-based technology, now supplements presenting clinical features and cytogenetics for treatment allocation. Despite continued improvements in prognostication, treatment remains the most important prognostic factor.


FIGURE 76.1. Five-year relative survival rates by year of diagnosis for acute lymphoblastic leukemia (ALL) (all races, both sexes, age <20 years, 1975 to 2004, SEER Cancer Statistics).

Because the incidence of ALL is higher than other childhood cancers, the incidence of relapsed ALL is similar to the incidence of newly diagnosed pediatric cancers such as acute myeloid leukemia (AML) and Hodgkin lymphoma despite excellent initial cure rates. Outcomes after relapse, particularly marrow relapse, remain poor despite substantial success in inducing remission and the increasing application of allogeneic hematopoietic stem cell transplantation (HSCT). The majority of patients who relapse will ultimately die of their leukemia.

The diagnosis and characterization of ALL are discussed in Chapter 73. Cytogenetics are discussed in Chapter 3 and molecular genetics are discussed in Chapter 72. This chapter is concerned with the clinical characteristics, treatment, and late sequelae of childhood ALL. Therapy of Burkitt leukemia is addressed in Chapter 89.


PRESENTING CLINICAL FEATURES

Although it affects all age groups, the highest incidence of B-precursor ALL in children is between the ages of 1 and 5 years, with a peak incidence between 3 and 4 years (Fig. 76.2) where favorable cytogenetic patterns such as trisomies (trisomy 4 and 10)
and translocation t(12;21) are most common.6 This early peak is not seen in African Americans, and as a result, ALL is more common in children of Caucasian descent.7 Children of Hispanic ethnicity have the highest incidence of ALL, and emerging data suggest that genetic polymorphisms may contribute to both the increased risk of ALL for Hispanic children as well as inferior outcomes.8 Overall, ALL is slightly more common in males compared to females (1.3:1 ratio). Patients with T-cell ALL tend to be older (median age 9 years) and more commonly are male (75%).9


FIGURE 76.2. Age-specific incidence rates of ALL according to race and gender (SEER Cancer Statistics, 2000 to 2009).


TABLE 76.1 FREQUENCY OF CLINICAL AND LABORATORY FINDINGS AT DIAGNOSIS IN 178 CHILDREN AND ADULTS WITH ACUTE LYMPHOBLASTIC LEUKEMIA


Clinical Features


Percentage


Laboratory Features


Percentage


Symptoms


White blood cells (×109/L)


Fatigue


92


<10


40


Bone or joint pain


79


10-49


34


Fever without infection


71


50-99


15


Weight loss


66


≥100


11


Abnormal masses


62


Neutrophils (×109/L)


Purpura


51


<1


73


Other hemorrhage


27


1-2


9


Infection


17


>2


18


Physical findings


Packed cell volume (L/L)


Splenomegaly


86


<30


65


Lymphadenopathy


76


>30


35


Hepatomegaly


74


Platelets (×109/L)


Sternal tenderness


69


<50


62


Purpura


50


50-150


30


Fundic hemorrhage


14


>150


8


From Boggs DR, Wintrobe MM, Cartwright GE. The acute leukemias. Medicine 1962;41:163.


Symptoms and signs are a consequence of bone marrow failure or the infiltration of medullary or extramedullary sites by leukemia (Table 76.1). The onset of symptoms may be insidious and slowly progressive over weeks to months, or acute and explosive. In general, the more indolent the onset of symptoms, the better the outcome.10 Fatigue, lethargy, persistent fever, bruising or bleeding, and bone pain are the most common presenting complaints. Fatigue and lethargy correlate with the severity of anemia. No infectious basis for fever is found in many cases, especially if the neutrophil count exceeds 0.2 × 10⁹/L, but infection
must be presumed and treated with broad-spectrum parenteral antibiotics.11 Fever usually resolves promptly after the institution of antibiotics and chemotherapy.12 Thrombocytopenia may cause bruising and bleeding. Approximately 2% of children present with marrow findings consistent with aplastic anemia, followed by overt leukemia within weeks to months.13

Bone pain is a frequent complaint and may result from marrow expansion, bone erosion, or leukemic involvement of the periosteum. Young children, in particular, may present with gait disturbances or a refusal to walk. Vertebral compression fractures may complicate generalized osteoporosis, leading to back pain. Prominent skeletal symptoms occur primarily in children with no lymphadenopathy, organomegaly, or leukocytosis, and as a result, the diagnosis of leukemia often is delayed.14, 15 and 16 Less commonly, bone pain is caused by recurring episodes of bone marrow necrosis.17, 18 and 19 Marrow necrosis is also typically associated with a small leukemic burden and an aleukemic blood picture. In approximately 5% of patients with ALL, bone or joint pain may be the only presenting symptoms and patients may be referred for rheumatology evaluation for concern of juvenile rheumatoid arthritis (JRA). Diagnosis in these patients may be delayed, and differentiation of ALL from JRA is critical to avoid pretreatment with corticosteroids which might have a negative impact on subsequent diagnosis and risk stratification.20

Physical findings may include pallor, petechiae or purpura, mucous membrane bleeding, and fever. Extramedullary leukemic spread may be manifest by lymphadenopathy which is present in approximately 50% of patients, as well as splenomegaly and hepatomegaly which are frequently noted on imaging or examination but rarely cause symptoms.21 Skin involvement is rare; when it occurs, it presents as cutaneous nodules and is associated with a pre-B-cell phenotype.22

Approximately 60% of patients with acute T lymphoblastic leukemia (T-ALL) have enlarged anterior mediastinal lymphadenopathy at the time of diagnosis, which is rarely seen in children with B-precursor ALL. The presence of mediastinal mass at diagnosis does not have prognostic significance.23 The mediastinal mass may be asymptomatic and detected only on chest x-ray, or may cause cough and dyspnea, particularly on lying flat, or with facial swelling and plethora due to vascular compression with superior vena cava syndrome. Identification of clinically significant mediastinal adenopathy is critical prior to sedation for diagnostic procedures such as bone marrow aspiration.

Microscopic leukemic infiltration of the testes in males is common at presentation and requires no specific treatment. Testicular biopsy is discouraged at presentation as a routine part of staging, as it is likely to be positive, even in patients with a normal testicular examination. Overt testicular involvement with leukemia (2% to 3% of patients) presents as painlessly enlarged or irregular testes, and carries no adverse prognosis in the modern treatment era when treated with appropriately intense therapy.24,25

CNS involvement by leukemia occurs in approximately 2% to 3% of patients at diagnosis and is more common in patients with T-ALL. Most patients with CNS involvement are asymptomatic and only diagnosed by lumbar puncture. Rarely, symptoms include headaches, vomiting, or cranial nerve palsies.26


PRESENTING LABORATORY AND RADIOGRAPHIC FEATURES

The white blood cell (WBC) count is elevated in 60% of patients (see Table 76.1). Neutropenia is frequent. Although leukemic blasts are obvious in smears of patients with high WBC counts, they may be absent or found only after thorough review of blood smears from patients with decreased leukocyte counts. A WBC count in excess of 50 × 109/L is frequently associated with prominent lymphadenopathy, hepatosplenomegaly, and T-cell immunophenotype. A WBC count in excess of 200 × 109/L is termed hyperleukocytosis. Unlike the situation in AML, hyperleukocytosis rarely is complicated by intracerebral hemorrhages or pulmonary insufficiency.27 Although thrombocytopenia is common, patients with ALL do not present with isolated thrombocytopenia without other abnormal laboratory tests and/or physical findings.28

A large leukemic cell burden with a high rate of cell turnover may produce tumor lysis syndrome, that is, multiple metabolic disturbances, the most prominent of which is elevation of the serum uric acid level, which in turn may lead to urate nephropathy. Acute renal failure resulting from urate nephropathy may rarely be a presenting feature, but more commonly follows initiation of antileukemic treatment.29 Kidney function may be further diminished by leukemic infiltration of the kidney or extrarenal obstruction by enlarged lymph nodes. Increased cell destruction causes hyperphosphatemia and secondary hypocalcemia, which may lead to the precipitation of calcium phosphate in renal tubules and consequent acute renal failure, and hyperkalemia, leading in turn to cardiac arrhythmias or asystole.30,31 The availability of recombinant uricase, which breaks down uric acid, has improved the treatment of tumor lysis syndrome. The management of these metabolic complications is discussed in Chapter 69. Serum levels of lactic dehydrogenase (LDH) are increased because of an increased turnover of leukemic cells, but have no physiologic consequences and need not be repetitively monitored.

Although occurring less frequently than in AML, coagulopathies may lead to either hemorrhagic or thrombotic complications.32 Most often coagulopathy follows asparaginase administration and thrombosis is believed mediated by acquired antithrombin III deficiency leading to increased thrombin generation.33,34 The data for attempts to prevent thromboses with administration of antithrombin III concentrates remain less than compelling.

Radiographic examination of the chest demonstrates an anterior mediastinal mass in 5% to 10% of newly diagnosed patients with ALL, most commonly in patients with T-cell disease. The thymic mass may be associated with pleural effusions, which are frequently malignant and yield diagnostic cells upon thoracentesis. A large mediastinal mass represents a medical emergency, requiring careful monitoring and prompt initiation of chemotherapy, and complicating routine sedation or anesthesia. Skeletal lesions can be radiographically demonstrated in more than 50% of patients.35 The most common abnormalities include transverse metaphysical radiolucent lines adjacent to the zone of provisional calcification at the end of long bones, generalized rarefaction of bones, cortical and trabecular osteolytic lesions, and periosteal new bone formation.

Bone marrow aspiration is the standard method of establishing a diagnosis, and provides cells for morphologic, histochemical, immunophenotypic, cytogenetic, and molecular analysis. In bone marrow aspiration, careful attention is provided toward minimizing pain and fear for the patient and family, with the routine utilization of conscious sedation or general anesthesia. In ALL, the marrow is typically hypercellular with replacement of fat spaces and normal marrow elements by leukemic cells. In contrast to AML, residual myeloid and erythroid precursors appear morphologically normal. Megakaryocytes are decreased or absent. Bone marrow lymphoblasts are more homogeneous with respect to both morphologic and biologic characteristics than those in the blood. When marrow aspiration is unsuccessful due to increased cell density, a biopsy should be performed. As other diagnostic modalities such as flow cytometry can replace marrow morphology, examination of peripheral blasts, when present in sufficient quantity, may replace marrow aspiration or biopsy when aspiration is unsuccessful or clinically risky.

Lumbar puncture provides evidence of overt CNS involvement in approximately 3% of children with ALL at diagnosis.
Cytocentrifugation (cytospin) of cerebrospinal fluid (CSF) enhances diagnostic sensitivity by concentrating low numbers of cells. Involvement is classified as CNS 1 (no blasts on cytospin), CNS 2 (blasts on cytospin but CSF WBC < 5 cells/µl), and CNS 3 ( blasts on cytospin with WBC ≥ 5 cells/µl).36,37 Recent reports suggest adverse significance for CNS 2 status or a traumatic initial lumbar puncture with blasts in some series.37,38 As a result, it is recommended that the platelet count be elevated to >100 × 109/L by transfusion prior to the diagnostic lumbar puncture to minimize risk of a traumatic tap, and that the procedure be performed by the most highly skilled practitioner with the patient under general anesthesia. Cranial nerve findings in the absence of CSF blasts are highly suggestive of CNS leukemia.


RISK STRATIFICATION

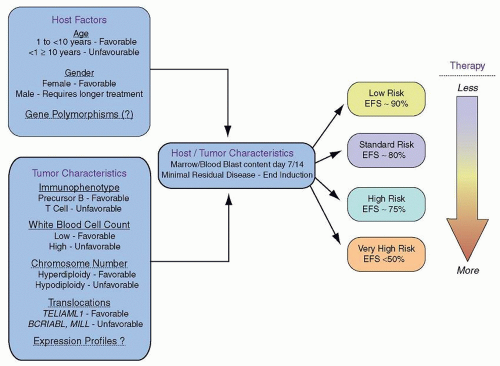
As therapy remains the single most important factor to influence outcome, the relative prognostic significance of characteristics at diagnosis (
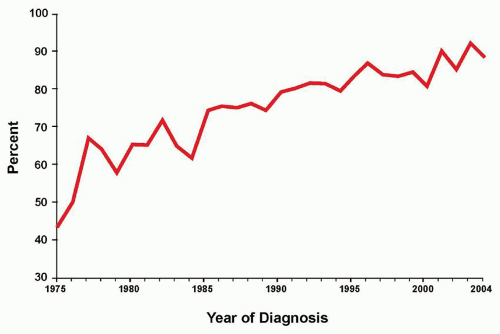
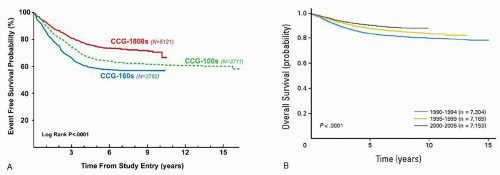
Table 76.2) varies for the different treatment strategies delivered by national and international investigators. Consequently, evolving combinations of clinical, laboratory, and response variables have been used to guide therapeutic intensity over the years by those who conduct clinical trials for childhood ALL, overall with increasingly successful results. Indeed, the Children’s Oncology Group (COG) recently reported that sequential outcomes of over 21,000 patients (age 0 to 22 years) enrolled on COG trials between 1990 and 2005 culminated in survival rates of 90.4% for those children treated between 2000 and 2005 (Fig. 76.3).5 Concomitantly, studies conducted on long-term survivors of childhood cancer reveal that up to 62% of patients suffer from at least one chronic condition and 27% suffer from a grade 3 or 4 condition.39 The goal of modern risk stratification, then, is to cure patients while minimizing acute and late toxicity, otherwise known as maximizing the therapeutic benefit.

Differences among the risk classification criteria used to deliver varied intensities of therapy by disparate groups have made accurate comparisons of outcomes difficult, if not impossible. To overcome this obstacle, an international workshop held in Rome in 198536 and a subsequent consensus workshop, sponsored by the United States National Cancer Institute in 1993, led to the development of common risk-based criteria.40 In 1993, the NCI-Rome risk criteria were agreed upon by leaders among the major clinical consortia in an attempt to analyze different datasets using two of the most powerful predictors of outcome across all studies for B-lineage ALL: age and presenting WBC count at diagnosis. The standard-risk group (NCI-SR) includes those patients with B-precursor ALL ages 1 to 9 years with a WBC count less than 50 × 109/L. In 1995, NCI-SR patients were estimated to have EFS rates of approximately 80% and the remaining high-risk (NCI-HR) patients were estimated to have EFS of approximately 65%.


TABLE 76.2 PROGNOSTIC FACTORS IN ACUTE LYMPHOBLASTIC LEUKEMIA


Determinants


Favorable


Unfavorable


White blood cell counts


<10 × 109/L


>200 × 109/L


Age


1-10 y


<1, >10 y


Gender


Female


Male


Node, liver, spleen enlargement


Absent


Massive


Testicular enlargement


Absent


Present


Central nervous system leukemia


Absent


Overt (blasts + pleocytosis)


FAB morphologic features


L1


L2


Immunophenotype


Pre-B or T


Early T-cell precursor


Ploidy


Hyperdiploidy>50


Hypodiploidy <44


Genetic markers (examples)


B lineage


Trisomies 4 and 10


t(12;21) (p13;q22) (ETV6-RUNX1)


iAMP 21


IKZF1 deletions/mutations


t(4;11) (q21;q23) (MLL-AFF1)


T lineage


t(1;14) (p32;q11) (TAL1-TRD@)


t(10;14) (q24;q11) (TLX1-TRA@/TRD@)


t(11;14) (p15;q11) (LMO2-TRA@/TRD@)


t(11;19) (q23;p13) (MLL-ENL)


t(10;11) (p13;q14) (PICALM-MLLT10)


t(5;14) (q35;q32) (TLX3-BCL11B)


t(7;7) or inv7 (p15q34) (HOXA-TRB@)


Time to remission


<8 d


>28 d


Minimal residual disease (day 28-56)


<10-4


>10-4


In the current era, approximately 85% of children with ALL will present with B-lineage disease and the remainder will present with T-lineage ALL. Two thirds of patients with B-lineage ALL present with NCI-SR features. Notably, the constellation of age and WBC count cannot reliably be used to predict outcome for patients with T-cell ALL, likely reflecting the different genomic and subsequent biochemical landscape of these malignancies. However, the unique biologic features of T-cell disease, the failure of prognostic factors effective in precursor B-cell ALL to predict outcome in T-cell ALL,41 the differing patterns of MRD between B- and T-lineage disease,42 and the advent of T-cell-specific therapies43,44 all argue for the separate stratification of T-cell ALL in classification and treatment, an approach that has been adopted by many cooperative childhood leukemia groups.

In addition, genomic factors appear to be increasingly relevant for older adolescents and young adults with B-lineage ALL, and recent discoveries may affect not only prognosis but therapy. Finally, for patients less than 1 year of age with B-lineage ALL, the most important adverse prognostic factor remains the presence or absence of a rearrangement (not deletion) in the mixed lineage leukemia (MLL) gene, which is most commonly seen in infants less than 3 months of age.


FIGURE 76.3. Survival by treatment era for patients enrolled in Children’s Oncology Group trials. A: Earlier trials of Children’s Cancer Group: CCG-160s, 1978 to 1983; CCG-100s, 1983 to 1988; CCG-1800s, 1989 to 1985. B: Overall survival probability by treatment era for patients enrolled onto Children’s Oncology Group trials in 1990-1994, 1995-1999, and 2000-2005. (With permission from Hunger SP, Lu X, Devidas M, et al. Improved Survival for Children and Adolescents With Acute Lymphoblastic Leukemia Between 1990 and 2005: A Report From the Children’s Oncology Group. J Clin Oncol 2012; 30:1663-1669.)

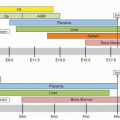
The successful intensification of therapy for high-risk ALL has weakened the power of many historically used adverse predictive factors (Fig. 76.4). Although the NCI-Rome criteria represented a major advance in risk classification of childhood ALL, these criteria did not adequately take into account more current biologic features, such as molecular genetic alterations, that likely contribute to the age and presenting WBC count. In addition other powerful predictors of outcome include early response to therapy, as measured by either flow cytometric or polymerase chain reaction methodologies to detect minimal residual disease (MRD). In particular, the strongest predictor of outcome for B-lineage disease across all studies in multivariable analyses is the presence or absence of MRD at the end of the first or second phase of therapy. Indeed, many of the large international consortia have devised complex algorithms to direct therapy, the separate components of which will be presented and then reintegrated into current risk stratification schemes used by the major consortia groups.


Molecular Genetic Alterations Contributing to Modern Risk Stratification

The prognostic significance of various genetic features of leukemic blasts has long been known (Fig. 76.5). In particular, very high risk features for relapse include the presence of the BCR/ABL, or Philadelphia chromosome (3% of B-lineage patients), extreme hypodiploidy (less than 44 chromosomes or a DNA index of less than 0.81; 3% of B-lineage patients), and intrachromosomal amplification of 21 (iAMP21; 1% to 3% of B-lineage patients).45,46,47,48,49,50 Recent analyses of 610 patients with Ph-positive ALL who did not receive tyrosine kinase inhibitor (TKI) therapy and who were treated between 1995 and 2005 revealed improved 7-year overall survival in contrast to those who were treated between 1986 and 1996 (OS 44.9 ± 2.2% vs. 36.0 ± 2.0%, P = 0.017).46 Therapeutic benefit was seen with the use of maximally intensive, myeloablative HSCT. However, the addition of continuous imatinib, a TKI to the backbone of dose-intensive chemotherapy in COG AALL0031 demonstrated for the first time that adding a targeted agent could provide a survival benefit for a disease that was otherwise only optimally treated using HSCT.45,51 (See Philadelphia chromosome-positive ALL in “Unique Patient Subgroups.”)

Similar improvements in outcome have not been established for patients diagnosed with hypodiploid ALL. Identified through either characteristic karyotype findings or DNA indices, rare cases of near-haploid ALL may escape detection due to the presence of a double hypodiploid clone, leading to “masked” near haploidy or hypodiploidy. However, in these cases, one clue may be the retention of two or four copies of chromosome 21, as this chromosome is never lost in a true hypodiploid genome. Experienced cytogenetic review can aid in the identification of these cases. Recent discoveries in the molecular genetics of hypodiploid ALL reveal a high frequency of genes regulating the RAS pathway (NF1, NRAS, KRAS, PTPN11, FLT3, and PAG1), IKZF3 (encoding the lymphoid transcription factor), and a histone gene cluster at 6p22 in near haploid ALL (<32 chromosomes), and a similarly high proportion of TP53, RB, and IKZF2 mutations in low hypodiploid ALL (32 to 39 chromosomes).52 Currently, although no specific targeted agents are known directly to inhibit the various perturbed pathways listed above, additional work is being performed in preclinical models in order to further identify optimal therapeutic strategies.

Intrachromosomal amplification of a region on chromosome 21 has also been associated with poor prognosis by several groups, with EFS rates below 60%.48,49,50 The detection of iAMP21 is relatively easy to distinguish using fluorescence-in-situ hybridization assays which are frequently performed to detect the ETV6/RUNX1 fusion gene. In these cases, not only is the favorable ETV6/RUNX1 fusion absent, but ≥5 RUNX1 (4 or more on a derivative chromosome) signals are present, signifying this amplification.

Although the poor outcomes of infants harboring MLL translocations have long been established,53 the outcomes for older patients have been controversial. Recent data from the COG on the outcomes of 155 patients older than 1 year (2.2% of the entire population studied) reveal that the majority of these patients present with NCI-HR features (4.3% of NCI-HR vs. 1.1% of NCI-SR patients). More than half of the MLL rearrangements were t(4;11), and the majority of the remainder were t(11;17) (16%), t:3;11) or t(11;19)(13% each). Although MLL-rearranged patients did poorly overall compared with non-MLL-rearranged patients, the presence of an MLL rearrangement was not statistically significant in a multivariable model. Instead, among MLL-rearranged patients who had a rapid response to induction therapy, EFS rates approached 81.1%, considerably better than anticipated. It should be noted, however, that in these clinical trials (AALL0331 and AALL0232), patients with MLL rearrangements were treated with maximally intensive augmented BFM therapy, thus illustrating the concept of “treating” away adverse prognostic factors.

Likewise, several leukemic blast genetic factors have been shown to be strong predictors of favorable outcomes among many consortia, including the ETV6/RUNX1 (formerly TEL/AML1) translocation and the presence of trisomy 4 and 10. Fortunately, these are some of the most common genetic features that occur in childhood ALL, with ETV6/RUNX1 occurring in approximately
25% and trisomy 4 and 10 occurring in approximately 18% of any risk childhood ALL. Some groups do risk stratify based on the presence of either or both of these factors; however, a multivariate analysis performed on >2,000 COG 9900 patients revealed that double trisomy of 4 and 10 retained independent significance whereas ETV6/RUNX1 did not. However, among patients with these genetic features and a rapid response to induction therapy within the first week, more than 98% were long-term survivors, leading COG investigators to incorporate response with leukemia-specific genetic factors in their current approaches to risk stratification.


FIGURE 76.4. Risk-group stratification in childhood ALL in 2005. A combination of clinical and biological features along with treatment response was used to select therapy. Children in lower-risk groups received less intensive therapy than those in higher-risk groups. (With permission from Carroll WL, Raetz EA. Building better therapy for children with acute lymphoblastic leukemia. Cancer Cell 2005;7:289-291.)


FIGURE 76.5. Kaplan-Meier event-free survival according to biologic subtypes. (With permission from Pui CH, Robison L, Look TA. Acute lymphoblastic leukemia. Lancet 2008;371:1030-1043.)

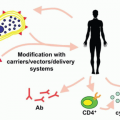
Additional genetic factors that may affect risk stratification and therapy in the future, and are thus beyond the scope of this chapter include those patients who have been recently identified to display a Ph-like gene expression profile (GEP) without harboring BCR/ABL (15% of NCI HR patients). These patients frequently harbor genomic rearrangements in CRLF2 with subsequent overexpression of the TSLP receptor, JAK family mutations, or novel kinase fusion genes. It is important to note that the Ph-like GEP is an independently poor prognostic factor in multivariable analyses when analyzed among NCI HR patients treated on AALL0232, and thus supports identifying alternative approaches, similar to the TKI+ chemotherapy approach used for Ph+ ALL, to maximize outcomes for these patients.53a


Response to Induction and Minimal Residual Disease

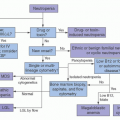
Response to induction has long been valued as a predictor of outcome. In 1983, investigators in the Berlin-Frankfurt-Münster (BFM) group evaluated the use of a 7-day prophase of prednisone and a single dose of intrathecal methotrexate to determine which patients should receive more intensive therapy. Prednisone poor responders (PPR), or those who had more than 1,000 circulating blasts day 8 of therapy, comprised 10% of their population and had an outcome that was 50% as good as the prednisone good responders (PGR). In subsequent protocols beginning in 1986, therapeutic questions were asked of the PPR versus PGR group, and this continues currently. In parallel efforts, the legacy
Children’s Cancer Group (CCG) also determined that delivering augmented therapy to those NCI HR patients with a poor bone marrow morphology response (day 7 M2 (5% to 25% blasts by morphology) or M3 (>25% blasts by morphology) improved their outcome.54

The technological ability of measuring response to induction using residual blasts grew out of these initial observations. The ability to detect small numbers of leukemic cells in peripheral blood or bone marrow samples from patients in clinical remission by highly sensitive methods such as the polymerase chain reaction55,56,57,58,59 or multiparametric flow cytometry60,61,62 has enabled the monitoring of MRD, with the possibility of intensifying therapy for patients at higher risk of relapse. A number of studies have demonstrated the ability to identify impending relapse in subsets of patients, based on correlation of detection of MRD during or following completion of therapy.55, 56, 57 and 58,63 Although variations in the sensitivity and specificity of the methods used to detect and to quantify MRD, as well as questions raised by the unexpected finding of persistent genetic abnormalities related to the leukemic clone in patients in apparent sustained remissions58,64,65 initially delayed the implementation of MRD assessment in patient management, recent studies using improved methodologies have shown that detection of MRD by either multiparametric flow cytometry analysis of leukemia-associated antigens66,67,68 or polymerase chain reaction detection of leukemia-specific immunoglobulin and T-cell receptor rearrangements61,69, 70 and 71,72 definitively correlates with outcome. Indeed, the presence of MRD early in the treatment of ALL patients is highly prognostic of outcome and currently is a key variable to determine the intensity of postinduction therapy for many groups. In the COG 9900 series of clinical trials, end induction bone marrow MRD and day 8 peripheral blood MRD were the most powerful predictors of outcome in a multivariable analysis.68 It should be noted, however, that MRD is not the sole predictor of outcome in this model; NCI risk group and genetic factors also remain prognostic, thus justifying the current approach that the COG is using in determining risk stratification. Other groups, including the St. Jude Children’s Research Group (SJRCH) and the Dana-Farber Cancer Institute (DFCI) incorporate measurements of MRD at the end of induction to intensify patients for additional therapy. Despite MRD being the most powerful predictor of outcome, up to 50% of children who relapse do not have evidence of disease using these sensitive methodologies, implying that additional features, such as critical genetic lesions, affect outcome.


TABLE 76.3 OVERVIEW OF THE AALL08B1 CLASSIFICATION SYSTEM FOR B-PRECURSOR ALL


Risk Group (% pts)


Low (15%)


Averagea (36%)


Highb (25%)


Very High (25%)


Projected 5-year EFS


>95%


90-95%


88-90%


<80%


NCI risk group


SR


SR


SR


SR


SR


HR (<13 years)


SR


HR


HR (≥13 years)


SR or HR


Favorable geneticsc


Yes


Yes


No


Yes


No


Any


No


Any


Any


Any


Unfavorable Characteristicsd


No


No


No


No


No


No


No


No


No


Yes


Day 8 PB MRD


<0.01%


≥0.01%


<1%


Any


≥1%


Any


Any


Any


Any


Any


Day 29 BM MRD


<0.01%


<0.01%


<0.01%


≥0.01%


<0.01%


<0.01%


≥0.01%


≥0.01%


<0.01%


Any


BM bone marrow; HR, high risk; MRD, minimal residual disease; PB, peripheral blood; SR, standard risk.


a NCI SR patients who are CNS2 may be included in an average risk, but will not be eligible for the low risk arm.

b All patients with testicular leukemia will be assigned as HR at start Induction, but may change to VHR if Day 29 MRD ≥0.01% or unfavorable characteristics are present.

c “Yes” is defined as the presence of double trisomy 4 and 10 or ETV6-RUNX1 fusion.

d Consists of patients with CNS3, hypodiploidy (<44 chromosomes and/or DNA index <0.81), iAMP21, Induction failure (m3 marrow Day 29), or MLL rearrangement (not MLL deletion). BCR-ABL1 positive patients are eligible for a separate Ph+ ALL study.


Adapted with permission from Hunger SP, Loh ML, Whitlock JA, et al. Review Children’s Oncology Group’s 2013 blueprint for research: acute lymphoblastic leukemia. Pediatr Blood Cancer 2013;60: 957-963.


The clinical use of MRD at the end of the first phase of therapy (traditionally deemed “induction”) or the second phase of therapy (“consolidation”) remains somewhat consortium dependent. In T-cell ALL, the prognostic significance of MRD appears in at least one report to be more powerful at the end of the second phase of therapy than at the end of the first phase.73

Finally, outcomes for the small number (<3%) of pediatric patients who fail to attain remission following induction therapy, although predictably poorer than other patients, are not as dismal as might be expected.74 An intergroup study of 1,041 patients who failed induction reported a 10-year survival of 32±1%. Age ≥10 years, T-cell leukemia, the presence of 11q23 rearrangement, and ≥25% blasts at end of induction had a poor outcome. However, children <6 years of age with precursor B-ALL and without adverse genetics had a 10-year survival at 72±5% when treated with chemotherapy only. Patients with T-cell leukemia had improved survival with allogeneic HSCT.


Current Approaches to Staging/Stratification

Based on the collective information above, the COG has developed a risk-stratification system that incorporates key clinical features including National Cancer Institute (NCI) risk group75 [Standard Risk (SR): age 1 to 9.99 years and initial WBC count <50 × 109/L; High Risk (HR): age 10+ years and/or initial WBC ≥50 × 109/L], immunophenotype, presence/absence of central nervous system or testicular leukemia, presence/absence of specific sentinel genetic lesions [good risk: ETV6RUNX1 fusion or hyperdiploidy with trisomies of chromosomes 4 and 10; poor risk: MLL-rearrangements (MLL-R), hypodiploidy, intrachromosomal amplification of chromosome 21 (iAMP21), Philadelphia chromosome positive (Ph+) ALL], and early minimal residual disease response for risk stratification and treatment allocation.51,68,76 The current risk stratification system (AALL08B1) builds on that developed for the first generation COG ALL trials (AALL03B1) with key differences being changing the MRD threshold used to define poor response from ≥0.1% (AALL03B1) to ≥0.01% (AALL08B1), and incorporating day 8 peripheral blood [and day 29 bone marrow (BM)] MRD measurements while eliminating day 8/15 BM morphology77 (Table 76.3).


Oct 21, 2016 | Posted by in HEMATOLOGY | Comments Off on Acute Lymphoblastic Leukemia in Children

Full access? Get Clinical Tree

Get Clinical Tree app for offline access