Use of Geographic Information Systems in Infectious Disease Surveillance
1 Centers for Disease Control and Prevention, Fort Collins, CO, USA
2 Colorado State University, Fort Collins, CO, USA
Introduction
Maps are important tools in infectious disease surveillance. They are commonly used to depict where infectious disease cases most frequently occur and also can be used to generate hypotheses about the causes underlying the spatial distribution of disease cases. In 1854, in what has been lauded as the dawn of epidemiology, John Snow prepared maps showing the locations of cholera cases in relation to public water sources in London, England. The clustering of cases around the Broad Street water pump implicated this particular pump as the source of the agent causing the cholera cases. Snow’s maps were used to support his argument that cholera was a waterborne disease, which was in striking contrast to the prevailing thinking of the time that the disease (for which the etiological agent had not yet been identified) was caused by inhaling foul air [1].
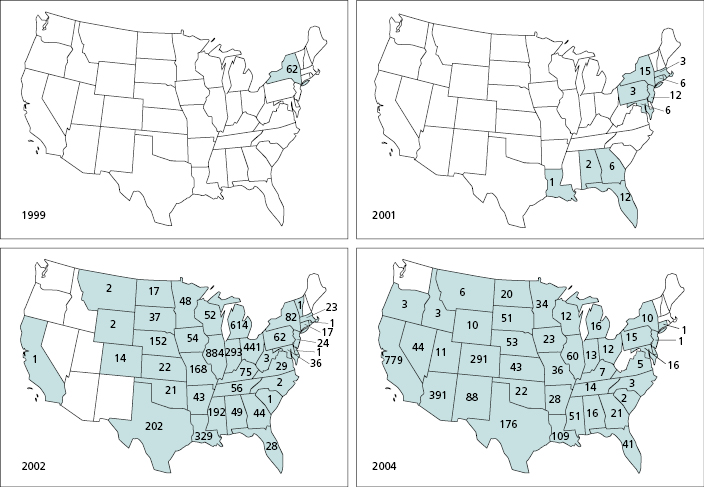
Modern epidemiology seeks answers to the same type of questions as those addressed by John Snow: Where and when are infectious disease cases occurring, how are people exposed to the causative agents, where and when are the next cases likely to occur, and how can we best prevent future cases? Geographic information system (GIS) technology has greatly increased the speed and accuracy with which spatial information on infectious disease cases can be collected and integrated with other types of geographic information to track the spread of disease cases and clarify pathogen transmission dynamics. For example, GIS technology was used to map the westward spread of West Nile virus from New York, where it was introduced in 1999, to the West Coast of the United States where the virus had become widely established by 2004 [2] (Figure 20.1). This also resulted in timely delivery of up-to-date maps to the public by the Centers for Disease Control and Prevention (CDC) and the United States Geological Survey (USGS) through GIS-based map services that provide information for West Nile virus infection in humans, domestic animals, wild birds, and vector mosquitoes [3,4]. In addition, by combining environmental variables (e.g., temperature, precipitation, elevation, land cover) with epidemiological data for West Nile virus disease within a GIS, researchers have identified environmental correlates of areas with elevated disease risk and have projected where additional cases were most likely to occur [5]. In this chapter, we provide an overview of how GIS technology is used to address fundamental questions in infectious disease surveillance: where disease cases have occurred; how the causative agents are perpetuated; and how limited surveillance, prevention, and control resources should be targeted in space and over time to most effectively prevent future cases. We also address key challenges to the effective use of GIS in infectious disease surveillance.
An Overview of geographic information system Technology
A GIS is a computer-based, spatially explicit relational database with a graphical user interface that is designed to store and display spatial information and to integrate information from multiple sources for any given spatial extent [6]. A relational database is a database that is structured to join multiple pieces of information (in this case to a specific geographical location); a graphical user interface is a visual or graphical way of interacting with computer software; and spatial extent is the geographic domain encompassed by the data collection or model output. A GIS provides capacity to develop and display customized maps. Advanced GIS software typically also has extensive built-in capacity for spatial analyses. GIS technology is distinct from emerging, Internet-accessible mapping technologies, such as Google Earth, which provide access to images of the physical environment but where additional functionalities are limited to basic feature-making tools for map overlays. In a GIS, each piece of included information is captured as a data layer with associated attributes. For example, locations of disease cases, based on source location for the infection or the home address of the afflicted person, may be mapped using data obtained from global positioning system (GPS) receivers. The GPS-derived longitude and latitude of the disease case location provides a spatial reference for the case. Disease case points within such a disease case data layer can then be associated with, or overlaid upon, other spatially explicit data layers containing relevant information. Drawing upon the cholera example described above, one data layer within a GIS might contain point locations of cholera cases. Associated with this data layer, attributes such as age and sex of cases and outcome of infection may be recorded. Each cholera case point would then be displayed in relation to other data layers contained within the GIS, such as locations of water pumps, sewers, streets and houses. Each of these additional data layers might also contain relevant attribute data such as maintenance records for each pump or socioeconomic information for neighborhoods or individual households.
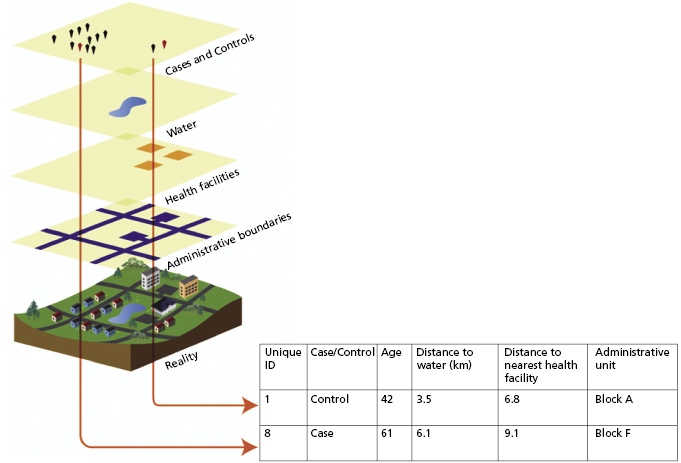
Spatial and temporal information (data layers and associated attributes) stored within a GIS provides a foundation for spatial and space–time analyses of infectious disease trends. Any of the data layers contained within a GIS can be displayed in map format, and spatially referenced information can be extracted from the GIS and used to perform statistical analyses (Figure 20.2). Some of the most commonly used data layers in infectious disease surveillance include (1) epidemiological data, (2) administrative boundaries (e.g., country, state, county), (3) locations of healthcare facilities, (4) socioeconomic data (e.g., census data), and (5) environmental data related to the disease of interest (e.g., locations of water sources for waterborne diseases, land-cover type and climatic variables for vectorborne diseases). Some of these data, especially those relating to the physical landscape (e.g., vegetation type, elevation, or locations of water bodies), can be obtained through the use of remote sensing technologies such as satellite imagery or aerial photography [7]. Data layers are provided through a wide variety of sources and range in cost of acquisition from free of charge to very expensive. Should critical information (e.g., different aspects of the infrastructure of developed areas, political boundaries) not already be available as a GIS data layer), it may be digitized by recording spatial coordinates from other sources, such as paper-based maps or surveys or Internet-accessible mapping technologies providing images of the physical environment.
Current Uses of the geographic information system in Infectious Disease Surveillance
After data are imported into a GIS, spatial information is used within the field of public health (1) to depict trends in disease cases in space and over time, (2) to coordinate a public health response to an outbreak, or (3) to identify spatial factors that are correlated with elevated risk for disease case occurrence and, thereafter, to extrapolate from this point-based information to develop a continuous risk map surface.
Depicting Trends in Space and Over Time
Tracking and mapping of trends of disease case occurrence or disease incidence in space and over time is a core activity in infectious disease surveillance. It allows for targeting of surveillance and control resources to the areas and time periods where they have the greatest impact. The generated maps also can be used by individuals of the public to assess their personal risk for infection and to make informed decisions regarding the need for personal protective measures. Surveillance of vector-borne diseases also can be complemented by tracking of the arthropod vectors and the presence of the pathogen in these vectors (vectorborne pathogen surveillance). This is exemplified by the publication in 1998 of distributional maps for the primary tick vectors (Ixodes scapularis and Ixodes pacificus) of the causative agent of Lyme disease in the United States (the bacterium Borrelia burgdorferi) to help identify areas potentially presenting risk for infection and to assess the need for personal protection measures [8].
Rapid collection of standardized disease data is a key component of disease case tracking. To achieve this, in collaboration with state public health agencies, the United States Centers for Disease Control and Prevention has implemented a National Electronic Disease Surveillance System (NEDSS) for reportable diseases [9]. Furthermore, the recent emergence of mosquito-borne West Nile virus in North America resulted in new electronic surveillance systems for mosquito-borne arboviruses both in the United States [10] and Canada [11]. Importantly, the information for West Nile virus infections was made accessible to the public in map format (Figure 20.1) through a regularly updated website [10]. During the westward spread of the virus from 1999 to 2004 this provided critical and readily accessible information both for state and local public health entities regarding the need for setting up surveillance and control programs and for the public regarding the need for personal protection measures such as use of mosquito repellents.
The global effort to eradicate malaria also produced a major initiative to define the areas where malaria occurs and the intensity of local transmission of malaria parasites in the Malaria Atlas Project [12]. The Malaria Atlas Project generates map-based information for a wide range of factors that can be used to inform continental or global malaria elimination or eradication strategies as well as determine the need for local malaria surveillance and control programs [13]. Key factors presented in map format include the spatial distributions of different human malaria parasites (Plasmodium falciparum and Plasmodium vivax) and their primary mosquito vectors (Anopheles species), the clinical burden of Plasmodium falciparum malaria in humans, and the P. falciparum basic reproductive number. (The basic reproductive number is the number of secondary infections arising from a focal infection, often referred to as R0.)
Using Spatial Information to Respond to Outbreaks
Outbreaks, or epidemics, are defined as the occurrences of more cases of disease than expected in a given area or among a specific group of people over a particular period of time. Mapping and GIS technologies are being used increasingly to aid in emergency responses to infectious disease outbreaks. For example, access to geographic information including where disease cases have occurred in relation to the distribution of human populations and to transportation networks can greatly facilitate prevention and response activities. This was exemplified by a recent response to a poliomyelitis outbreak in the Democratic Republic of Congo (DRC) [14].
Polio, a debilitating viral disease that affects the nervous system and can lead to paralysis, is spread by direct contact between infectious and susceptible persons or through contact with infected mucus or feces [15]. By 2004, as a result of global vaccination efforts to eradicate polio, the DRC was free of polio cases. Then an outbreak occurred in 2006. In response, a massive vaccination campaign was launched to contain the spread of the poliovirus. The first phase of the vaccination campaign had little impact on containing the outbreak; and a more targeted approach (the “river strategy”) was implemented after mapping of cases revealed a progression of spread along the Congo River. The river strategy sought to target vaccination efforts to populations neighboring the Congo River. In this part of the world where detailed maps of populations and transportation networks, including rivers and tributaries, are sparse and often outdated, integration of data from satellite-derived imagery accessed through Google Earth into a GIS hastened efforts to dispatch the vaccines leading to a decline in cases in the targeted area [14].
In another example [16,17], GIS and spatial analysis played an integral role in the design of an oral rabies vaccine (ORV) distribution campaign. In the late fall of 2008, rabies, which is a viral infection that is spread primarily through bites delivered by infected animals, reappeared in foxes in the mountainous region of Italy after approximately a decade’s absence. In response, authorities launched an ORV campaign designed to contain the outbreak. Given the timing of the outbreak in relation to the onset of winter and the sensitivity of the oral vaccine to freeze–thaw cycles, it was decided that the vaccine would be distributed only at elevations where temperatures would be conducive to the delivery of active vaccine (<1000 m for the winter and <1500 m for the spring). After unsuccessful attempts to manually distribute vaccine baits, a digital elevation model was used within a GIS to determine, based on elevation and topography, the optimal places for helicopters to distribute the ORV [16]. Rabies surveillance data collected subsequent to the initial vaccination effort were used to analyze spatial trends in the distribution of rabid foxes. The analysis indicated that initial efforts were effective at controlling the spread of rabies. However, case clusters were detected above 1500 m. These findings prompted officials to modify the summer vaccination campaign to include sites up to 2300 m elevation [17]. The spatial analysis had a significant impact on the efforts to control rabies because the results contradicted previous assumptions about the upper elevation thresholds for which ORV should be distributed within mountainous regions.
Identifying Spatial Risk Factors and Predicting and Extrapolating Spatial Trends
Related posts:
 18: Implementation of the National Electronic Disease Surveillance System in South Carolina
5: Surveillance for Vaccine-Preventable Diseases and Immunization
3: National, State, and Local Public Health Surveillance Systems
8: Surveillance for Foodborne Diseases
6: Surveillance for Seasonal and Novel Influenza Viruses
13: Surveillance for HIV in the United States
18: Implementation of the National Electronic Disease Surveillance System in South Carolina
5: Surveillance for Vaccine-Preventable Diseases and Immunization
3: National, State, and Local Public Health Surveillance Systems
8: Surveillance for Foodborne Diseases
6: Surveillance for Seasonal and Novel Influenza Viruses
13: Surveillance for HIV in the United States
Stay updated, free articles. Join our Telegram channel

Full access? Get Clinical Tree


