Fig. 18.1
Structure of mTOR. The amino terminal contains tandem HEAT repeats and a FAT domain of unclear function. The kinase domain lies on the carboxy terminal of mTOR and is linked to FAT by FKBP12-rapamycin binding (FRB) domain
18.2 Activity of mTORC1
mTORC1 acts as a sensor and signaling intermediary for nutrient availability, energy levels, and mitogenic growth factors in order to regulate cap-dependent protein translation [1, 12–17]. In essence, mTORC1 functions to ensure that adequate supplies of metabolic precursors as well as positive mitogenic signaling are present prior to cell growth and proliferation. mTORC1 activates the S6 kinases, which subsequently modify the ribosomal protein S6 and the eukaryotic initiation factor 4B (eIF4B), stimulating protein translation. Additionally, mTORC1 suppresses activity of the eIF4E-binding proteins (4E-BPs) via phosphorylation of threonine residues. The 4E-BPs (including 4E-BP1, 2, and 3) function to prevent transcription of eIF4E-dependent mRNAs and formation of key initiation complexes. Thus, when active, mTORC1 deactivates 4E-BPs, releasing eIF4E and enabling the formation of complexes required for initiation of protein synthesis [18–20]. mTORC1 can also bind to PRAS40, which may serve as an inhibitor of mTORC1 by competing with binding to S6K and 4E-BPs, although further elucidation of its role is required. Additional direct activities of mTORC1 may include regulation of lipogenic factors involved in lipid synthesis, as well as inhibition of autophagy and stimulation of mitochondrial biogenesis.
Activity of mTORC1 is governed by both extracellular and intracellular signals (Fig. 18.2). With regard to extracellular activation, mTORC1 responds to receptor-mediated signal transduction cascades initiated through binding of extracellular ligands such as insulin growth factor 1 (IGF-1), epidermal growth factor (EGF), and transforming growth factor (TGF-α) to transmembrane tyrosine kinases triggering their autophosphorylation. Subsequent signaling through the PI3K-Akt cascade results in inhibition of the tuberous sclerosis complexes (TSC1 and TSC2) which in turn release their inhibition of mTORC1 [22]. Akt activation by PI3K is further regulated by the phosphatase and tensin homologue PTEN [23]. Internally, mTORC1 activity can be regulated by hypoxic conditions through REDD1 (regulated in development and DNA damage responses) and energy/nutrient depletion through LKB1-AMPK, either of which can reactivate the mTORC1 suppressors TSC1/TSC2 [24, 25]. mTORC1 is also sensitive to amino levels through Rag GTPase activity ([26] Smith).
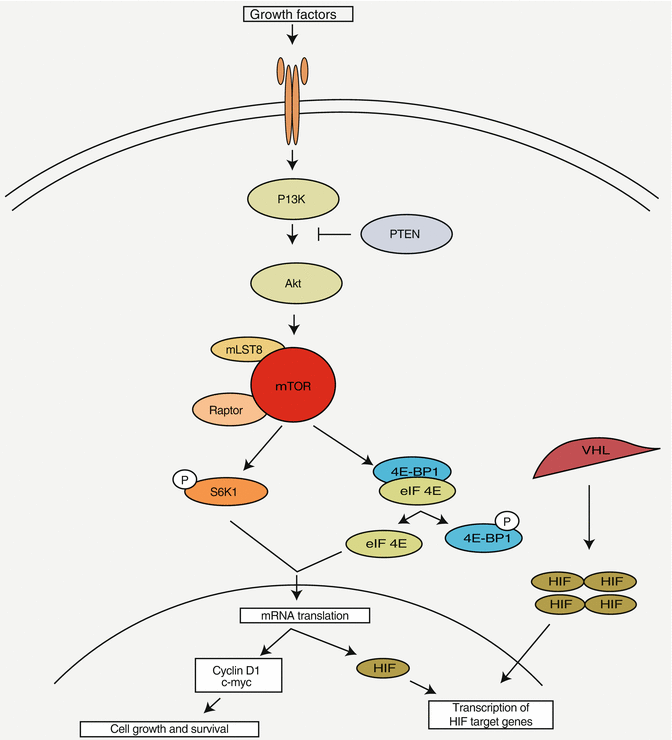
Fig. 18.2
Akt/PI3K/mTOR signaling pathway. mTOR binds to raptor and mLST8 to form mTORC1. MTORC1 is activated by Akt, which is activated by PI3K. PTEN inhibits the activation of Akt by PI3K. Downstream, mTOR phosphorylates p70S6K1 (S6K1) and 4E-BP1 leading to activation of pathways involved in cell growth and survival as well as translation of HIF. In RCC, inactivated VHL is unable to facilitate HIF-α proteolysis leading to HIF accumulation. HIF production is also induced by the activation of the mTOR pathway. The active intranuclear HIF-α induces transcription of HIF target genes such as VEGF and PDGF (Adapted from Rini and Atkins [21])
Components of mTORC1 upstream regulatory pathways are commonly dysregulated in cancer. Loss of PTEN function, through deleterious mutations or promoter methylation [27], or the presence of oncogenic mutations in the PI3K gene leads to constitutive phosphorylation of Akt and mTOR activation. Similarly, mutations in LKB1 and TSC1/2 have been reported [28, 29].
18.3 Activity of mTORC2 and Homeostatic Feedback Loops
Regulation of mTORC2, the alternative protein complex formed by mTOR and rictor, is not well elucidated. This complex is generally considered to be rapamycin insensitive in most cell types, although prolonged rapamycin exposure has been reported to impede assembly of the mTORC2 complex in some cases [30]. mTORC2 has been proposed to regulate members of the AGC family of protein kinases, including SGK1 (serum- and glucocorticoid-induced protein kinase 1) involved in ion channel regulation [31]. Intriguingly, mTORC2 upregulates AKT phosphorylation at the Ser473 residue, highlighting the complexity of the mTOR signaling network: while mTOR in the mTORC1 complex is a downstream recipient of AKT signaling, mTOR in the mTORC2 complex is an upstream activator of AKT. Such a relationship may reflect the cellular tendency toward homeostatic correction of signaling imbalances. Further regulatory feedback loops are suggested by the observation that the S6 kinases activated by mTORC1 can repress activity of insulin and insulin-like growth factor (IGF) receptors through degradation of insulin receptor substrate (IRS) proteins which serve as scaffolds for the receptors [32, 33]. This, in turn, reduces receptor-mediated signal transduction through the PI3K-Akt pathway diminishing mTORC1 activity, completing the negative feedback loop. Similar negative feedback loops involving receptors other than insulin and IGF are thought to be operational (reviewed in [34]). A somewhat disconcerting consequence of disrupting these homeostatic processes is that treatment with rapamycin has been shown to induce AKT phosphorylation, which may exert oncogenic activity through mTORC1-independent mechanisms.
18.4 mTOR in RCC
In clear cell carcinoma, the most common histologic subtype of RCC, neoplasia is typically driven by inactivation of the von Hippel-Lindau (VHL) gene [35, 36]. The VHL protein mediates proteasomal degradation of the hypoxia-induced factor (HIF)-1α [37]. When VHL function is disrupted, increased stabilization of HIF-1α results in transcriptional upregulation of genes that promote cell survival and angiogenesis, including vascular endothelial growth factor (VEGF), platelet-derived growth factor (PDGF)-β, and transforming growth factor-α (TGF-α) [38–43]. Further regulation of HIF-1α is achieved by mTOR through the downstream effects of S6K1 and eIF-4E which enhance mRNA translation [21]. Upstream of mTOR, loss of PTEN function has been observed in 20–30 % of RCC tumors [38, 44, 45]. Inhibition of mTOR therefore is likely to decrease angiogenesis in addition to possible direct tumor effect on proliferation and survival.
In an immunohistochemical study, phospho-mTOR staining showed moderate to strong signal in 14 out of 29 clear cell carcinoma specimens, concordant with enhanced phosphorylation of S6K [46]. In a larger study [47] using antibodies against pAkt, PTEN, p27, and pS6 on a tissue microarray constructed from specimens from 375 patients with RCC, the mTOR pathway was found to be more active in clear cell carcinoma, high-grade tumors, and tumors with poor prognostic features.
18.5 mTOR Inhibitors
18.5.1 Rapamycin and Rapamycin Analogues
Rapamycin (sirolimus) is a macrolide secreted by Streptomyces hygroscopicus, which was initially isolated from an Easter Island soil sample and reported in 1975 [2, 48]. It was originally described as having antifungal properties with particular activity against Candida. Its immunosuppressive [49] properties were later discovered, leading to its wide use in the post-organ transplantation setting [50]. Additionally, it was found to have unique antitumor properties [51, 52].
Rapamycin and its three analogues, temsirolimus, everolimus, and ridaforolimus (formerly deforolimus), have been investigated as possible anticancer agents. These three rapamycin derivatives differ from the original rapamycin molecule at the C43 position through the addition of an ester, ether, or phosphonate group for temsirolimus, everolimus, and ridaforolimus, respectively (Fig. 18.3). Presently, ridaforolimus is at early stages of clinical investigation, while the other analogues have been more extensively studied. Further details are provided in subsequent paragraphs.
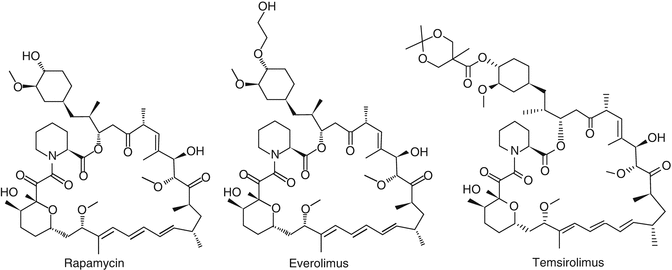
Fig. 18.3
Structure of rapamycin, everolimus, and temsirolimus. Everolimus and temsirolimus substitute the hydroxyl group on carbon 43 in rapamycin by an ether and ester group respectively
18.5.1.1 Temsirolimus
The first mTOR inhibitor to be approved for RCC is temsirolimus (CCI-779), a water-soluble ester analogue of rapamycin. Temsirolimus has been shown to inhibit the growth of normal and cancer cells in vitro [53–56]. Similarly, temsirolimus has been demonstrated to inhibit the growth of various solid tumors including prostate and breast cancer xenografts that are PTEN null and/or Akt overexpressing [57, 58].
Phase I Studies
Dosing
The dosing and safety of intravenous temsirolimus have been investigated in early phase clinical trials in patients with advanced solid tumors [59–62]. The maximum tolerated dose (MTD) with a cyclic dosing regimen (daily for 5 days every 2 weeks) was 15–19 mg/m2 [63]. In a dose-escalation phase I study, a weekly, 30-min infusion regimen permitted the use of higher doses (7.5–220 mg/m2) [60]. MTD was not truly achieved, despite the development of thrombocytopenia and reversible rash and stomatitis. In addition, objective partial and minor tumor regressions were seen at doses lower than the MTD. In addition, the variability predicted with flat doses was comparable to body surface area-normalized treatment. Hence, flat dosing was subsequently used for further clinical development [60].
Clinical trials in various advanced cancers thereby used weekly IV doses of 25, 75, or 250 mg [64–66]. The dose needed for optimal biologic activity (i.e., inhibition of mTOR activity) was studied in peripheral blood mononuclear cells [65]. This activity was determined by a decrease in the activity of S6K1, a downstream protein from mTOR, and 25 mg was shown to be sufficient to induce inhibition of this target.
Pharmacokinetics
Absorption
Temsirolimus administered intravenously at a dose of 25 mg weekly resulted in a mean maximal drug concentration of 585 ng/mL in whole blood, corresponding to a mean AUC of 1,627 ng h/mL [66]. Its active metabolite, sirolimus, is 40 % bound to lipoproteins in the blood; consequently, elevated plasma lipoprotein levels will increase sirolimus plasma concentrations. In 18 patients with mild to moderate hepatic impairment who received a single dose of sirolimus, the clearance of sirolimus was decreased by more than 30 % [67]; thus, it is recommended that the dose of temsirolimus be reduced to 15 mg weekly in the setting of hepatic impairment.
Metabolism
Temsirolimus is metabolized through oxidative hydrolysis to yield sirolimus, the active metabolite [68]. Both temsirolimus and sirolimus are metabolized by the cytochrome P450 (CYP)3A4 pathway to yield several demethylated and hydroxylated isomeric products [69, 70]. Sirolimus is generated 15 min after temsirolimus infusion and reaches a peak at 0.5–2.0 h, followed by a mono-exponential decrease [60]. The concentration of sirolimus is higher than temsirolimus with a mean AUC ratio (sirolimus/temsirolimus) of ~2.5–3.5. When temsirolimus was administered at doses higher than 34 mg/m2, residual concentrations of sirolimus were noted before the scheduled treatment but did not result in rising concentrations of sirolimus after repeated cycles [60].
Elimination
Temsirolimus is excreted predominantly via the feces. When a single 25 mg dose of radiolabeled temsirolimus is administered, 78 % of the radioactivity can be recovered from the feces. Approximately 5 % is recovered in the urine, suggesting a minimal role for renal clearance of temsirolimus. Its mean half-life at a standard dose of 25 mg is approximately 13 h with a total plasma clearance (CL) of 16 l/h. Its active metabolite has a longer half-life with a mean between 61 and 69 h [71] and hence results in higher concentrations than temsirolimus. The clearance is moderate and increases substantially with increasing dose and has a minimal patient intervariability. This is thought to be a result of saturable specific binding of CCI-779 to FKBP in the red blood cell [61].
Tumor Response and Toxicity
In a study on 24 patients with advanced solid tumors, temsirolimus was reported to induce two confirmed partial responses in patients with breast cancer and RCC. The patient with RCC had documented tumor progression of lung and pleural metastasis on interferon-α and interleukin 2 and received 15 mg/m2 of temsirolimus [60]. The partial response lasted 6.5 months and was observed after 8 weeks of therapy. Two additional patients with RCC experienced minor tumor regressions after treatment with 15 mg/m2 and 45 mg/m2 and had 34 % and 39 % tumor reductions, respectively, with the partial responses lasting for 3 and 4.9 months. In another dose-escalation study on 63 patients with advanced cancers, including 16 patients with RCC, 6 patients had suggestive evidence of clinical benefit, and 2 patients with RCC had unconfirmed partial responses. The first received 3.7 mg/m2/day of temsirolimus, and the second received 19 mg/m2/day temsirolimus for 5 cycles and then 15 mg/m2/day [59]. Three patients had dose-limiting toxicities (stomatitis, vomiting/diarrhea, asthenia, and elevated liver transaminases). Five patients required dose reduction.
Phase II Studies
In RCC, phase II studies have determined the efficacy of temsirolimus monotherapy and combination regimens. Atkins et al. first investigated single-agent temsirolimus on 111 patients with cytokine-resistant RCC [71]. The patients were randomly assigned to weekly treatment with temsirolimus at a dose of 25, 75, or 250 mg. An objective response rate of 7 % (one complete response and seven partial responses) was observed, and 26 % of the patients experienced minor responses. Fifty-one percent of patients overall experienced a partial or complete response or stable disease lasting more than 24 weeks. The median PFS was 5.8 months and the median OS was 15 months. The most common grade 3 or 4 side effects were hyperglycemia (17 %), hypophosphatemia (13 %), anemia (9 %), and hypertriglyceridemia (6 %). Other grade 1 or 2 side effects included maculopapular rash, mucositis, asthenia, and nausea and occurred in more than two thirds of the patients. When these patients were stratified along good-, intermediate-, or poor-risk groups according to the MKCC criteria, OS were 23.8, 22.5, and 8.2 months, respectively. The OS in the poor-risk group was longer than the traditional reported OS of 4.9 months in patients having received IFN [72] and justified further studying in this patient subset.
Another multicenter dose-escalation phase I/II study examined the effect of temsirolimus/IFN combination [73]. An ascending dose (5, 10, 15, 20, or 25 mg) of temsirolimus was administered weekly in combination with IFN (six or nine million units) administered three times per week. Based on dose-limiting toxicities, a dose of 15 mg/6MU was recommended. Among the 39 patients who received the recommended dose, 3 patients achieved partial response and 14 had stable disease for at least 24 weeks, with a median PFS for all patients in the study of 9.1 months. The most common reported grade 3 or 4 side effects included leukopenia, hypophosphatemia, asthenia, anemia, and hypertriglyceridemia.
Phase III Trials
In 2007, the results of the multicenter Global Advanced Renal Cell Carcinoma (Global ARCC) [73] were published. That trial compared temsirolimus to either single-agent IFN or to the temsirolimus/IFN doublet as first-line therapy in patients with “poor-risk” disease. Eligible patients had to have three or more of the following six “poor-risk” features: a serum lactate dehydrogenase level of more than 1.5 times the upper limit of the normal range, a hemoglobin level below the lower limit of the normal range, a corrected serum calcium level of more than 10 mg per deciliter (2.5 mmol per liter), a time from initial diagnosis of renal cell carcinoma to randomization of less than 1 year, a Karnofsky performance score of 60 or 70, or metastases in multiple organs [74, 75]. Eligibility criteria differed from other phase III trials of other targeted therapies by including all histologic subtypes of RCC. The trial also allowed for enrollment of patients with CNS metastases, and patients were not required to have undergone a nephrectomy prior to enrollment. Six hundred twenty-six patients were recruited and randomized to three treatment arms: (1) weekly 25 mg dose of IV temsirolimus weekly (n = 209), (2) 3 MU interferon alpha (with an escalation to 18 MU or maximum tolerated dose) subcutaneously three times weekly (n = 207), and (3) a combination of temsirolimus (15 mg weekly) plus IFN (3 MU with an escalation to 6 MU three times weekly) (n = 210). Twenty percent of the patients had non-clear cell histology, and 67 % had undergone previous nephrectomy.
The primary end point was overall survival (OS), and the secondary efficacy end points were PFS, the ORR, and the disease control rate for at least 24 weeks. No statistical difference was observed when the combination group and the IFN group were compared with OS of 8.4 and 7.3 months, respectively (HR 0.96, p = 0.70). However, a prolonged OS of 10.9 months was observed in the temsirolimus monotherapy arm versus 7.3 months in the IFN arm (HR 0.73, p = 0.008). The objective response rates were not statistically different between the three groups, but more patients in the temsirolimus monotherapy (32.1 %) experienced a clinical benefit compared to the combination group (28.1 %) and IFN monotherapy (15.5 %). An improvement in PFS was also observed (p < 0.001) in the temsirolimus arm compared to the IFN alone arm, and the reported PFS were 3.8, 1.9, and 3.7 months in the temsirolimus, IFN, and combination arms, respectively. Improvements in OS and PFS were independent of the histological type or the nephrectomy status, although a post hoc analysis suggested that patients with non-clear cell histology (presumably papillary RCC) enjoyed the best reduction in the hazard ratio for death [76, 77].
Patients receiving temsirolimus experienced a higher incidence of hyperglycemia, hyperlipidemia, and hypercholesterolemia compared to patients receiving IFN. They also experienced more rash, stomatitis, and peripheral edema but had a lower incidence of grade 3 and 4 side effects.
The INTORSECT trial compared temsirolimus to sorafenib as second-line therapy. The primary end point of progression-free survival was not significantly different between the two arms, 4.3 months for temsirolimus compared to 3.9 months for sorafenib (two-sided p = 0.19) [78]. However, overall survival favored sorafenib (HR 1.31 with 95 % CI 1.05–1.63, two-sided p = 0.01). As such, the highest level of evidence remains for the use of temsirolimus as first-line therapy for poor-risk RCC patients.
Combination Studies
Several phase I studies have evaluated the role of temsirolimus in combination with VEGF-targeted therapy. In the first cohort of a study combining IV temsirolimus 15 mg weekly with oral sunitinib 25 mg daily (4 weeks on, 2 weeks off), there were two DLTs (rash, thrombocytopenia, cellulitis, and gout) in the first cohort of three patients, and the study was deemed not feasible [79]. The same combination of starting doses of sunitinib plus temsirolimus in RCC patients specifically also found grade 3 rash and thrombocytopenia in the first patients and closed early for toxicity [80]. A similar phase I study of temsirolimus plus pazopanib yielded similar conclusions: grade 3 fatigue and electrolyte disturbances, which precluded further dose escalation beyond the first dose level [81]. Combining temsirolimus with sorafenib was found to be tolerable; at a dose of sorafenib 400 mg BID and temsirolimus 15 mg IV weekly, only one of six patients had DLT of mucositis, and this dose has been recommended for phase II testing [82]. Temsirolimus has also been combined with tivozanib, a selective TKI of VEGF receptors 1, 2, and 3 in a population of patients who had mostly been treated with at least one prior targeted therapy for metastatic RCC [83]. The full doses of both agents were tolerated, and promising activity was seen, with a 23 % RECIST partial response rate. Lack of support for tivozanib development in RCC may limit further study of this combination.
Another combination, bevacizumab/temsirolimus, appears to have a better toxicity profile. In two separate abstracts presented at ASCO in 2007 [84] and 2009 [85], Merchan et al. evaluated the safety and efficacy of this combination. In the phase I part involving 12 evaluable patients with stage IV clear cell RCC and who had progressed on up to two previous regimens, 7 patients experienced a PR and 2 patients suffered DLTs (mucositis and hypertriglyceridemia). Following this phase I, a regimen of 10 mg/kg of bevacizumab IV every 2 weeks with temsirolimus 25 mg IV weekly was established. In the phase II component [85], 35 patients were evaluated. Four patients had PRs and 18 patients had SD, suggesting that 88 % of the patients had experienced clinical benefits. This dosing schedule was moved forward into a phase II trial comparing first-line bevacizumab + temsirolimus (A) against standard sunitinib (B) or bevacizumab + interferon (C) [86] in a 2:1:1 randomization of 171 patients with untreated metastatic RCC. The study was negative, with median progression-free survival of 16.8 months group C, compared to 8.2 months in groups A and B. Toxicity was an issue compromising continued therapy in the combination arm. Temsirolimus plus bevacizumab was also compared to bevacizumab plus interferon as first-line therapy for metastatic RCC in the phase III trial INTORACT. The primary end point of progression-free survival was not met, with median PFS 9.1 months for temsirolimus plus bevacizumab compared to 9.3 months for bevacizumab plus interferon [87]. Finally, the phase II cooperative group trial BeST compared four different treatment regimens in the first-line setting: Bev alone, Bev + Tem, Bev + Sor, and Sor + Tem [88]. The median PFS was 8.7 months for Bev, 7.3 months for Bev + Tem, 11.3 months for Bev + Sor, and 7.7 months for Sor + Tem. The conclusion was that future studies should consider inclusion of selective VEGF inhibitors in combination, and for now single-agent therapy remains standard.
Other combinations of interest combine temsirolimus with agents targeting downstream pathways. A study of nelfinavir plus temsirolimus was performed with the intent of targeting PI3K to overcome resistance to mTOR inhibition. This combination was tolerable but efficacy results are not available [89]. Targeting protein kinase C, a member of a downstream pathway, with bryostatin in combination with temsirolimus resulted in multiple significant PRs in RCC patients [90]. Further study of temsirolimus with such agents may be warranted.
18.5.1.2 Everolimus
Everolimus (RAD-001) was initially developed as an oral immunosuppressive agent as a prophylaxis of rejection in patients who have undergone cardiac, liver, and renal transplants [91, 92]. The dose is 1.5 mg twice daily up to a dose of 6 mg/daily [93, 94]. Everolimus binds to a cytoplasmic protein, of FK-506 binding protein-12, to form a complex that interacts with mTOR. This interaction prevents the phosphorylation of the downstream proteins S6K1 and 4E-BP1 and hence prevents their activation and therefore affects tumor cell metabolism and growth.
In Vitro and Animal Studies
In addition to its immunosuppressant effects, everolimus displays antiproliferative properties against endothelial cells following injury and against tumor cells. In a rat model of renal microvascular injury, everolimus inhibited glomerular endothelial cell proliferation by up to 60 %, an effect that was associated with a reduced phosphorylation of the p70S6 kinase and reduced VEGF levels in the glomeruli. It also inhibits the growth of human-derived cell lines in culture and in xenograft models [95]. In a syngeneic rat pancreatic tumor model, everolimus showed dose-dependent antitumor activity with both daily and weekly administration schedules and statistically significant decrease in the tumor size among the treated subjects of 70–95 % depending on the dose. In this preclinical study, everolimus was well tolerated and had an antitumor potency to that of the cytotoxic agent 5-fluorouracil. Because everolimus also has immunosuppressive effects, it was important to find an adequate therapeutic window. For that purpose, Boulay et al. biochemically profited the mTOR signaling pathway in tumors, skin, and peripheral blood mononuclear cells (PBMCs) and found a decrease in the phosphorylation of 4E-BP1 and inactivation of S6K1 after a single administration of everolimus [95]. This finding suggested that S6K1 from the PBMC could possibly be used as a marker for mTOR inhibition and as a means to assess everolimus treatment schedules in cancer patients.
Phase I Studies
Dosing Schedule
Based on these preliminary findings, a phase I study was conducted by Tanaka et al. [96] to predict optimal clinical regimens of everolimus. S6K1 from PBMC was used as a marker of mTOR inhibition. A pharmacokinetics/pharmacodynamics model was used to plot the association between everolimus concentrations and level of S6K1 inhibition in PBMCs in both human subjects and rats. A time- and dose-dependent S6K1 inhibition with everolimus was shown. In the rat model, a relationship was shown between S6K1 inhibition and antitumor effect. This model allowed the prediction of PBMC S6K1 inhibition-time profiles in patients receiving everolimus, and a daily administration was found to yield a greater effect than weekly administration at higher doses.
Pharmacokinetics
Absorption
Everolimus is administered orally, has a low bioavailability in rats of 10 % [97], but has a fast absorption. The peak everolimus concentration (44.2 ± 13.3 μg/l) is reached within 30 min–1 h after administration with an area under the curve of 219.69 ± μg × h/l [98] and with an approximate half-life of 30 h [99]. The steady state is reached within 7 days. High-fat meals decrease the absorption of everolimus in half [100], and hence the drug should be taken consistently either with food or without. The absorption is possibly also affected by the activity of P-glycoprotein, which reduces the oral bioavailability of drugs that are CYP3A substrates [101]. The protein binding of everolimus is not influenced by moderate hepatic impairment [102].
Metabolism
Unlike temsirolimus, everolimus is not degraded to sirolimus but is metabolized essentially in the gut and liver by cytochrome P450 3A4, 3A5, and 2C8 and PgP enzymes into hydroxylated and demethylated metabolites [70, 103]. Hydroxy-everolimus is the most important metabolite, accounting for half of the dose-normalized AUC of the first 24 h (AUC24) of everolimus AUC24. The different metabolites appear within 1.2–2.0 h after administration versus 1.5 h for everolimus [104, 105]. To identify the optimal regimen and dosage of everolimus, O’Donnell et al. (Table 18.1) performed a dose-escalation study on 92 patients with advanced cancer with an everolimus dose range of 5–30 mg/week initially based on transplantation data. However, in view of the preclinical data favoring daily dosing, two regimens of 50 and 70 mg weekly and daily doses of 5 and 10 mg were investigated. S6 kinase 1 activity in PBMC was inhibited for at least 7 days at doses ≥20 mg/week. Evaluation of the stable predose serum trough concentration levels from 26 of the 31 patients treated with the weekly regimen indicated minimal accumulation at all weekly dose levels, with steady state achieved by the second week of treatment. The area under the curve increased proportionally with the dose, but the maximal serum concentration increased less than proportionally at doses ≥20 mg/week. Evaluation of profiles from ten patients on the daily regimen patients showed that a steady-state level was reached within a week. Both maximal serum concentration and AUC increased in a dose proportional manner.
Table 18.1
Dose-escalation studies of temsirolimus and everolimus in patients with advanced RCC
Reference | Year | n | Dose | DLT (n) | Results |
|---|---|---|---|---|---|
Temsirolimus | |||||
Hidalgo [59] | 2006 | 63 | 0.75–24 mg/m2 IV daily × 5 days every 2 weeks | At 19 mg/m2 DLT in 2 patients (vomiting, diarrhea, ALT) | 19 mg/m2 daily × 5 days every 2 weeks is MTD |
Raymond [60] | 2004 | 24 | Starting dose 7.5 mg/m2 IV weekly, escalated up to 220 mg/m2 IV weekly | At 45 mg/m2 DLT in 1 patient (grade 3 pancytopenia) | PK analysis suggested flat dosing could be done |
At 220 mg/m2 DLT in 2 patients (grade 3 stomatitis, ALT elevation) | Two patients with RCC had PR; one at 15 mg/m2 and one at 45 mg/m2 | ||||
Everolimus | |||||
O’Donnell [99] | 2008 | 92 with advanced cancer (10 RCC) | Group 1: weekly dose 5 vs. 10 vs. 30 mg (n = 18) | No toxicity | S6K1 activity was inhibited for >7 days at doses higher than 20 mg/week |
Group 2: weekly dose 50 vs. 70 mg (n = 37) | Stomatitis and fatigue (1) (50 mg) | Everolimus was tolerated at dosages up to 70 mg/week and 10 mg/day | |||
Group 3: daily dose 5 vs. 10 mg (n = 37) | Hyperglycemia (1) (10 mg) | Five of 10 patients with RCC had PFS ≥6 months | |||
Tabernero [106] | 2008 | 55 with advanced cancer (2 RCC) | Group 1: weekly dose 20 vs. 50 vs. 70 mg (n = 31) | 70 mg: stomatitis (2) neutropenia (1), hyperglycemia (1) | Complete inhibition of S6K1 and p-eIF-4G at 10 mg/day and ≥50 mg/week |
Group 2: daily dose 5 vs. 10 mg (n = 24) | Stomatitis (1) (10 mg) | One of two patients with RCC had stable disease for 14.6+ months at 50 mg weekly | |||
Excretion
No definite excretion study has been undertaken, but in patients receiving concurrent cyclosporine radiolabeled everolimus, 80 % of the radioactivity was recovered from the feces, and 5 % was excreted in the urine, after the administration of a 3 mg single dose of everolimus (Everolimus-Summary of Product Characteristics. Novartis Pharma AG, Basel, Switzerland).
Tumor Response and Toxicity
Fifty-five patients were studied by Tabernero in a dose-escalation phase I setting at doses of 20, 50, and 70 mg weekly or 5 and 10 mg daily [106]. A dose- and schedule-dependent inhibition of the mTOR pathway was observed with complete inhibition of pS6K1 and p-eIF-4G at a daily dose of 10 mg or weekly dose of 50 mg or greater. Only two patients had RCC. Clinical benefit was noted in four patients including one patient with RCC who experienced stable disease of 14.6 months on 50 mg/week dose. One patient developed grade 3 stomatitis on the daily dose of 10 mg. On the weekly dose at 70 mg, two patients had grade 3 stomatitis, one had grade 3 neutropenia, and the last developed grade 3 hyperglycemia.
Among the 92 patients evaluated in the phase I trial by O’Donnell, 4 patients experienced partial responses, and 12 patients had a PFS of 6 months or more, including 5 of the 10 patients with RCC. In the two previously described phase I studies, dose-limiting toxicity was seen in one out of six patients [99] receiving everolimus at a weekly dose of 50 mg (stomatitis and fatigue) and four patients receiving 70 mg weekly. Among the patients treated with a daily regimen, one of six patients receiving 10 mg developed hyperglycemia, and another patient also receiving 10 mg developed stomatitis [106].
Phase II Trials
Amato et al. conducted a 2-stage, single-arm, phase 2 trial to determine the PFS of patients with metastatic clear cell RCC receiving everolimus at a daily dose of 10 mg [107]. Forty-one patients were recruited, and 37 patients were evaluable for response. Eligibility criteria included ECOG PS ≤2, satisfactory hematologic, hepatic, renal, and cardiac function. Patients with brain metastases were excluded. The majority of the patients (83 %) had received prior systemic treatment, mostly cytokine therapy with IL-2 and/or IFN-α (61 %). 59 %, 37 %, and 5 % had intermediate, good, and poor risk per MSKCC criteria, respectively.
The results showed a median PFS of 11.2 months and a median OS of 22.1 months. Five patients (14 %) experienced a partial response, and 27 had a stable disease duration longer than 3 months, with 21 (57 %) having a stable disease lasting more than 6 months. More than 70 % of the patients therefore had partial response or SD > months. The most common grade 1/2 side effects were nausea (38 %), anorexia (38 %), diarrhea (31 %), stomatitis (31 %), pneumonitis (31 %), and rash (26 %). The grade 3/4 side effects included pneumonitis (18 %); transaminase level elevations (10 %); thrombocytopenia, hyperglycemia, and alkaline phosphatase elevations (8 %); and hyperlipidemia (5 %).
Related posts:

Stay updated, free articles. Join our Telegram channel

Full access? Get Clinical Tree


