The Molecular Mechanism of Insulin Action and the Regulation of Glucose and Lipid Metabolism
C. Ronald Kahn
Alan R. Saltiel
More than 18 million people in the United States have diabetes mellitus, and about 90% of these have the type 2 form of the disease. In addition, between 17 and 40 million people have insulin resistance, impaired glucose tolerance, or the cluster of abnormalities referred to variably as the metabolic syndrome, the dysmetabolic syndrome, syndrome X, or the insulin resistance syndrome (1). In all of these disorders, a central component of the pathophysiology is insulin resistance, i.e., reduced responsiveness to insulin in tissues such as muscle, fat, and liver. In type 2 diabetes, the β-cell can no longer secrete sufficient insulin to compensate for insulin resistance, leading to relative insulin deficiency. Insulin resistance is also closely linked to other common health problems, including obesity, polycystic ovarian disease, hyperlipidemia, hypertension, and atherosclerosis. In this chapter, we will attempt to dissect the complexity of the molecular mechanisms of insulin action with a special emphasis on those features of the system that are subject to alteration in type 2 diabetes and other insulin-resistant states.
GLUCOSE HOMEOSTASIS AND INSULIN RESISTANCE
Despite periods of feeding and fasting, in healthy individuals plasma glucose remains in a narrow range between 4 and 7 mM (70 to 120 mg/dL). This tight control of glucose concentration is determined by a balance between glucose absorption from the intestine, glucose production by the liver, and glucose uptake from the plasma (reviewed in detail in Chapter 8, 13, 14, 15, 16, 24) (Fig. 9.1). In tissues such as muscle, fat, and liver, glucose uptake and/or storage is regulated by insulin, whereas insulin has no apparent role in stimulating glucose metabolism in tissues such as brain, kidney, and erythrocytes. In addition to promoting glucose utilization, insulin inhibits both basal and glucagon-stimulated hepatic glucose production, thus serving as the primary regulator of blood glucose concentration during fasting. Insulin also has a general anabolic role promoting the storage of substrates in fat, liver, and muscle by stimulating lipogenesis and glycogen and protein synthesis; inhibiting lipolysis, glycogenolysis and protein breakdown; and stimulating cell growth and differentiation. In type 1 diabetes, the autoimmune destruction of the pancreatic β-cell leads to severe insulin deficiency with unrestrained hepatic glucose output, unrestrained lipolysis, and increased ketogenesis. In type 2 diabetes, insulin resistance in muscle, adipose tissue, and liver combined with a relative failure of the β-cell leads to increased glucose levels and a variable cluster of metabolic alterations in lipid and protein metabolism. Insulin resistance in patients with type 2 diabetes is usually defined by defects in insulin-stimulated glucose transport, glycogen synthesis, and glucose oxidation, but other pathways of metabolism are clearly altered. The most characteristic feature of the β-cell failure is a specific defect in glucose sensing characterized by loss of first-phase insulin secretion in response to a glucose stimulus, while response to other secretagogues is normal or only mildly depressed.
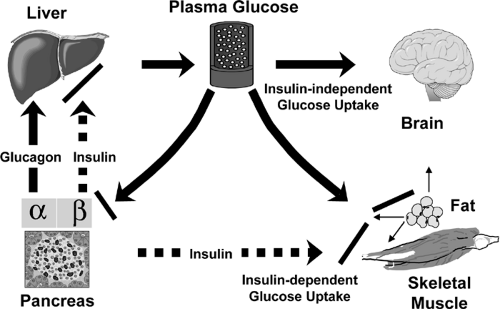 Figure 9.1. Overview of glucose homeostasis and its alterations in type 2 diabetes. In the fasting state, glucose is produced by the liver and utilized by insulin-independent tissues, such as the brain, and insulin-dependent tissues, such as fat and muscle. The balance of glucose production and utilization is controlled by many hormones, but the most important is insulin. In type 2 diabetes, there is insulin resistance in muscle, fat, and liver and relative insulin deficiency. |
The control of blood glucose depends upon the balance between glucose production by the liver and glucose utilization by insulin-dependent tissues, such as muscle and fat, and insulin-independent tissues, such as the brain. In mammals, up to 75% of insulin-dependent glucose disposal occurs in skeletal muscle (2,3,4,5,6). This preeminence of muscle, however, has recently been challenged by the finding that mice with a muscle-specific knockout of the insulin receptor exhibit minimal abnormalities in glucose tolerance (7). Adipose tissue accounts for only a small fraction (5% to 15%) of insulin-stimulated glucose disposal. Despite this, knockout of the insulin-sensitive glucose transporter in fat leads to impaired glucose tolerance, apparently by inducing insulin resistance in muscle and liver through a yet undetermined mechanism (see the section Lessons from Knockout Mice about Insulin Action and Insulin Resistance below). Adipose tissue also plays a special additional role in glucose homeostasis through its release of free fatty acids, tumor necrosis factor-α (TNF-α) leptin, Acrp30/adiponectin, and other adipokines that have been shown to contribute to insulin action and insulin resistance (8,9,10,11,12). Furthermore, both obesity (increased fat mass) and lipoatrophy (decreased fat mass) cause insulin resistance and predisposition to type 2 diabetes (13,14,15,16).
The liver does not exhibit insulin-stimulated glucose uptake but plays a major role in glucose homeostasis, especially in the fasting state (17). When insulin levels are low, the liver releases glucose into the blood as a result of glycogenolysis
and gluconeogenesis, providing substrate for tissues with obligate glucose requirements. In the fed state, when insulin levels are high, glucose in the liver is converted to glycogen. Recent studies using knockout and other technologies suggest that insulin action in other tissues, including brain and β-cells, although not major sites of insulin-stimulated glucose uptake, may also play important roles in glucose homeostasis and metabolism (18,19) (see below).
and gluconeogenesis, providing substrate for tissues with obligate glucose requirements. In the fed state, when insulin levels are high, glucose in the liver is converted to glycogen. Recent studies using knockout and other technologies suggest that insulin action in other tissues, including brain and β-cells, although not major sites of insulin-stimulated glucose uptake, may also play important roles in glucose homeostasis and metabolism (18,19) (see below).
PROXIMAL SIGNALING PATHWAYS
The Insulin Receptor and Its Substrates
The insulin receptor is a tetrameric protein consisting of two α-subunits and two β-subunits that belongs to a subfamily of receptor tyrosine kinases that also includes the insulin-like growth factor-1 (IGF-1) receptor and an orphan receptor called the insulin receptor-related receptor (IRR) (20,21) (Fig. 9.2). Each of these receptors is the product of a separate gene in which the two subunits are derived from a single-chain precursor or proreceptor that is processed by a furin-like enzyme to give a single α-β subunit complex (22,23). Two of the α-β dimers then undergo disulfide linkage to form the tetramer.
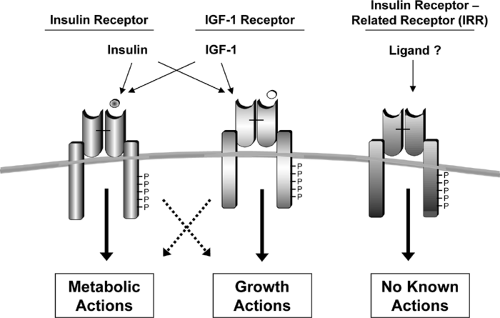 Figure 9.2. The insulin-receptor family, which includes the insulin receptor, the insulin-like growth factor-1 (IGF-1) receptor, and the insulin receptor-related receptor. |
The insulin receptor is widely distributed throughout the body, including in tissues classically regarded as “responsive” and “nonresponsive” to insulin. Recent studies suggest that the receptor in most of these tissues has an important functional role, but in some cases this may relate to actions other than the control of glucose or lipid homeostasis. For example, in ovarian granulosa cells, insulin signaling is coupled to regulation of estrogen/androgen balance (24), whereas the role of the insulin receptor in the endothelial cell may be to promote vasodilatation (25,26) or transcytosis of the insulin molecule from the intravascular space to the interstitial space and its target tissues (27,28,29,30); in neural or endocrine cells, insulin may have a role regulating hormone production, secretory function, or signal sensing (see below).
Functionally, the insulin receptor behaves as a classical allosteric enzyme in which the α-subunit inhibits the tyrosine kinase activity intrinsic to the β-subunit. Insulin binding to the α-subunit, or removal of the α-subunit by proteolysis or genetic deletion, leads to a derepression, i.e., activation, of the kinase activity in the β-subunit. Following this initial activation, there is transphosphorylation of the β-subunits, i.e., one subunit phosphorylates the other, leading to a conformational change and a further increase in activity of the kinase domain (31,32). The α-β heterodimers of the insulin, IGF-1, and the IRR receptors can form functional hybrids in which occupancy of one receptor’s binding domain leads to activation of the other receptor in the heterodimer by this transphosphorylation process. Likewise, a dominant-negative form of one of these receptor subtypes can inhibit the activity of the other receptors by forming heterodimers (33). This may explain in part why individuals with mutations in the insulin receptor exhibit both insulin resistance and growth retardation (33).
The insulin/IGF-1 signaling system is evolutionarily very ancient. Homologues of the insulin/IGF-1 receptor have been identified in Drosophila, Caenorhabditis elegans, and even metazoan marine sponges of the phylum Porifera that date back over 500 million years (34). In the lower organisms, this system uses many of the same downstream signals used in mammalian cells, i.e., phosphatidylinositol 3-kinase (PI 3-kinase)/ Akt/forkhead transcription factors, and may also be involved
in regulation of metabolism (35,36). In Drosophila, the insulin-secreting cells are neurons. Ablation of these cells results in changes in the major circulating carbohydrate in flies, trehelose (37). In C. elegans, a major effect of the insulin/IGF system is on aging, such that animals with mutations of the receptor that reduce insulin action live much longer than normal animals, whereas mutations in other parts of the pathway may reverse this longevity (38). It is interesting that chronic food restriction and leanness, which are associated with lower circulating insulin levels, increase longevity in rodents (39). This raises a number of interesting questions about the association of hyperinsulinemia and insulin resistance with conditions that shorten life span in humans, such as obesity, diabetes, and accelerated atherosclerosis.
in regulation of metabolism (35,36). In Drosophila, the insulin-secreting cells are neurons. Ablation of these cells results in changes in the major circulating carbohydrate in flies, trehelose (37). In C. elegans, a major effect of the insulin/IGF system is on aging, such that animals with mutations of the receptor that reduce insulin action live much longer than normal animals, whereas mutations in other parts of the pathway may reverse this longevity (38). It is interesting that chronic food restriction and leanness, which are associated with lower circulating insulin levels, increase longevity in rodents (39). This raises a number of interesting questions about the association of hyperinsulinemia and insulin resistance with conditions that shorten life span in humans, such as obesity, diabetes, and accelerated atherosclerosis.
At least nine intracellular substrates of the insulin and IGF-1 receptor tyrosine kinases have been identified (Figs. 9.3 and 9.4). Four of these belong to the family of insulin/IGF-1 receptor substrate (IRS) proteins (40,41,42,43,44). These IRS proteins are characterized by the presence of both pleckstrin homology (PH) and phosphotyrosine binding (PTB) domains near the N-terminus that account for the high affinity of these substrates for the insulin receptor and up to 20 potential tyrosine phosphorylation sites spread throughout the center and C-terminal region of the molecule. The molecular mass of IRS proteins ranges from 60 to 180 kDa. IRS-1 and IRS-2 are widely distributed, whereas IRS-3 and IRS-4 have more limited distributions. IRS-3 is most abundant in adipocytes, and its mRNA is also detected in liver, heart, lung, brain, and kidney (43,45,46,47). In contrast, the levels of mRNA for IRS-4 are very low, but are detectable, in fibro-blasts, embryonic tissues, skeletal muscle, liver, heart, hypothalamus, and kidney (44). Interestingly, in humans the IRS-3 gene appears to be nonfunctional, leaving only IRS-1, -2, and -4 (48). Other direct substrates of the insulin/IGF-1 receptor kinases include Gab-1 (49), p62dok (50), Cbl (51), and the various isoforms of Shc (52,53). Following insulin stimulation, the receptor directly phosphorylates most of these substrates on multiple tyrosine residues. The phosphorylated tyrosines in each of these substrates occur in specific sequence motifs and once phosphorylated serve as “docking sites” for intracellular molecules that contain SH2 (Src-homology 2) domains (44,54). Thus, the insulin-receptor substrates function as key intermediates in insulin-signal transduction.
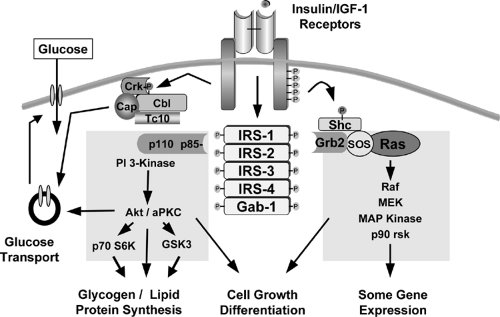 Figure 9.3. The insulin and insulin-like growth factor-1 (IGF-1) signaling network. The two major pathways are the phosphatidylinositol 3-kinase (PI 3-kinase) pathway and the Ras-mitogen-activated protein (MAP) kinase pathway. The PI-3 pathway is the major pathway leading to the metabolic actions of insulin. |
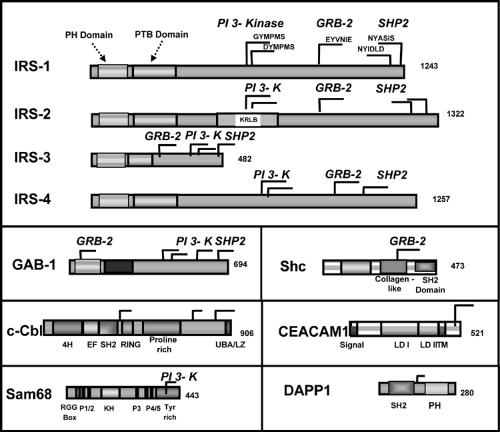 Figure 9.4. The family of insulin-receptor substrates (IRS). The functional domains and major tyrosine phosphorylation sites of each protein are indicated. PH, pleckstrin homology; PTB, phosphotyrosine; PI 3-kinase, phosphatidylinositol 3-kinase. |
The SH2 proteins that bind to phosphorylated IRS proteins fall into two major categories. The best studied are adapter molecules, such as the regulatory subunit of PI 3-kinase or the molecule Grb2, which associates with SOS to activate the Ras-mitogen-activated protein (MAP) kinase pathway (54,55,56,57). The other major category of proteins that bind to IRS proteins are enzymes, such as the phosphotyrosine phosphatase SHP2 (58,59) and cytoplasmic tyrosine kinases, such as Fyn. A few proteins that bind to phosphotyrosines in the IRS proteins do not contain known SH2 domains; these include the calcium adenosine triphosphatases (ATPases) SERCA 1 and 2 and the SV40 large T antigen (60,61). These pathways are discussed in more detail on page 153.
IRS proteins also undergo serine phosphorylation in response to insulin and other stimuli. In general, serine phosphorylation appears to act as a negative regulator of insulin signaling by decreasing tyrosine phosphorylation of IRS proteins, as well as by promoting interaction with 14-3-3 proteins (62). A number of different intracellular enzymes have been suggested as being involved in this serine phosphorylation, including
some in the insulin-signaling pathway, such as Akt (63), JNK kinase (64), and PI 3-kinase (which also has serine kinase activity) (65), thereby providing a form of autoinhibition of signaling, and others that mediate the effects of some inhibitors of insulin action, such as the inhibitor kappa B kinase β (IKKβ) (66,67).
some in the insulin-signaling pathway, such as Akt (63), JNK kinase (64), and PI 3-kinase (which also has serine kinase activity) (65), thereby providing a form of autoinhibition of signaling, and others that mediate the effects of some inhibitors of insulin action, such as the inhibitor kappa B kinase β (IKKβ) (66,67).
Although the IRS proteins are highly homologous and possess many similar tyrosine phosphorylation motifs, recent studies in knockout mice and knockout cell lines suggest that the various IRS proteins serve complementary rather than redundant roles in insulin and IGF-1 signaling (Fig. 9.5). The IRS-1 knockout mouse exhibits IGF-1 resistance as manifested by prenatal and postnatal growth retardation, as well as insulin resistance, primarily in muscle and fat, resulting in impaired glucose tolerance (68,69,70). IRS-2 knockout mice also exhibit insulin resistance, but primarily in the liver, and have defects in growth in only selected tissues of the body, including certain regions of the brain, β-cells, and retinal cells (71,72). Likewise at the cellular level, IRS-1 knockout preadipocytes exhibit defects in differentiation (73,74), whereas IRS-2 knockout preadipocytes differentiate normally but fail to respond to insulin-stimulated glucose transport (75).
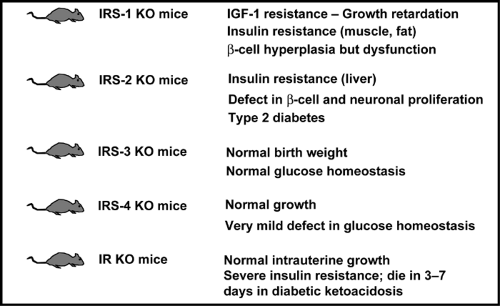 Figure 9.5. Phenotypes of the insulin receptor (IR) and insulin receptor substrate (IRS) knockout (KO) mice. IGF-1, insulin-like growth factor-1. |
The β-cell compensatory responses of the IRS knockout mice also differ. In the IRS-1 knockout, although there is some element of β-cell dysfunction, there is sufficient islet hyperplasia such that the animals develop only mildly impaired glucose tolerance. In the IRS-2 knockout mouse, there is a decrease in islet mass due to altered β-cell development. The combination of multifactorial insulin resistance and decreased β-cell mass leads to the development of early-onset diabetes in IRS-2-/- mice (71), although the frequency of this phenotype varies considerably in different laboratories (72). By contrast, IRS-3 knockout mice have normal growth and metabolism, whereas IRS-4 knockout mice exhibit only minimal abnormalities in glucose tolerance (76,77). It is interesting that when IRS-1-deficient mice are crossed with IRS-3-deficient mice to produce a double knockout, the resultant animals exhibit severe hyperglycemia and marked lipoatrophy, indicating that, at least in adipocytes, there is at least some compensation of these two substrates (78).
The differential roles of the IRS proteins may be due to differences in tissue distribution, subcellular localization, and intrinsic activity of the proteins. IRS-1 and IRS-2 are widely distributed, whereas IRS-3 is limited largely to the adipocyte and brain and IRS-4 is expressed primarily in embryonic tissues or
cell lines (see above). Furthermore, IRS-1 is more closely associated with low-density microsomes, whereas IRS-2 is found in low-density microsomes and in the cytosol (79). IRS-3 is associated more with the plasma-membrane fraction in rat adipocytes (80). In some studies, IRS-1 and IRS-3 appear to translocate to the nucleus (81,82), and IRS-3 has been suggested to possess DNA-binding activity (82).
cell lines (see above). Furthermore, IRS-1 is more closely associated with low-density microsomes, whereas IRS-2 is found in low-density microsomes and in the cytosol (79). IRS-3 is associated more with the plasma-membrane fraction in rat adipocytes (80). In some studies, IRS-1 and IRS-3 appear to translocate to the nucleus (81,82), and IRS-3 has been suggested to possess DNA-binding activity (82).
Turning off the Insulin Signal
Unlike the prolonged actions of steroid and thyroid hormones, insulin action on glucose homeostasis demands a rapid on-and-off response to avoid the dangers of hypoglycemia. Several different mechanisms play a role in turning off the insulin signal (Fig. 9.6). First, insulin may simply dissociate from the receptor and be degraded. Following dissociation of the ligand, phosphorylation of the insulin receptor and its substrates is rapidly reversed by the action of protein tyrosine phosphatases (PTPases). Several PTPases have been identified that are capable of catalyzing dephosphorylation of the insulin receptor in vitro or in vivo, and some are even upregulated in insulin-resistant states (83,84,85,86). Most attention has focused on the cytoplasmic phosphatase PTP-1b. Disruption of the gene encoding this enzyme in mice produces increased insulin-dependent tyrosine phosphorylation of the insulin receptor and IRS proteins in muscle and leads to a state of improved insulin sensitivity (87). PTP-1b knockout mice are also resistant to diet-induced obesity, suggesting an effect of PTP-1b deletion in the brain, with subsequent changes in energy uptake and expenditure. This is opposite the effect of knockout of insulin receptor in the brain (18) (see page 163).
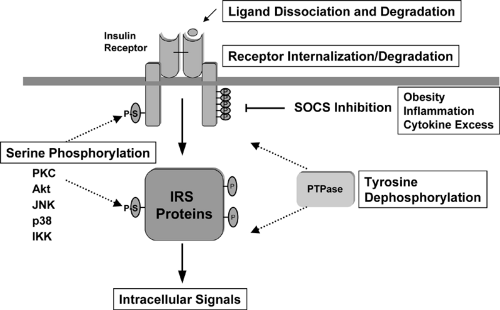 Figure 9.6. Mechanism of turning off the insulin signal. These mechanisms are also activated in a variety of acquired insulin-resistant states. SOCS, suppressors of cytokine signaling; IRS, insulin-receptor substrate; PTPase, protein tyrosine phosphatases. |
Several other mechanisms may also be involved in turning off the insulin signal in normal or pathologic states. The insulin receptor itself may be internalized and undergo degradation (88,89). As noted above, serine phosphorylation of the insulin receptor and its substrates also inhibits insulin action (90,91). Finally, the phosphorylated receptor may interact with proteins in the cell that block insulin action. This latter mechanism has recently been observed for the SOCS (suppressors of cytokine signaling) proteins in the case of the insulin resistance associated with inflammation and obesity (92).
Phosphatidylinositol 3-Kinase and Downstream Targets
The first SH2 domain protein identified as interacting with IRS-1 was the regulatory subunit of the class Ia form of PI 3-kinase. This enzyme plays a pivotal role in the metabolic and mitogenic actions of insulin and IGF-1 (93,94). Thus, inhibitors of PI 3-kinase or transfection with dominant-negative constructs of the enzyme blocks virtually all of the metabolic actions of insulin, including stimulation of glucose transport, glycogen synthesis, and lipid synthesis. The enzyme itself consists of a regulatory and a catalytic subunit. Activation of the catalytic subunit depends on interaction of the two SH2 domains in the regulatory subunit with specific tyrosine-phosphorylated motifs in the IRS proteins of the sequence pYMXM and pYXXM (95,96).
At least eight isoforms of the regulatory subunits of PI 3-kinase have been identified (Fig. 9.7). These are derived from three genes and alternative splicing (97,98,99). p85α and p85β represent the “full-length” versions of the regulatory subunits and contain an SH3 domain, a bcr homology domain flanked by two proline-rich domains, two SH2 domains [referred to as the N-terminal (nSH2) and C-terminal (cSH2) domains)], and an inter-SH2 (iSH2) domain containing the p110 binding region (99). The shorter versions of regulatory subunits, AS53 (also known as p55α) (100,101) and p50α (97,101), are splicing variants
derived from the same gene encoding p85α (Pik3r1) (97). They share the common nSH2-iSH2-cSH2 with p85α but lack the N-terminal half containing the SH3 domain, N-terminal proline-rich domain, and bcr domain and in its place have unique N-terminal sequences consisting of 34 amino acids and 6 amino acids, respectively. Another small version of the regulatory subunit, p55PIK, is very similar in structure to p55α/AS53 but is encoded by a different gene (102). Of these isoforms, p85α is predominantly and ubiquitously expressed and is thought to be the major response pathway for most stimuli (94,99); however, the splice variants, p55α/AS53 and p50α, have high levels of potency for PI 3-kinase signaling (100,101,103) and appear to play specific roles in some selected tissues (97,100,101) or in particular states of insulin resistance (104,105). The exact role of the different regulatory subunits of PI 3-kinase in insulin action is unclear. Knockout mice with a disruption of all three isoforms of Pik3r1 gene die within a few weeks of birth, indicating the importance of p85α and its spliced variants in normal growth and normal metabolism (106). By contrast, mice lacking only the full-length version of p85α (107) or only the shorter spliced forms (107a) can grow to adulthood and exhibit improved insulin sensitivity. One explanation for the increased sensitivity in both cases is the improved stoichiometry of insulin-signaling proteins in the cell (108). Thus, it appears that under normal conditions the concentration of regulatory subunits is in excess of that of the catalytic subunits and phosphorylated IRS proteins. This leads to the binding of free monomeric (and thus catalytically inactive) forms of regulatory subunit to phosphorylated IRS proteins and blocking of the binding of the active heterodimer. Mice with a heterozygous knockout Pik3r1 gene also have improved stoichiometry of interaction between the regulatory and catalytic subunits. This results in improved sensitivity to insulin and IGF-1 and even protects mice with genetic insulin resistance from developing diabetes (109). Likewise, cell lines derived from heterozygous Pik3r1 -gene knockout embryos exhibit increased insulin/IGF-1 signaling (108).
derived from the same gene encoding p85α (Pik3r1) (97). They share the common nSH2-iSH2-cSH2 with p85α but lack the N-terminal half containing the SH3 domain, N-terminal proline-rich domain, and bcr domain and in its place have unique N-terminal sequences consisting of 34 amino acids and 6 amino acids, respectively. Another small version of the regulatory subunit, p55PIK, is very similar in structure to p55α/AS53 but is encoded by a different gene (102). Of these isoforms, p85α is predominantly and ubiquitously expressed and is thought to be the major response pathway for most stimuli (94,99); however, the splice variants, p55α/AS53 and p50α, have high levels of potency for PI 3-kinase signaling (100,101,103) and appear to play specific roles in some selected tissues (97,100,101) or in particular states of insulin resistance (104,105). The exact role of the different regulatory subunits of PI 3-kinase in insulin action is unclear. Knockout mice with a disruption of all three isoforms of Pik3r1 gene die within a few weeks of birth, indicating the importance of p85α and its spliced variants in normal growth and normal metabolism (106). By contrast, mice lacking only the full-length version of p85α (107) or only the shorter spliced forms (107a) can grow to adulthood and exhibit improved insulin sensitivity. One explanation for the increased sensitivity in both cases is the improved stoichiometry of insulin-signaling proteins in the cell (108). Thus, it appears that under normal conditions the concentration of regulatory subunits is in excess of that of the catalytic subunits and phosphorylated IRS proteins. This leads to the binding of free monomeric (and thus catalytically inactive) forms of regulatory subunit to phosphorylated IRS proteins and blocking of the binding of the active heterodimer. Mice with a heterozygous knockout Pik3r1 gene also have improved stoichiometry of interaction between the regulatory and catalytic subunits. This results in improved sensitivity to insulin and IGF-1 and even protects mice with genetic insulin resistance from developing diabetes (109). Likewise, cell lines derived from heterozygous Pik3r1 -gene knockout embryos exhibit increased insulin/IGF-1 signaling (108).
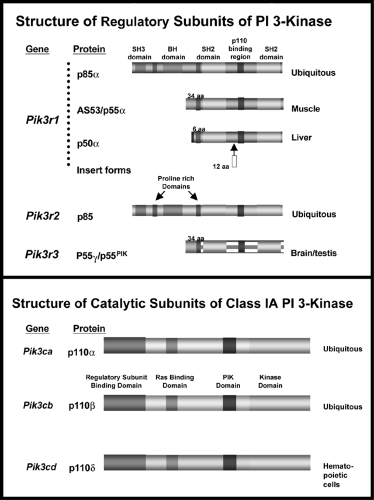 Figure 9.7. The structures of the regulatory and catalytic subunits of phosphatidylinositol 3-kinase (PI 3-kinase). |
The exact mechanisms by which PI 3-kinase transmits the insulin signal appear to be multiple (94,99). PI 3-kinase itself catalyzes the phosphorylation of phosphoinositides on the 3-position to PI-(3)P, PI-(3,4)P2, and PI-(3,4,5)P3(also known as PIP3). These lipids bind to the PH domains of a variety of signaling molecules and alter their activity or subcellular localization. Three major classes of signaling molecules are regulated by PI 3-phosphates: the AGC superfamily of serine/threonine protein kinases; guanine nucleotide exchange proteins of the Rho family of guanosine triphosphatase (GTPase); and the TEC family of tyrosine kinases, including BTK and ITK. PI 3-kinase also activates the mTOR/FRAP pathway and activates phospholipase D, leading to hydrolysis of phosphatidylcholine and increases in phosphatidic acid (PA) and diacylglycerol (DAG). Insulin also activates the enzyme glycerol-3-phosphate acyltransferase, which increases de novo synthesis of PA and DAG by PI 3-kinase-independent mechanisms.
The best characterized pathway involves the AGC kinase known as PDK1. This enzyme is one of the two serine kinases that phosphorylate and activate the serine/threonine kinase Akt (also known as PKB). Akt/PKB is thought to play an important role in the transmission of insulin’s metabolic pathways by phosphorylating glycogen synthase kinase-3 (110), and either directly or indirectly the forkhead (FOXO) transcription factors and the cyclic AMP regulatory element binding protein CREB (111,112,113,114). However, studies using inhibitors and activators of Akt have not uniformly inhibited or mim-icked insulin actions (113). Part of the variability may relate to
the fact that there are three isoforms of Akt/PKB (115). Although the major form, Akt1, is clearly important for cell survival and growth, recent data have suggested that Akt2 may be more important in mediating insulin action, at least in the liver (116). Other AGC kinases that are downstream of PI 3-kinase are the atypical forms of protein kinase C (PKC), including PKCζ and PKCλ. Both Akt and the atypical PKCs appear to be required for insulin-induced glucose transport (117). Stable expression of a constitutively active, membrane-bound form of Akt in 3T3L1 adipocytes results in increased glucose transport and persistent localization of GLUT4 to the plasma membrane (118). Conversely, expression of a dominant-interfering Akt mutant inhibits insulin-stimulated GLUT4 translocation. Likewise, overexpression of PKCζ or λ results in GLUT4 translocation (119,120), whereas expression of a dominant-interfering PKCλ blocks the action of insulin (121). PKCζ has been shown to phosphorylate IRS-1 and thus to serve as a potential negative feedback regulator of insulin/IGF signaling (122).
the fact that there are three isoforms of Akt/PKB (115). Although the major form, Akt1, is clearly important for cell survival and growth, recent data have suggested that Akt2 may be more important in mediating insulin action, at least in the liver (116). Other AGC kinases that are downstream of PI 3-kinase are the atypical forms of protein kinase C (PKC), including PKCζ and PKCλ. Both Akt and the atypical PKCs appear to be required for insulin-induced glucose transport (117). Stable expression of a constitutively active, membrane-bound form of Akt in 3T3L1 adipocytes results in increased glucose transport and persistent localization of GLUT4 to the plasma membrane (118). Conversely, expression of a dominant-interfering Akt mutant inhibits insulin-stimulated GLUT4 translocation. Likewise, overexpression of PKCζ or λ results in GLUT4 translocation (119,120), whereas expression of a dominant-interfering PKCλ blocks the action of insulin (121). PKCζ has been shown to phosphorylate IRS-1 and thus to serve as a potential negative feedback regulator of insulin/IGF signaling (122).
It is important to keep in mind that, although less well studied, PI 3-kinase also has protein kinase activity and that both the regulatory and catalytic subunits of PI 3-kinase possess domains capable of interacting with other signaling proteins. The p85 regulatory subunits possess an SH3 domain, a bcr homology region that interacts with CDC42 and Rac, and two proline-rich regions for which the interacting partners have not yet been defined (99,123). PI 3-kinase also may interact with the PI 5′-kinase PIK-fyve (124) and some G-protein-coupled proteins (125); thus, this enzyme may contribute to insulin signaling in multiple ways.
It should be clear from the above discussion that turning off insulin signaling also involves reducing the level of PIP3 in the cell. This is achieved through the activity of PIP3 phosphatases, such as PTEN (126) and SHIP2 (127). PTEN dephosphorylates
phosphoinositides on the 3′-position, thus lowering the level of the second messengers. SHIP2 is a 5′-phosphoinositide phosphatase. Disruption of the gene encoding this enzyme yields mice with increased insulin sensitivity (127).
phosphoinositides on the 3′-position, thus lowering the level of the second messengers. SHIP2 is a 5′-phosphoinositide phosphatase. Disruption of the gene encoding this enzyme yields mice with increased insulin sensitivity (127).
The c-Cbl-Associated Protein/Cbl Pathway and Lipid Rafts
Although PI 3-kinase activity is clearly necessary for insulin-stimulated glucose uptake, several lines of evidence suggest that additional signals may also be required. Indeed, other hormones or growth factors that activate PI 3-kinase, such as platelet-derived growth factor (PDGF) and interleukin-4, do not stimulate glucose transport (51). Likewise, addition of a PIP3 analogue alone in some studies has no effect on glucose transport (128). In addition, two naturally occurring insulin-receptor mutants that appear to be fully capable of activating PI 3-kinase are unable to mediate full insulin action (129).
Recent studies have suggested that the PI 3-kinase-independent pathway might involve the tyrosine phosphorylation of the Cbl protooncogene (51,130) (Fig. 9.3). This phosphorylation requires the presence of another protein that recruits Cbl to the insulin receptor, the adapter protein APS. In most insulin-responsive cells, Cbl is associated with the adapter protein CAP (c-Cbl-associating protein), which binds to proline-rich sequences in Cbl through its C-terminal SH3 domain (51). CAP expression correlates well with insulin responsiveness, and its expression is increased by treatment of cells with insulin-sensitizing thiazolidinediones (51). CAP belongs to a family of adapter proteins that contain a sorbin homology (SoHo) domain. This allows CAP to interact with one of the components of the lipid raft domain of the plasma membrane, a protein called flotillin. Expression of CAP mutants that cannot bind to Cbl or flotillin inhibit Cbl translocation and insulin-stimulated glucose uptake (51). The translocation of phosphorylated Cbl also recruits the adapter protein CrkII to the lipid raft, which in turn interacts with the guanyl nucleotide exchange protein C3G. C3G catalyzes the exchange of GTP for GDP on TC10, resulting in the activation of this G-protein. TC10 has been suggested to provide the second signal to GLUT4 translocation (131), although the nature of this signal is still unclear.
The Ras-Mitogen-Activated Protein Kinase Cascade and mTOR
The second major pathway activated by insulin is the Ras-MAP kinase cascade. Following the tyrosine phosphorylation of one of the IRS proteins or the alternative substrate Shc, there is binding of the adapter protein Grb2, which in turn recruits the guanyl nucleotide exchange protein SOS to the plasma membrane, thus activating Ras (56,132). Full activation of Ras by insulin requires stimulation of the tyrosine phosphatase SHP2, which also interacts with insulin-receptor substrates such as Gab-1 and IRS1/2 (133). Once activated, Ras operates as a molecular switch, converting upstream tyrosine phosphorylations into a second serine kinase cascade, via the stepwise activation of Raf, the MAP kinase-kinase MEK, and the MAP kinases themselves, ERK1 and ERK2 (134). The MAP kinases, such as ERK1 and 2, can phosphorylate substrates in the cytoplasm or translocate into the nucleus and catalyze the phosphorylation of transcription factors, such as p62TCF, initiating a transcriptional program that leads the cell to commit to a proliferative or differentiative cycle. Blockade of the Ras-MAP kinase pathway with dominant-negative mutants or pharmacologic inhibitors can prevent the stimulation of cell growth by insulin but has no effect on any of the anabolic or metabolic actions of the hormone (134).
Related posts:

Stay updated, free articles. Join our Telegram channel

Full access? Get Clinical Tree


