Regulation of Hepatic Glucose Metabolism
Daryl K. Granner
Donald K. Scott
INTRODUCTION
Background
Glucose provides a major energy supply for mammalian cells; however, some tissues are much more dependent than others on this source. For example, glucose is the primary energy source for the brain and renal medulla and is essentially the sole provider for red blood cells and the retina. The total daily consumption of glucose in a 70-kg person is about 160 g. The brain uses about 120 g of this. Therefore, tissues that make up about 5% of the body weight consume more than 75% of the glucose metabolized each day. Some 10 to 15 g of glucose is available in the extracellular fluid (ECF), and ∼300 g can be stored in the glycogen reservoirs. Thus, less than a 24-hour supply of glucose is directly available in circumstances when no exogenous supply is available. A constant supply of glucose must be available, as moderate hypoglycemia (<50 mg/dL) causes disabling symptoms and severe hypoglycemia (<20 mg/dL) can have devastating and irreversible effects on the central nervous system (CNS). By contrast, hyperglycemia must be avoided, as this causes its own set of deleterious consequences, albeit on a considerably longer time scale.
An intricate mechanism has evolved for maintaining ECF glucose within a relatively narrow range. In broad physiologic terms (Fig. 15.1), this involves the regulated production of glucose by the liver from glycogenolysis and gluconeogenesis and, to a lesser extent, from gluconeogenesis in the kidneys and small intestine. This is counterbalanced by the regulated peripheral clearance of glucose by tissues such as skeletal muscle, adipose tissue, and the splanchnic bed, including the liver. This chapter concerns the homeostatic role the liver plays in these processes by serving as a consumer, producer, and reservoir for glucose. Descriptions of the control processes involved in glucose homeostasis generally center on hormonal regulation (Fig. 15.1). A major thesis of this chapter is that glucose and/or glucose metabolism is a (the) central player in these events. This point will be made by first outlining the general steps in metabolic control, then by illustrating how these processes affect glucose metabolism, and vice versa.
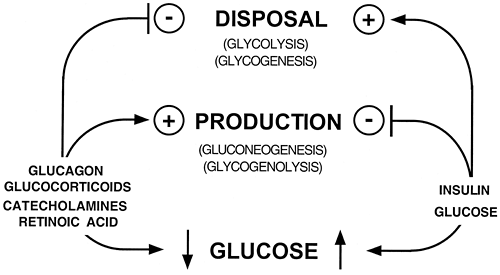 Figure 15.1. Overview of the hormonal regulation of glucose metabolism in the liver. |
Intracellular Symbols of Energy Charge, Glucose Homeostasis, and Carbon Balance
Multicellular organisms have elaborate mechanisms for sensing changes in the external environment and for generating signals that can then be transduced into an appropriate compensatory response (Table 15.1).
TABLE 15.1. Intracellular Symbols of Metabolic Balance | ||||||||||||||
|---|---|---|---|---|---|---|---|---|---|---|---|---|---|---|
| ||||||||||||||
Glucose homeostasis is a case in point. Acute hypoglycemia results in the immediate release of glucagon, which binds to the hepatocyte plasma membrane and thereby promotes the generation of cyclic adenosine monophosphate (cAMP). cAMP is therefore an intracellular symbol of hypoglycemia (1). Hyperglycemia, through insulin release and the subsequent activation of phosphodiesterases that hydrolyze cAMP, reduces the concentration of this nucleotide. A low-molecular-weight activator
of phosphofructokinase-1 (PFK1) was found in the livers of rats given a glucose load and was absent in the livers of rats treated with glucagon (2,3). This molecule, fructose-2,6-bisphosphate (F-2,6-P2), is thus a symbol of hyperglycemia. As discussed below, F-2,6-P2 activates glycolysis and inhibits gluconeogenesis, as would be expected of a symbol of hyperglycemia, for which the maintenance of homeostasis requires that glucose utilization be promoted and its production inhibited. Glucose metabolism is a major source of adenosine triphosphate (ATP), which is synthesized by successive phosphorylation steps from AMP. The intracellular levels of AMP and ATP, or the AMP/ATP ratio, are thus a reflection of energy sufficiency or depletion, as the case may be, within the cell. Citrate, an early intermediate in the citric acid cycle, is a symbol of the carbon supply necessary for a variety of biosynthetic pathways. Alanine, synthesized in a single step from pyruvate, serves a similar purpose. Although probably not a complete list, cAMP, F-2,6-P2, AMP/ATP, citrate, and alanine play key roles, by a variety of mechanisms that will be described below, in regulating hepatic glucose metabolism, which is a major source of energy and carbon for various biosynthetic reactions.
of phosphofructokinase-1 (PFK1) was found in the livers of rats given a glucose load and was absent in the livers of rats treated with glucagon (2,3). This molecule, fructose-2,6-bisphosphate (F-2,6-P2), is thus a symbol of hyperglycemia. As discussed below, F-2,6-P2 activates glycolysis and inhibits gluconeogenesis, as would be expected of a symbol of hyperglycemia, for which the maintenance of homeostasis requires that glucose utilization be promoted and its production inhibited. Glucose metabolism is a major source of adenosine triphosphate (ATP), which is synthesized by successive phosphorylation steps from AMP. The intracellular levels of AMP and ATP, or the AMP/ATP ratio, are thus a reflection of energy sufficiency or depletion, as the case may be, within the cell. Citrate, an early intermediate in the citric acid cycle, is a symbol of the carbon supply necessary for a variety of biosynthetic pathways. Alanine, synthesized in a single step from pyruvate, serves a similar purpose. Although probably not a complete list, cAMP, F-2,6-P2, AMP/ATP, citrate, and alanine play key roles, by a variety of mechanisms that will be described below, in regulating hepatic glucose metabolism, which is a major source of energy and carbon for various biosynthetic reactions.
Metabolic Pathways
The elucidation of metabolic pathways, along with the principles that govern the regulation of these pathways, is one of the major achievements of 20th century biological research. The deciphering of how thousands of reactions are coordinated, as well as the purification and characterization of the enzymes involved, was accomplished using techniques that often were very primitive by contemporary standards. This set the stage for more recent developments that allow for the analysis of components of these pathways by overexpression of an enzyme in a tissue of interest, or the selective removal of an enzyme, by transgenic and gene knockout technologies. These, and other newer techniques, are providing supportive evidence for the fundamental importance of certain enzymatic steps and have led to the discovery of regulatory processes heretofore unappreciated. The regulation of glucose metabolism in the liver, the topic of this chapter, has been of central interest to investigators for more than 100 years. As will be discussed below, many of the principles of metabolic regulation were derived from these studies.
CONTROL MECHANISMS
A living cell is an intricate machine, and it generally has several ways of regulating critical processes, with redundant systems for backup support. Most disturbances of a cell, even quite severe ones, are tolerated because, under normal circumstances, homeostatic mechanisms restore the affected process (or processes) to, or near, the original state.
Simple Control Mechanisms
The simplest type of control is afforded by substrate availability. Flux through an enzyme step is directly related to the concentration of substrate and to the affinity of the enzyme for that substrate. For example, hexokinases catalyze the phosphorylation of glucose to form glucose-6-phosphate (G-6-P). The Michaelis-Menten constant (Km) for the 100-kDa hexokinases (HK-I–III) is low (20–120 μM), so these enzymes are very efficient at low ECF glucose concentrations (4). Glucokinase, a 50-kDa hexokinase found in liver and pancreatic β-cells, has a Km for glucose of 5 to 10 mM, so it is very active when glucose concentrations in the ECF are high, particularly in the portal circulation, as happens after a meal (5). These high glucose concentrations are well above the Km of the 100-kDa hexokinases, which are relatively less influential under such circumstances. Glucokinase therefore plays an important role in hepatic glucose clearance during the postprandial period. Substrate availability provides a very rapid and simple control mechanism and is a major control mechanism in unicellular organisms. However, these organisms are relatively defenseless in the face of large changes of substrate availability, particularly when the substrate is not abundant.
Substrates and reaction products afford another type of direct regulation in which they affect their own concentration
by influencing the activity or amount of an enzyme by positive or negative mechanisms. Positive control occurs when a downstream component activates a subsequent enzyme and promotes forward flux, or induces the synthesis of an enzyme that accomplishes the same purpose. Fructose-1,6-bisphosphate (F-1,6-P2) activates a downstream enzyme, pyruvate kinase (PK), and thus promotes glycolytic flux (6); (Fig. 15.2). This provides a mechanism for ensuring that flux continues in the forward direction, but it generally does not afford fine-tuning of substrate concentration or flux because it is unidirectional. Negative feedback control, which is much more common than positive control, occurs when the product of a reaction is capable of feedback inhibition of upstream enzyme activity or synthesis. Negative feedback control can be exerted at many upstream reaction steps in a pathway and helps define the points at which metabolic-control strength is exerted. This mechanism, analogous to the function of a thermostat in temperature control, adjusts substrate concentration in a narrow range around a preset value. When the concentration of the reaction product falls, negative feedback inhibition is relieved and the reaction (or reactions) produces more of the regulatory molecule. High concentrations shut down the system, thus providing up-and-down fine-tuning. For example, physiologic levels of G-6-P, the product of the hexokinase reaction, provide feedback inhibition of the 100-kDa hexokinases but not of glucokinase (7). This provides for appropriately regulated levels of the branch-point substrate G-6-P in most tissues. Tissues or organs wherein glucokinase is the predominant hexokinase, such as liver and pancreatic β-cells, are able to continuously phosphorylate glucose owing to the lack of feedback inhibition by G-6-P, the reaction product. The liver is thus able to clear glucose in the postprandial state, and β-cells are able to employ glucokinase as a glucose sensor for regulated secretion of insulin (8). Substrate availability and feedback/ feedforward control are prominent mechanisms in single-cell organisms.
by influencing the activity or amount of an enzyme by positive or negative mechanisms. Positive control occurs when a downstream component activates a subsequent enzyme and promotes forward flux, or induces the synthesis of an enzyme that accomplishes the same purpose. Fructose-1,6-bisphosphate (F-1,6-P2) activates a downstream enzyme, pyruvate kinase (PK), and thus promotes glycolytic flux (6); (Fig. 15.2). This provides a mechanism for ensuring that flux continues in the forward direction, but it generally does not afford fine-tuning of substrate concentration or flux because it is unidirectional. Negative feedback control, which is much more common than positive control, occurs when the product of a reaction is capable of feedback inhibition of upstream enzyme activity or synthesis. Negative feedback control can be exerted at many upstream reaction steps in a pathway and helps define the points at which metabolic-control strength is exerted. This mechanism, analogous to the function of a thermostat in temperature control, adjusts substrate concentration in a narrow range around a preset value. When the concentration of the reaction product falls, negative feedback inhibition is relieved and the reaction (or reactions) produces more of the regulatory molecule. High concentrations shut down the system, thus providing up-and-down fine-tuning. For example, physiologic levels of G-6-P, the product of the hexokinase reaction, provide feedback inhibition of the 100-kDa hexokinases but not of glucokinase (7). This provides for appropriately regulated levels of the branch-point substrate G-6-P in most tissues. Tissues or organs wherein glucokinase is the predominant hexokinase, such as liver and pancreatic β-cells, are able to continuously phosphorylate glucose owing to the lack of feedback inhibition by G-6-P, the reaction product. The liver is thus able to clear glucose in the postprandial state, and β-cells are able to employ glucokinase as a glucose sensor for regulated secretion of insulin (8). Substrate availability and feedback/ feedforward control are prominent mechanisms in single-cell organisms.
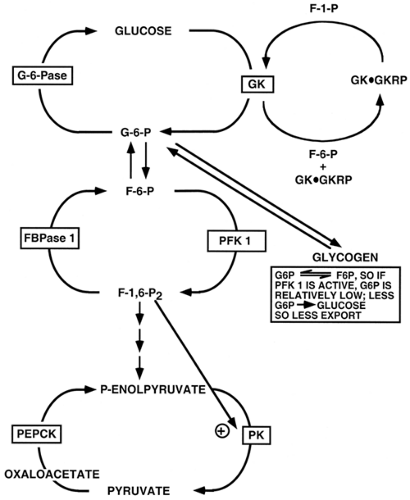 Figure 15.2. A simple control mechanism is provided by substrate availability, which influences the activity or amount of metabolic enzymes. G-6-P, glucose-6-phosphate; F-6-P, fructose-6-phosphate; F-1-P, fructose-1-phosphate; F-1,6-P2, fructose-1,6-bisphosphate; GK, glucokinase; GKRP, gluco-kinase regulatory protein; G-6-Pase, glucose-6- phosphatase; FBPase, fructose-1,6-bisphosphatase; PFK 1, phosphofructokinase-1; PEPCK, phosphoenolpyruvate carboxykinase; PK, pyruvate kinase. |
Complex Control Mechanisms
Simple regulatory systems are advantageous in that they provide very rapid and quickly reversible control. The major disadvantages are that the unicellular organism is susceptible to major environmental changes of substrate availability and the regulation is provided by molecules that are themselves reaction
components. As noted, these mechanisms are frequently employed in glucose metabolism in multicellular organisms. However, the complexity of these organisms is such that certain environmental changes that are threats to survival are often perceived by one tissue or organ and the responses that allow for homeostasis are facilitated by one or more distant organs. Communication between the sensors of the environment and the organs or tissues that provide the appropriate response to recognized challenges is accomplished by the nervous and endocrine systems. For example, hypoglycemia is perceived by the CNS, which triggers the release of glucocorticoids, catecholamines, and glucagon and the inhibition of insulin secretion (Fig. 15.1). These hormones, the so-called first messengers, provide much of the cell-cell communication necessary for the coordinated response that restores the ECF glucose level to the normal range. A variety of intracellular molecules serve as so-called second messengers, including cAMP, cyclic guanosine monophosphate (cGMP), calcium ion, and various phosphatidylinositides. These molecules share several properties. They act as intracellular symbols of particular environmental changes, and more than one of these may be symbols of the same challenge, e.g., hypoglycemia. The concentration of these molecules is labile within the cell, as befits their regulatory potential. In contrast to the simple mechanisms of regulation described above, none of these molecules is a component (substrate or product) of a reaction pathway, nor are they structural analogues of such components. Finally, these regulatory molecules all initiate signal transduction cascades that result in the ultimate biologic response. Again, these cascades are not mutually exclusive, as different signals can activate the same, or complementary, steps in a given pathway. A wide variety of metabolic control mechanisms are affected by these signals, including allostery, posttranslational protein modification, protein translocation, protein-protein interaction, and changes in the amount of key proteins (Table 15.2).
components. As noted, these mechanisms are frequently employed in glucose metabolism in multicellular organisms. However, the complexity of these organisms is such that certain environmental changes that are threats to survival are often perceived by one tissue or organ and the responses that allow for homeostasis are facilitated by one or more distant organs. Communication between the sensors of the environment and the organs or tissues that provide the appropriate response to recognized challenges is accomplished by the nervous and endocrine systems. For example, hypoglycemia is perceived by the CNS, which triggers the release of glucocorticoids, catecholamines, and glucagon and the inhibition of insulin secretion (Fig. 15.1). These hormones, the so-called first messengers, provide much of the cell-cell communication necessary for the coordinated response that restores the ECF glucose level to the normal range. A variety of intracellular molecules serve as so-called second messengers, including cAMP, cyclic guanosine monophosphate (cGMP), calcium ion, and various phosphatidylinositides. These molecules share several properties. They act as intracellular symbols of particular environmental changes, and more than one of these may be symbols of the same challenge, e.g., hypoglycemia. The concentration of these molecules is labile within the cell, as befits their regulatory potential. In contrast to the simple mechanisms of regulation described above, none of these molecules is a component (substrate or product) of a reaction pathway, nor are they structural analogues of such components. Finally, these regulatory molecules all initiate signal transduction cascades that result in the ultimate biologic response. Again, these cascades are not mutually exclusive, as different signals can activate the same, or complementary, steps in a given pathway. A wide variety of metabolic control mechanisms are affected by these signals, including allostery, posttranslational protein modification, protein translocation, protein-protein interaction, and changes in the amount of key proteins (Table 15.2).
TABLE 15.2. Control Mechanisms Employed in Hepatic Glucose Homeostasis | ||||||||||||||||||||||
|---|---|---|---|---|---|---|---|---|---|---|---|---|---|---|---|---|---|---|---|---|---|---|
| ||||||||||||||||||||||
ALLOSTERIC CONTROL
Some of the enzymes and proteins involved in glucose homeostasis are regulated by allosteric control mechanisms. Rather than exhibiting classical Michaelis-Menten kinetics, in which there is a hyperbolic association between substrate binding and enzyme activity, a plot of enzyme activity against substrate concentration shows a sigmoidal relationship. This occurs when substrate binding to one active site influences, in a cooperative fashion, binding to a second site in the same molecule. For example, the reaction velocity of PFK1 increases in a sigmoidal fashion as the concentration of the substrate, fructose-6-phosphate (F-6-P), increases (9,10,11) (Fig. 15.4B, center panel). Some molecules regulate activity of the allosteric enzyme by binding to regulatory sites distinct from substrate binding sites. The allosteric regulator F-2,6-P2 significantly shifts the velocity of the PFK1 reaction for the substrate F-6-P to the left (12,13) (Fig. 15.4B, center panel).
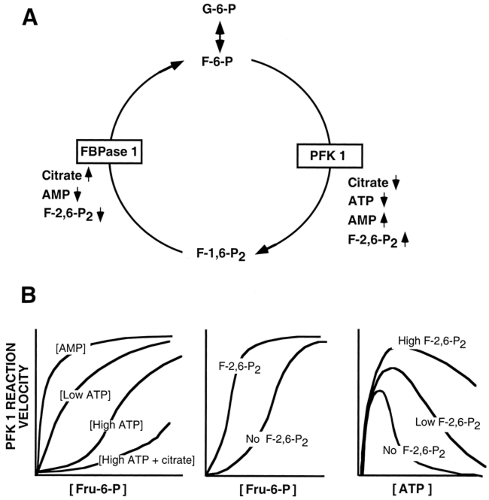 Figure 15.4. Regulation of the fructose-6-phosphate/fructose-1,6-bisphosphate (F-6-P/F-1,6-P2) cycle. A: Glycolysis is stimulated when the energy charge of the cell is low, whereas gluconeogenesis is stimulated when glucose is deficient and the energy charge is high. B: Reaction velocities of phosphofructokinase-1 (PFK 1) are influenced by molecular symbols of carbon supply and energy charge. G-6-P, glucose-6-phosphate; ATP, adenosine triphosphate; AMP, adenosine monophosphate; FBPase, fructose-1,6-bisphosphatase; F-2,6-P2, fructose-2,6-bisphosphate. |
POSTTRANSLATIONAL MODIFICATION OF PROTEINS
Several dozen different types of posttranslational modifications alter the activity of proteins, including many enzymes involved in glucose homeostasis. Modification of enzyme activity by phosphorylation of serine, threonine, or tyrosine residues is a particularly common mechanism. First described in the control of enzymes of glycogen metabolism, regulation by phosphorylation, and dephosphorylation, is employed in many different signal transduction pathways. For example, the binding of glucagon to its cell-surface receptor on the hepatocyte results in the activation of adenylyl cyclase and the production of cAMP from ATP. cAMP activates a kinase cascade that catalyzes the phosphorylation of phosphorylase b on the serine 14 residue of each monomer of this enzyme (14). This phosphorylation results in the conversion of the inactive phosphorylase b to the active phosphorylase a form and glycogen degradation by phosphorolysis.
PROTEIN TRANSLOCATION
The movement of proteins from one cellular compartment to another, with a subsequent change in activity or function of that protein, is an important control mechanism. One of the first examples of this control mechanism is the insulin-promoted movement of the glucose transporter 4 (GLUT4) from an intracellular reservoir to the plasma membrane in skeletal muscle and adipose cells (15,16). In the absence of insulin, there is a continuous movement of GLUT4 into and out of the plasma membrane. The interaction of insulin with its cell-surface receptor activates one or more signal transduction pathways that promote GLUT4 vesicle exocytosis in excess of transporter internalization. The role of phosphoinositide 3-kinase (PI 3-kinase), with possible involvement of downstream kinases such
as protein kinase B (PKB) and protein kinase C (PKCζ/λ, is quite well established in this process (17,18). However, the activation of PI 3-kinase may not be totally sufficient. The role of various signal transduction pathways in moving the GLUT4 vesicle into and out of the plasma membrane remains to be established. Nonetheless, activation of the insulin signal transduction pathway (or pathways) results in a marked enhancement of glucose entry into skeletal muscle and adipose cells because of a protein translocation process.
as protein kinase B (PKB) and protein kinase C (PKCζ/λ, is quite well established in this process (17,18). However, the activation of PI 3-kinase may not be totally sufficient. The role of various signal transduction pathways in moving the GLUT4 vesicle into and out of the plasma membrane remains to be established. Nonetheless, activation of the insulin signal transduction pathway (or pathways) results in a marked enhancement of glucose entry into skeletal muscle and adipose cells because of a protein translocation process.
PROTEIN-PROTEIN INTERACTION
Interactions with other proteins influence the activity of certain proteins. A complex array of protein-protein interactions is involved in regulating the transcription of genes that encode enzymes involved in glucose homeostasis, as will be described below. The interaction of glucokinase with the glucokinase regulatory protein (GKRP) is a pertinent example of a protein-protein interaction (19) and of how more than one mechanism is employed to facilitate a given process, in this case glucose phosphorylation. When glucokinase is bound to GKRP, a reaction facilitated by the allosteric binding of F-6-P to the GKRP (Fig. 15.3), glucokinase is inactive and located in the nucleus of hepatocytes. The exchange of F-6-P with fructose-1-phosphate (F-1-P) results in the dissociation of GKRP from glucokinase and the translocation of the latter to the cytosol, where it is an active enzyme. The regulation of glucokinase activity thus involves allosteric control, protein-protein interaction, and protein translocation, in addition to substrate control. The amount of the enzyme can also be influenced by the rate of transcription of the glucokinase gene.
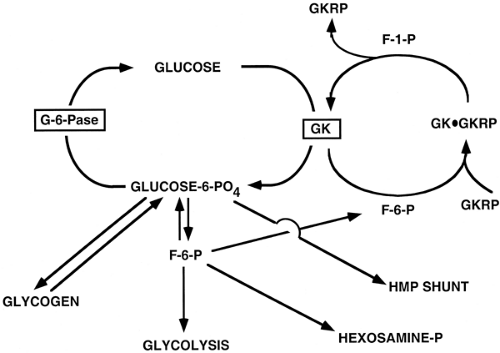 Figure 15.3. Regulation of the glucose/glucose-6-phosphate (G-6-P) cycle. G-6-P is a branch point for several metabolic pathways. G-6-Pase, glucose-6-phosphatase; GK, glucokinase; GKRP, glucokinase regulatory protein; F-6-P, fructose-6-phosphate; F-1-P, fructose-1-phosphate; Hmp-hexose monophosphate. |
REGULATION OF PROTEIN AMOUNT
The examples described above, in one way or another, regulate activity without changing the amount of enzymes or proteins. Several mechanisms also are employed to change the amount of a specific protein in a cell such as a hepatocyte. The concentration of a protein in the cell at any instant represents a balance between the relative rates of its synthesis and degradation. This balance is different for all proteins and is a regulatable process. The rate of synthesis of a protein (mRNA translation) is directly related to the amount of the encoding mRNA and the efficiency of translation of that specific mRNA. Translation is an exceedingly complex, multistep process, and it is extensively regulated. Insulin affects a critical step, the formation of the active translation factor eukaryotic initiation factor-4E (eIF-4E). Stimulation of cells by insulin and other growth factors results in activation of the mammalian target of rapamycin (mTOR) and mitogen-activated protein (MAP) kinase pathways and the phosphorylation of eIF-4E (20). This phosphoprotein associates with several other translation factors to form the eIF-4F complex, which binds to the mRNA cap and allows for translation initiation (20). This mechanism is thought to be responsible for the general anabolic effects of insulin, and it could come to play in enhancing the synthesis of specific proteins.
About 1% to 2% of total body proteins turn over each day in humans, and the liver is actively involved in this process. Hepatic proteins have markedly different turnover rates, measured as the half-life (t½), the time required for a protein to be reduced to 50% of its initial value. This is an important concept, particularly in view of regulation, as the time required to move from one steady state to another, either up or down, is a function of the turnover time of the protein (or any other substance for that matter, e.g., mRNA, lipid, drug). Thus, one can calculate that about five turnover times are required to effect a change of steady state, e.g., 100→50→25→12.5→6.25→3.13, or vice versa. This has useful predictive value in considering how long it will take for an induced or repressed enzyme (or mRNA) to reach its new steady-state level. For example, the t½ for phosphoenolpyruvate carboxykinase (PEPCK) mRNA and protein are ∼0.6 and 2.0 hours, respectively (21). After the addition of glucocorticoids, a PEPCK gene inducer, the new steady states for the mRNA and protein are reached in ∼3 and 10 hours, respectively, assuming there are no effects of the inducer on mRNA or protein turnover (and in this case and others there often are).
The t½ for liver proteins varies from 30 minutes to more than 150 hours. In general, proteins that play a key role in metabolic regulation, such as PEPCK, tyrosine aminotransferase, and hydroxymethylglutaryl-coenzyme A (HMG-CoA) reductase, have short t½ values in the range of 0.5 to 2 hours, and as
mentioned above, these rates can be decreased or increased in response to physiologic signals. Metabolic flux can thus be significantly influenced by the turnover of key enzymes. By contrast, other enzymes, such as aldolase or lactate dehydrogenase, have prolonged t½ values in the range of more than 100 hours. Changes in the amount of such enzymes are not involved in acute adaptive processes.
mentioned above, these rates can be decreased or increased in response to physiologic signals. Metabolic flux can thus be significantly influenced by the turnover of key enzymes. By contrast, other enzymes, such as aldolase or lactate dehydrogenase, have prolonged t½ values in the range of more than 100 hours. Changes in the amount of such enzymes are not involved in acute adaptive processes.
REGULATION OF GENE TRANSCRIPTION
The rules of turnover are also applicable to a consideration of the concentration of a specific mRNA in the hepatocyte. The amount of a given mRNA represents the balance between its synthesis, from gene transcription, and its degradation. mRNAs, like proteins, have markedly different turnover times. In the liver, these range from a t½ of 10 to 15 minutes to a t½ of days for different individual mRNAs. In general, a specific mRNA turns over more rapidly than its cognate protein, and mRNAs that encode enzymes involved in acute metabolic regulation have shorter t½ values than those that direct the synthesis of the so-called housekeeping proteins (21). In addition, hormones that regulate the rate of transcription of a gene also often affect the rate of turnover of the respective mRNA. Thus, glucocorticoids and cAMP increase the rate of transcription of the PEPCK gene, and they both prolong the t½ of PEPCK mRNA (22,23). The net result of these two effects is to increase the amount of this mRNA in the hepatocyte and prolong its presence. This provides for more PEPCK synthesis and an extended influence of the enzyme on gluconeogenic flux.
Much more is understood about the regulation of mRNA synthesis than is known about its degradation. As will be described in detail below, complex arrays of protein-DNA and protein-protein interactions are involved in the regulation of the initiation phase of transcription of specific genes. These assemblies are controlled by a series of events that follow in sequence from the interaction of a hormone with the target cell. Regulation of the activity of PEPCK in the hepatocyte provides a case in point. This enzyme is not appreciably affected by feedforward, feedback, or allosteric control mechanisms, nor is its activity subject to change as a result of posttranslational modification of the protein, by protein-protein interactions, or by its location in the hepatocyte. Changes of PEPCK activity are attributable to alterations in the amount of the enzyme in the cell, which is directly related to the amount of PEPCK mRNA available for translation. This amount is principally determined by the rate of PEPCK mRNA synthesis, although degradation of the mRNA can also be important in certain circumstances (22,23). cAMP enhances PEPCK gene transcription by first promoting the phosphorylation of a protein, cAMP response element binding protein (CREB), that binds to the cAMP response element (CRE) in the PEPCK gene promoter (24,25). This phospho-CREB-CRE complex triggers the assembly of a set of protein-protein interactions that result in enhanced initiation of transcription through the PEPCK gene promoter (26). Glucocorticoids bind to the cytosolic glucocorticoid receptor (GR), which then dissociates from a chaperone protein and translocates into the hepatocyte nucleus to bind to the glucocorticoid response element (GRE). Occupation of the GRE by the GR triggers a different series of protein-DNA and protein-protein interactions that also result in an enhanced rate of PEPCK gene trans-cription and, in sequence, increased mRNA and protein synthesis and enzyme activity (27,28). Insulin, through its signal transduction cascade, inhibits PEPCK gene transcription and also slows the rate of PEPCK mRNA translation (27,29). Thus, the regulation of PEPCK activity, which has significant control strength in gluconeogenesis, is regulated by several mechanisms.
Metabolic Control Analysis
Until recently the guiding principle in metabolic control has been the idea that there is a single rate-controlling step in any metabolic pathway. Flux through such a pathway could thus be increased or decreased by changing the activity of that single rate-determining enzyme. The advent of recombinant DNA technology enabled investigators to rather easily change the expression of a given enzyme in a cell; yet this often does not result in the change of flux predicted by the rate-limiting enzyme hypothesis. These results were not surprising to students of metabolic control analysis, a concept first proposed by Kacser some 30 years ago (30). Metabolic control is assessed by measuring all enzyme activities, their kinetic properties, the substrates and products of each reaction, and the relevant regulatory molecules in a particular pathway. An analysis of the data allows one to assign a quantitative control strength value (C) to each step in this pathway. The sum of the C values for a pathway equals 1.0. High C values indicate high control strength. When appropriately analyzed, it is apparent that control strength can be distributed among the several steps in a pathway, and the C value for a given step can be changed by different metabolic circumstances. An examination of glucose metabolism in the isolated, beating heart provides a good example of these principles. In a heart preparation perfused with a physiologic concentration of glucose, control of the early steps of glucose metabolism is distributed between glucose transport (C value of 0.4) and glucose phosphorylation (C value of 0.6) (31). The addition of insulin results in a remarkable change in the distribution of control strength. Under these conditions the C value for glucose transport is now negligible (0.0002), whereas the C value for glucose phosphorylation increases to 0.97 (31). Phosphoglucoisomerase accounts for the other 0.02. Metabolic control analysis also allows one to assign relative importance to a set of reactions within a complex pathway. For instance, in the case cited, the distribution of control provided by transport/ phosphorylation (0.58), glycolysis (0.25), and glycogen synthesis (0.17) was assessed.
At equilibrium, the supply of an end product by the series of enzymes and substrates equals the demand afforded by product utilization and degradation. Thus, the demand side can also influence metabolic control by providing a pull on the system. Two recent studies illustrate the importance of this concept. In studying tryptophan biosynthesis in yeast, investigators first showed that exogenous provision of excessive amounts of the first enzyme in the biosynthetic pathway did not increase flux to tryptophan. All of the enzymes in the pathway had to be overexpressed to increase flux (32). This illustrates the point made above about so-called rate-limiting steps. Of more interest was the observation that the biosynthetic enzymes (“supply side”) accounted for only about 25% of the control strength. The other 75% was presumably provided by the “demand side,” e.g., the use of tryptophan for protein synthesis. This is similar to the example cited above, in which, in the heart, glycolysis and glycogen synthesis exert control strength downstream from glucose transport/phosphorylation (31). That demand may also be an important control step as illustrated in another recent report. Glycolysis, as noted above, provides ATP from glucose. Yeasts engineered to have an excess of the ATP-degrading enzyme adenosine triphosphatase (ATPase) have a remarkable increase in glycolytic flux (33). This observation is pertinent to the topic of this chapter. The energy charge in these cells, as
reflected in a low AMP/ATP ratio, resulted in increased glycolytic flux. As described in detail below, a low AMP/ATP ratio promotes flux through the critical glycolytic enzymes PFK1 and PK in hepatocytes. It thus is important to recognize that supply and demand are both significant, that control is distributed, and that this distribution is subject to change according to metabolic circumstances.
reflected in a low AMP/ATP ratio, resulted in increased glycolytic flux. As described in detail below, a low AMP/ATP ratio promotes flux through the critical glycolytic enzymes PFK1 and PK in hepatocytes. It thus is important to recognize that supply and demand are both significant, that control is distributed, and that this distribution is subject to change according to metabolic circumstances.
GLUCOSE AUTOREGULATION IN LIVER
Glucose Transport by Hepatocytes
Glucose enters all cells by facilitated diffusion (from a high to low concentration) through one of the members of the glucose transporter family of proteins (34). This is basically a unidirectional process in cells that cannot produce glucose, as one of the four hexokinase family members (HK-I–IV) rapidly converts glucose to G-6-P, which cannot be exported by the glucose transporter. The activity of these hexokinases keeps the intracellular free-glucose concentration low, so most cells have a net uptake of glucose due to inward, passive diffusion. The only regulation of this process is afforded by the extracellular glucose concentration (substrate control) and by G-6-P, which inhibits (by negative feedback) the 100-kDa hexokinases (isoforms I–III).
Hepatocytes, which can produce glucose from glycogenolysis and gluconeogenesis, can export and import glucose. The direction of glucose flux depends on the concentration gradient. Under certain metabolic conditions (e.g., fasting or hormonal conditions that favor glycogenolysis and/or gluconeogenesis), hepatocytes release glucose into the ECF. The ability of the hepatocyte to effect net glucose release is a function of its high Km hepatic transporter coupled with a regulatable high Km hexokinase (HK-IV, or glucokinase). When hormonal conditions favor glucose utilization (high insulin, low glucagon), glucokinase activity is high, intracellular glucose is rapidly phosphorylated, and glucose entry is facilitated along a downhill gradient. When conditions favor glycogenolysis or gluconeogenesis (low insulin, high glucagon), glucokinase activity is reduced, the low rate of glucose phosphorylation results in intracellular accumulation of glucose, and glucose is exported by facilitated diffusion. The hepatic GLUT2 transporter has a Km for glucose of ∼40 mM and generally functions with pseudo first-order kinetics with respect to the intracellular or extracellular glucose concentration (34). Because the portal vein glucose concentration normally does not exceed 10 mM, transport is not limiting for either hepatic glucose import or export. Because of this feature there is no need for regulation of the hepatic glucose transporter.
General Features of Hepatic Substrate Cycles
Hepatic glucose production and utilization involve the movement of substrates through three major cycles (2,35) (Fig. 15.2). Hepatic glucose production, by gluconeogenesis, is a biosynthetic pathway. Glucose utilization, by glycolysis, is a degradative pathway. Degradative and biosynthetic pathways are usually catalyzed by separate sets of enzymes. This affords unique, but flexible, control of each pathway. The latter is particularly important in this instance, as the production of a single molecule of glucose from gluconeogenesis requires the expenditure of six high-energy bonds [four ATP and two guanosine-triphosphate (GTP)], whereas glucose degradation to two pyruvate molecules results in the production of two ATP molecules. Futile cycling between the cycles involved in gluconeogenesis and glycolysis could thus be very wasteful in terms of energy consumption and heat production. In general, a negative free-energy charge (AMP, or a high AMP/ATP ratio) promotes glycolysis, and a high free-energy charge (ATP, or a low AMP/ATP ratio) favors the gluconeogenic pathway.
The direction and magnitude of substrate movement, along either the glycolytic or the gluconeogenic pathway, is controlled by six enzymes that catalyze essentially irreversible reactions and thus have high metabolic control strength (2). The three enzymes that catalyze the glycolytic reactions must be bypassed by three different enzymes that direct the gluconeogenic pathway and vice versa. The activity of these six enzymes is modulated by acute (seconds to minutes) and chronic (minutes to hours) regulatory mechanisms. The acute regulation of hepatic glucose metabolism occurs through hormone-mediated changes in enzymatic activity, principally the phosphorylation or dephosphorylation of two key enzymes, PK and phospho-fructokinase-2/fructose-2,6-bisphosphatase (PFK2/FBPase2, the bifunctional enzyme), and the allosteric regulation of GK by GKRP and of PFK1 and FBPase1 by F-2,6-P2 (2,3). Hormones also exert chronic effects on glucose metabolism by changing the rate of enzyme synthesis. These chronic effects are mediated through alterations of the rate of mRNA synthesis and, in some cases, by changes in the rate of degradation of specific mRNAs.
The net flux through the glucose/G-6-P, F-6-P/F-1,6-P2, and phosphoenolpyruvate/pyruvate cycles depends on the relative activity of the enzymes illustrated in Figure 15.2. Conditions favoring gluconeogenesis (the combination of high plasma glucagon, catecholamine, and glucocorticoid levels with a low plasma insulin level, as occurs when animals are starved or fed a low-carbohydrate diet) result in increased activity of PEPCK, FBPase1, and glucose-6-phosphatase (G-6-Pase) and a coordinate decrease in the activity of GK, PFK1, and PK. Reciprocal changes in the activities of these enzymes occur when animals are fed a carbohydrate diet, particularly after a prolonged fast (2,3). In this situation, the plasma insulin concentration increases, levels of the counterregulatory hormones decrease, and glycolysis predominates. The F-6-P/F-1,6-P2 substrate cycle is also regulated by a subcycle in which the amount of the regulatory molecule F-2,6-P2 is controlled by the bifunctional enzyme (2,3). The relative activity of these seven enzymes, established by the interaction of several hormones, determines whether the hepatocyte is a consumer or producer of glucose. The activity of the enzymes involved in the cycles is controlled by all of the control mechanisms described above. Many other enzymes are also involved in these processes; however, they catalyze equilibrium reactions that are not rate determining.
Regulation of the Glucose/Glucose-6-phosphate Cycle
Upon entering the hepatocyte through the GLUT2 transporter, glucose is converted to G-6-P by the enzyme glucokinase (Fig. 15.3). Glucokinase is an unusual member of the hexokinase family. Its Km for glucose is greater than 5 mM, whereas the Km for HK-I–III (glucokinase is HK-IV) varies between 20 and 120 μM (4,5). This difference in Km values gives the brain, muscle, and red blood cells, which have isoforms I–III, preference when the glucose supply is limited. Portal vein and liver sinusoidal glucose concentrations are high after a meal. Hepatocytes efficiently convert glucose to G-6-P because glucokinase (HK-IV) works most efficiently at this elevated glucose concentration (7). Also, unlike HK-I–III, glucokinase is not subject to feedback inhibition by physiologic concentrations of the reaction product, G-6-P (7). Because GLUT2 operates by facilitated diffusion,
the activity of glucokinase, which keeps intracellular glucose concentrations very low, determines glucose clearance by hepatocytes.
the activity of glucokinase, which keeps intracellular glucose concentrations very low, determines glucose clearance by hepatocytes.
This cycle is important because G-6-P is a branch-point substrate for, or a product of, the glycolytic, gluconeogenic, glycogen formation/degradation, hexosamine, and hexose monophosphate shunt pathways (Fig. 15.3). The balance of glucose phosphorylation and G-6-P hydrolysis, and thus the production or metabolism of glucose, as well as the avoidance of futile substrate cycling, requires the interplay of a number of control mechanisms.
Glucokinase activity is not altered by covalent modification, but its activity is regulated by an allosteric mechanism and by changes in the amount of the protein (2,19). Glucose phos-phorylation, by glucokinase, results in increased intracellular levels of G-6-P. Although physiologic concentrations of G-6-P do not inhibit glucokinase, G-6-P is in near equilibrium with F-6-P through the action of the reversible enzyme phosphoglucoisomerase. F-6-P increases the affinity of binding of the nuclear GKRP to glucokinase (19). When bound to GKRP, glucokinase is found primarily in an inactive form in the nucleus of the hepatocyte (36,37,38). This complex is subject to allosteric regulation, as the inhibition of glucokinase by F-6-P is reversed by F-1-P, which competes with F-6-P for binding to the GKRP (19). F-1-P binding causes a conformational (allosteric) change of GKRP. This results in the dissociation of glucokinase, which can then translocate to the cytoplasm as an active enzyme (38). Thus fructose, which is converted to F-1-P by fructokinase, promotes hepatic glucose clearance by its indirect activation of glucokinase (38) (Fig. 15.3).
Glucokinase gene transcription, glucokinase mRNA, and glucokinase activity are decreased when plasma glucagon is high and plasma insulin is low (e.g., fasting or diabetes) (7,37,39,40,41). Refeeding a diet high in carbohydrate results in an increase of these parameters. A 20- to 30-fold increase in trans-cription occurs within 30 to 60 minutes after the injection of insulin into a diabetic rat or after the addition of insulin to primary cultures of hepatocytes (40,41,42). Glucokinase mRNA increases accordingly (40,41), and a significant increase of glucokinase activity and attendant flux from glucose to G-6-P ensues (43). The inhibitory effect of glucagon (or cAMP, its intracellular messenger) on glucokinase gene transcription is dominant over the stimulatory effect of insulin, because cAMP blocks the effects of insulin at all concentrations of insulin in cultured cell systems (44). These hormone effects are not dependent on the presence of glucose in the medium (41,44).
Related posts:

Stay updated, free articles. Join our Telegram channel

Full access? Get Clinical Tree


