13.1
Introduction
Bone is the primary load-bearing component of the musculoskeletal system, protecting vital organs and providing a framework for locomotion. Its resilient and durable nature is due to its structure and composition. Bone has a hierarchical structure starting at a nanoscale level, and all scales are considered to contribute to its overall mechanical behavior and function . Its hierarchical structure, together with evidence that changes in structure can occur with aging and/or disease at multiple length scales, renders bone a classic subject for study of biomechanics.
In studying the mechanical behavior of bone, it is important to distinguish between the mechanical behavior of bone as a structure (structural behavior) and of the bone tissue itself (material behavior). The material behavior of a specimen is independent of its geometry and reflects the intrinsic properties of the tissue material. Typically, the material behavior of a specimen is determined by conducting mechanical tests on standardized specimens under simple loading conditions. In contrast, the structural behavior of a specimen, determined by conducting mechanical tests on whole bone specimens subjected to physiologic or traumatic loading conditions, reflects both the morphology and material properties of the specimen. Bone fractures observed clinically are likely the result of material failure of the bone tissue that leads to catastrophic failure of the bone structure.
In a hierarchical composite material such as bone the definition of material properties requires additional clarification. In describing the properties of bone as a tissue the mechanical properties of single trabeculae, calcified bone matrix, single osteons, or small specimens of cortical or trabecular bone could be considered. Hence, in answering a given research question, interest may be in measuring the mechanical properties at the numerous hierarchical levels in bone starting from individualized mineralized fibrils, single osteons or lamellae, trabecular or cortical bone, whole bone, or several of the above. Tests performed at each of these levels provide insight into bone’s mechanical properties and the effects of numerous age-, disease-, or treatment-related changes in these properties.
In much of this chapter, we will consider bone “material” to include the extracellular bone matrix, marrow spaces in trabecular bone, and Haversian and Volkmann’s canals in cortical bone. Thus we take a continuum mechanics approach, in that the specimen is small enough to be homogeneous (uniform), but large enough to include a sufficient number of trabeculae (for trabecular bone) or osteons (for cortical bone) to characterize the material behavior of trabecular bone and cortical bone, respectively.
13.2
Introduction to bone mechanics
13.2.1
Stress and strain
The primary function of the skeleton is to provide the body with support, which can be measured by bone’s mechanical response to loading. Skeletal loading comprises both repeated occurrences of applied forces with daily activities and single impact forces during traumatic events. Measures typically used for engineering materials are useful for assessing bone’s mechanical behavior in response to loading. Thus the primary biomechanical properties describe the relationship between loads (forces) applied to the bone or bone test specimen and the deformations that result from the applied loads.
Two key biomechanical measurements are stress and strain ( Fig. 13.1 ). Stress, in its most basic form, is typically defined as force per unit area ( σ = F / A ) and describes the intensity of the applied force. Normalization of the applied force to the cross-sectional geometry of the loaded specimen allows for direct comparison of different load magnitudes applied to a given specimen, and direct comparison of differently sized specimens subjected to the same load.
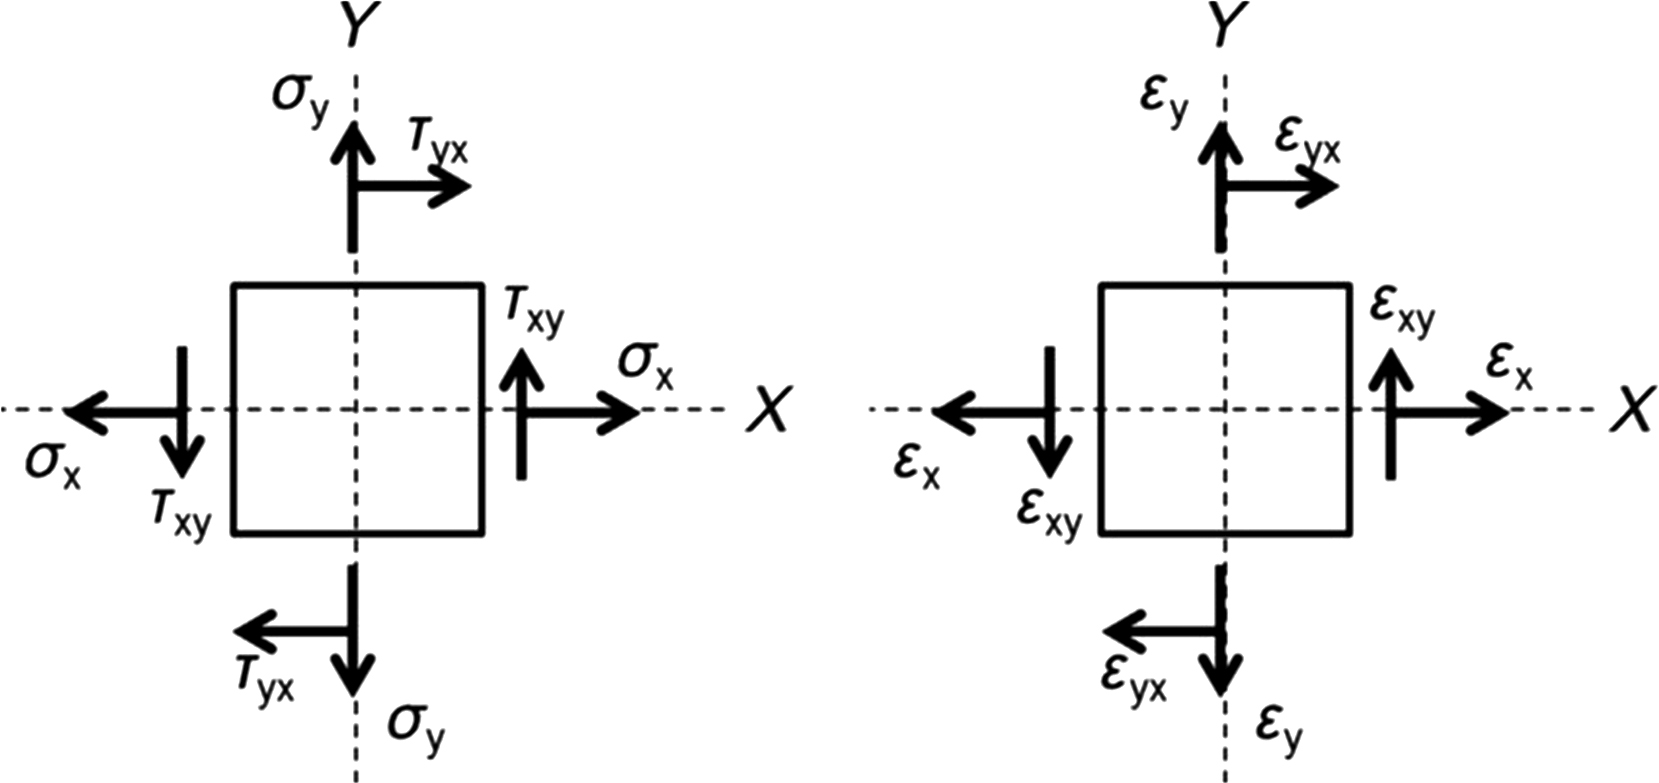
The local deformation that results from these applied loads is referred to as strain, which is calculated as the change in length divided by the initial length ( ε =Δ L / L initial ). Unlike displacement, the deformation is expressed in terms of a relative change in the size or shape of the specimen. Strain is dimensionless and is often expressed in microstrain (10 −6 mm/mm), percent change (10 −2 ), or radians.
When forces are applied to a bone, a complex and varied distribution of stresses and strains arise throughout the bone structure. These stresses and strains can be categorized as normal stresses and strains or shear stresses and strains. For a given plane within the bone structure, normal stresses act perpendicular to that plane to either pull apart (tensile) or compact the specimen (compression). Shear stresses act parallel to that plane such that the stresses act to slide one region of the specimen relative to another. Thus normal strains are associated with elongation or shortening, while shear strains represent distortion. In formal terms, normal strains, whether tensile or compressive, quantify the change in length of the specimen relative to its original length. Shear strain defines the angular change during the deformation. Bone tissue is usually subjected to both normal and shear stresses, and both normal and shear strains during normal skeletal function.
Load and deformation as well as stress and strain alone cannot provide all the necessary information on the mechanical behavior of bone. Many key mechanical variables of bone are computed from interactions between these properties and can be identified on the load–deformation or stress–strain curve.
The load–deformation curve describes the amount of load needed to produce a unit of deformation and reflects the structural behavior of the bone. Hence, the shape of this curve depends on both the size and shape of the bone, as well as the properties of the tissue that comprise it. Load and deformation are linearly related until the yield point is reached, at which point the slope of the load–deformation curve decreases. Before the yield point, the bone is in the elastic region, and if the applied load is removed, the bone will return to its original shape with no permanent or residual deformation. The slope of the load–deformation curve in this elastic region defines the structural stiffness of the bone. In contrast to the elastic region the bone undergoes permanent deformation in the postyield region and does not return to its original shape if and when the load is completely removed. If the load continues to increase, the ultimate or failure load is reached after which point the structure fails or fractures. The energy required to cause failure of the structure is calculated as the area under the load–displacement curve and is termed the work-to-failure.
The stress–strain curve ( Fig. 13.2 ) is similar to the load–deformation curve but reflects the material behavior of the bone tissue. A stress–strain curve is generated by conducting a mechanical test on a specimen of standardized geometry, such that one can easily determine stress from force and strain from displacement. Initial loading exhibits linear behavior, and the slope of the stress–strain curve in this elastic region is the elastic (or Young’s) modulus ( E = σ / ε , MPa). The amount of strain a bone specimen will undergo in response to an applied stress depends on Young’s modulus. It is the slope of the initial portion of the stress–strain curve (i.e., between 0.1% and 0.3% strain), which can be determined using several methods . Similar to Young’s modulus, the shear modulus is defined as the slope of the initial portion of the shear stress–strain curve. For cortical bone the stress–strain curves are fairly linear at low values of stress , making reproducible measurement of the modulus straightforward. In contrast, trabecular bone exhibits nonlinearity even at low stress levels, and care must be taken to calculate the curve’s slope in a manner that is standardized across specimens and experiments .
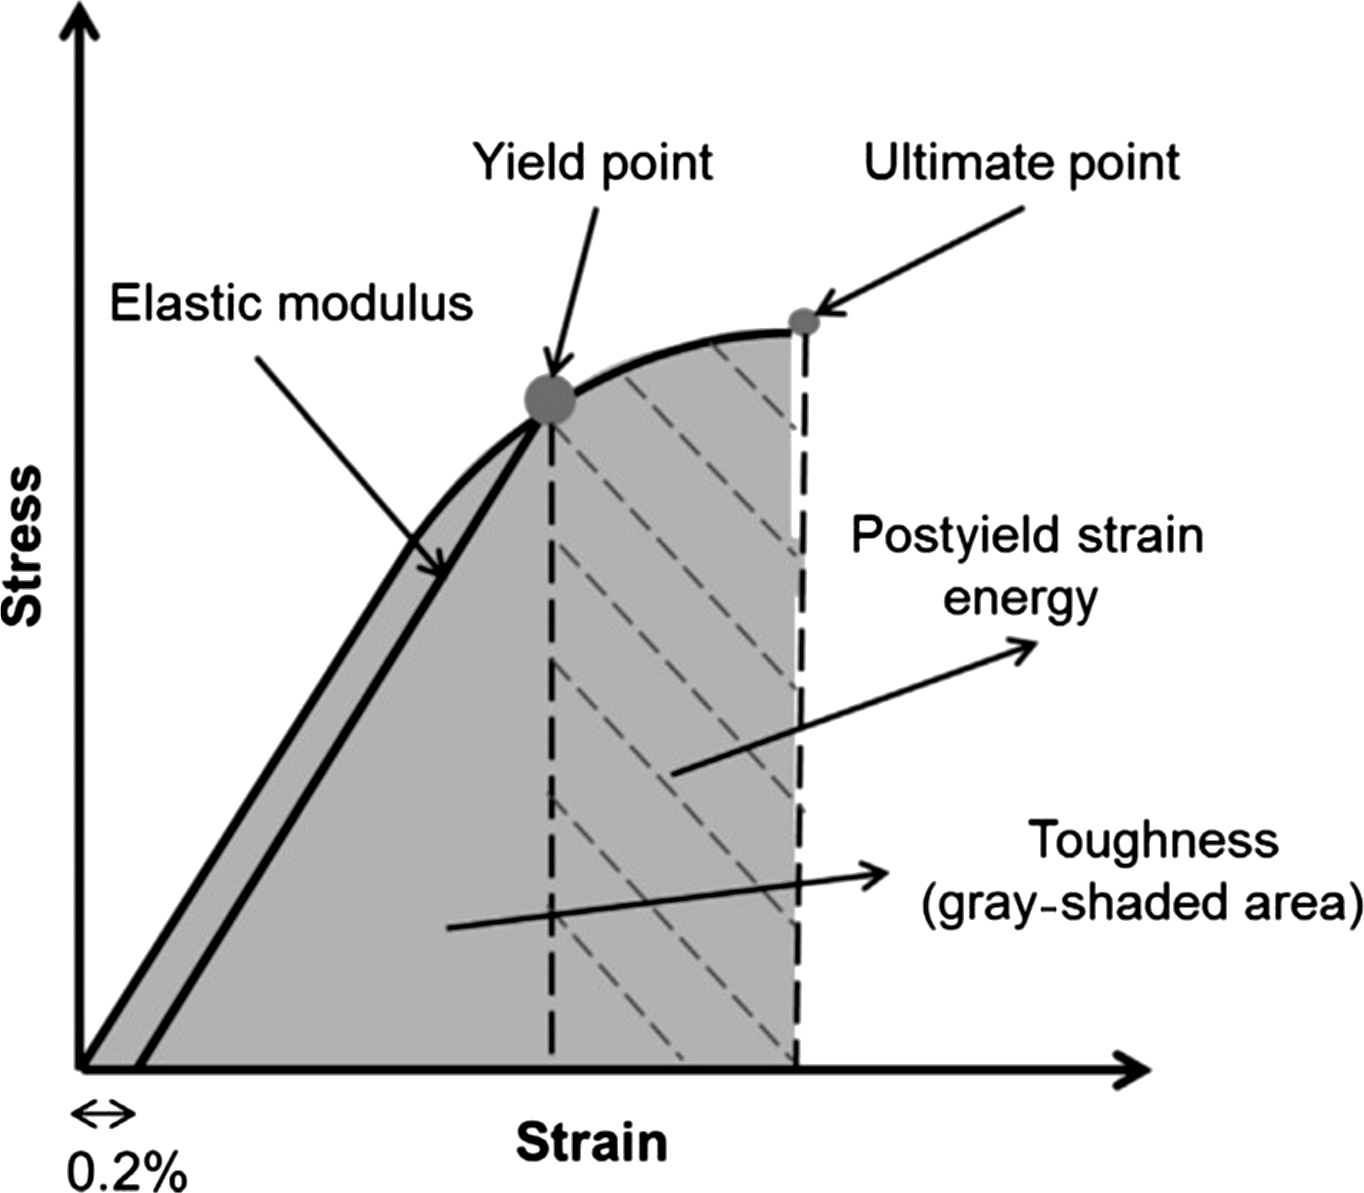
The values of stress and strain at the yield point are the yield stress and yield strain, respectively. Although there are several methods acceptable for determining the yield point, one commonly used method is to define the yield point as the location at which a line having the same slope of the elastic modulus intersects the stress–strain curve and has a strain intercept of 0.2% ( Fig. 13.2 ). This point demarcates the separation between linear-elastic behavior and irrecoverable plastic strain. Variables that are computed prior to the yield point are considered preyield while those beyond the yield-point are considered postyield. The point of maximum stress on the curve is the position at which the material begins to reach failure because the material cannot sustain any additional load beyond this point. The values of stress and strain at this ultimate point are the ultimate stress and ultimate strain. The ultimate stress and strain may or may not be equal to the fracture stress and fracture strain, which are the points at which the material breaks apart. Brittle materials sustain little deformation before fracture, whereas ductile materials undergo significant deformation before fracture.
13.2.2
Material characterization: strength-of-materials approach
13.2.2.1
Material testing
Several methods are commonly used to determine the strength and stiffness of bone ( Fig. 13.3 ). Tensile tests are designed such that most of the strain occurs in the mid-region of the bone specimen, which is dumb-bell shaped . An extensometer attached to the mid-region of the specimen allows for accurate strain measurement, while stress is determined by dividing the applied load by the cross-sectional area of the specimen as described under “stress and strain.” Although they provide accurate measures of bone’s biomechanical properties, tensile tests are limited by the need for a large specimen size.
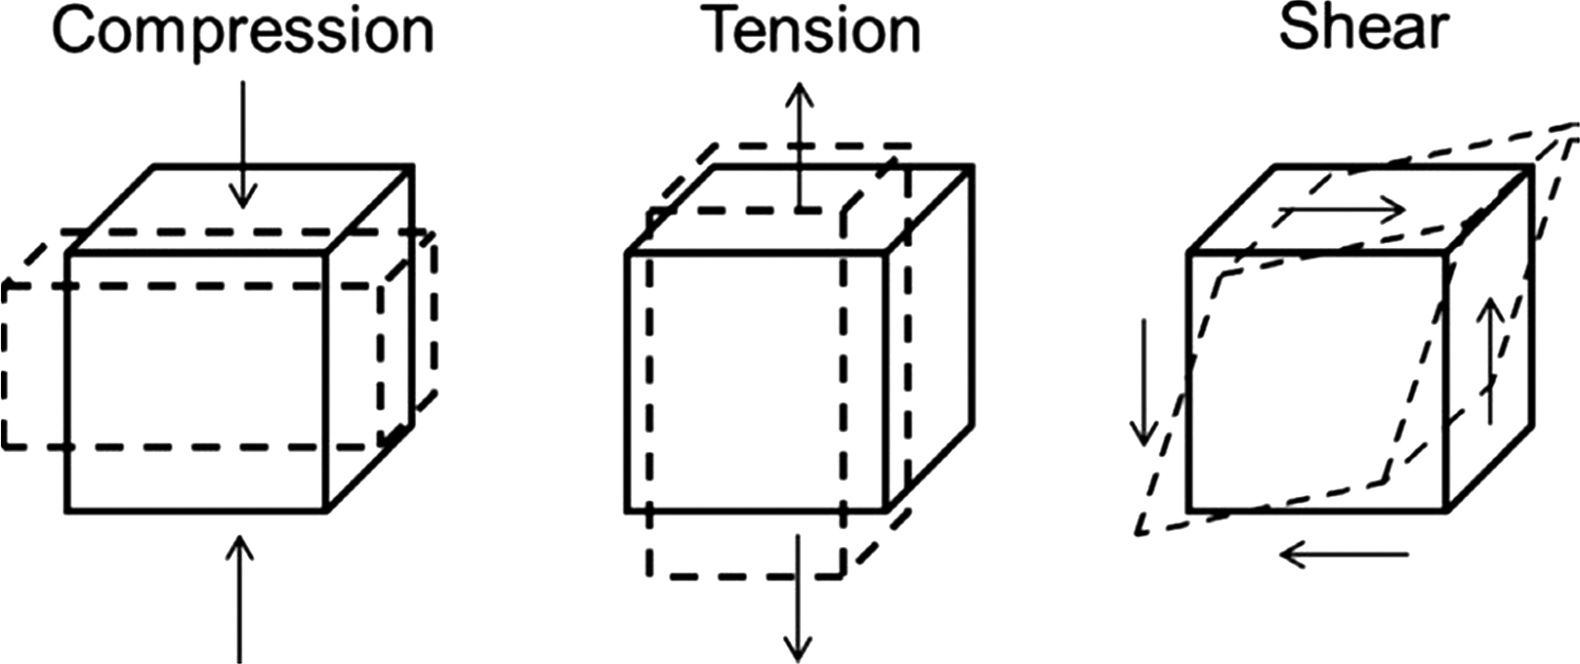
Compression tests are useful particularly for trabecular bone specimens as relatively small specimens can be used during testing. These tests are not as accurate as tensile tests due to experimental issues that may result if specimen ends are not parallel and, hence, can result in large stress concentrations occurring on some portions of the sample ends. Aligned brass-end caps for the ends of specimen and a pivoting platen to correct for misalignment can help with this issue . Accurate strain measures can be taken at the mid-region with the use of an extensometer. Compression tests have several advantages in that specimens can be smaller in size than that needed for tensile tests, and more importantly, these tests simulate certain in vivo loading conditions in the body . Measured mechanical properties reported in the literature for human trabecular and cortical bone are listed in Tables 13.1 and 13.2 , respectively. Potential reasons for variability in the reported values may result from age of specimens, microarchitecture, and experimental testing methods.
| Mechanical property | Range | Location | Description | References |
| Modulus (MPa) | 389–3230 | Femur | Compression | |
| 445–1091 | Tibia | Compression | ||
| 67–344 | Vertebra | Compression | ||
| 597–2700 | Femur | Tension | ||
| 1068 | Tibia | Tension | ||
| 301–349 | Vertebra | Tension | ||
| Yield strain (%) | 0.70–1.25 | Femur | Compression | |
| 0.73 | Tibia | Compression | ||
| 0.77–1.60 | Vertebra | Compression | ||
| 0.61 | Femur | Tension | ||
| 0.65 | Tibia | Tension | ||
| 0.70–0.78 | Vertebra | Tension | ||
| Yield stress (MPa) | 3.21–17.45 | Femur | Compression | |
| 5.83 | Tibia | Compression | ||
| 0.95–2.02 | Vertebra | Compression | ||
| 2.44–10.93 | Femur | Tension | ||
| 4.50 | Tibia | Tension | ||
| 1.72–1.75 | Vertebra | Tension | ||
| Ultimate strain (%) | 1.71 | Femur | Compression | |
| 2.02 | Tibia | Compression | ||
| 1.19–7.40 | Vertebra | Compression | ||
| 1.59 | Vertebra | Tension | ||
| Ultimate stress (MPa) | 5.6–8.05 | Femur | Compression | |
| 2.22–5.33 | Tibia | Compression | ||
| 1.02–2.54 | Vertebra | Compression | ||
| 2.23 | Vertebra | Tension |
| Mechanical property | Range | Location | Description | References |
| Modulus (MPa) | 10,700–14,800 | Femur | Bending | |
| 18,200 | Femur | Compression, longitudinal | ||
| 11,700 | Femur | Compression, transverse | ||
| 19,300–25,100 | Tibia | Compression | ||
| 3300–3510 | Femur | Shear | ||
| 17,900 | Femur | Tension, longitudinal | ||
| 10,100 | Femur | Tension, transverse | ||
| Yield strain (%) | 0.73 | Femur | Tension | |
| Yield stress (MPa) | 191–227 | Femur | Bending | |
| 182 | Femur or tibia | Compression, longitudinal | ||
| 121 | Femur or tibia | Compression, transverse | ||
| 54 | Femur or tibia | Shear | ||
| 107.9–115 | Femur | Tension | ||
| Ultimate strain (%) | 2.20 | Femur or tibia | Compression, longitudinal | |
| 4.62 | Femur or tibia | Compression, transverse | ||
| 33 | Femur or tibia | Shear | ||
| 2.93–3.1 | Femur or tibia | Tension, longitudinal | ||
| 3.24 | Femur or tibia | Tension, transverse | ||
| 0.7 (0.14) | Femur | Tension, transverse | ||
| Ultimate stress (MPa) | 208.6–281 | Femur | Bending | |
| 109–193.0 | Tibia | Compression | ||
| 195–205 | Femur | Compression, longitudinal | ||
| 131–133 | Femur | Compression, transverse | ||
| 65–71 | Femur | Shear | ||
| 133–135 | Femur | Tension, longitudinal | ||
| 51–53 | Femur | Tension, transverse | ||
| Fracture toughness (MPa√m) | 5.09 | Femur | Young | |
| 1.69–2.23 | Humerus | Young | ||
| 4.28 | Femur | Old | ||
| 0.92–1.44 | Humerus | Old | ||
| 2.2–2.7 | Tibia | Shear | ||
| 2.2–5.7 | Tibia | Tension, transverse | ||
| 2.2–5.7 | Femur | Tension, longitudinal |
13.2.2.2
Structural testing
Bending tests are commonly used to measure the biomechanical properties of small animal bones, which are not feasible to machine into specimens for compressive or tensile testing. These bending tests can be conducted using either three- or four-point loading configurations. Three-point bending offers simplicity but may create high shear stresses near the mid-region of the bone specimen. In contrast, four-point bending is slightly more difficult to apply to specimens of a very small size but creates pure bending between the two loading points. If the span length between support fixtures is too short, large shear stresses can result. Hence, it is suggested to have as large as possible of an aspect ratio (i.e., 6) to determine the span length in order to avoid these issues .
To measure bone mechanical properties in shear, a torsion test can be used. Here, a torque is applied to a specimen. These tests are often used to calculate shear properties of small whole animal bone (i.e., rodents) where the two ends of the bone are embedded in plastic or low melting point metal alloy blocks, and then the blocks are twisted relative to each other. For human bone, small specimens can be used to test either cortical or trabecular bone. However, due to the anisotropic (direction-dependent) structure of bone, investigators should consider using different axes of twist relative to the anatomic axes of the bone (see next).
13.2.3
Material characterization: fatigue
Bone is repetitively loaded in vivo by basic daily activities. Simulating these, cyclic loads ex vivo can result in degradation of bone’s mechanical properties gradually over time. Cumulative damage results from these loads without recovery, and this process is referred to as fatigue. Fatigue is primarily attributed to the formation of microcracks within the bone that grow with repetitive loading until they accumulate and coalesce to result in failure. Hence, fatigue failure is dependent on bone’s resistance to crack initiation and propagation. With fatigue, failure can occur at loads much lower than that normally needed to cause a sudden failure (i.e., impact fracture).
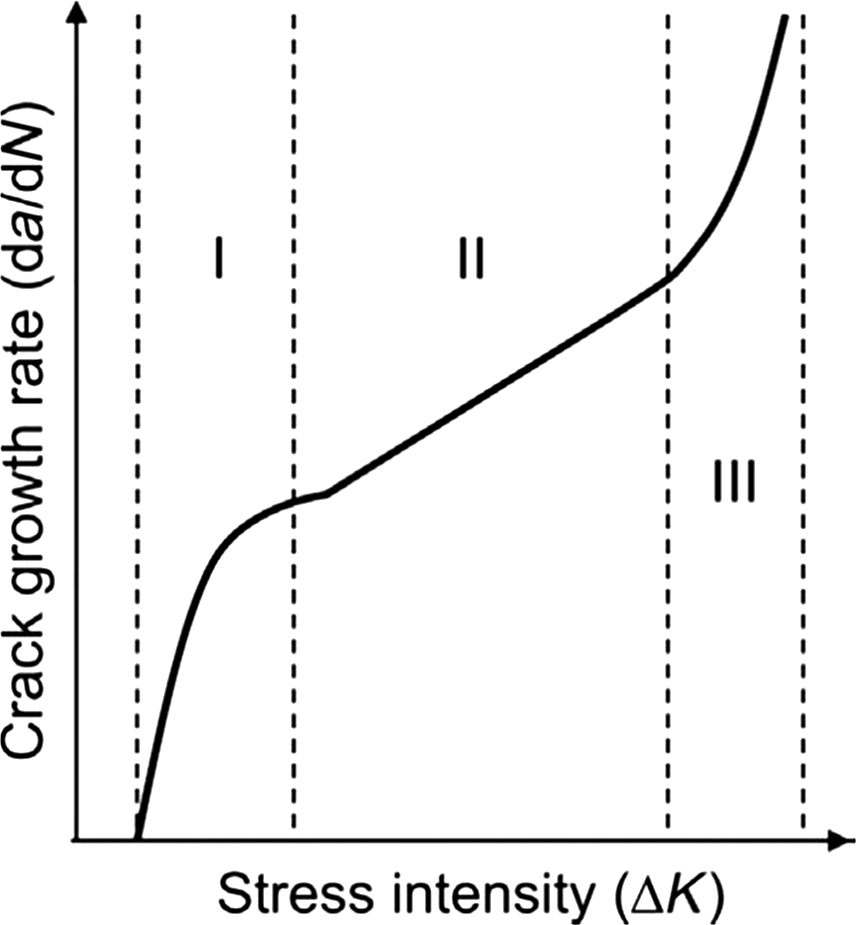
In general, bone’s fatigue life can be grouped into three distinct stages ( Fig. 13.4 ): the time during which cracks initiate and accumulate (stage I), the time during which cracks grow (stage II), and the time during which cracks coalesce (stage III). The magnitude of the stress field at the crack tip is referred to as the stress intensity factor (K). Throughout stage I, bone has rapid stiffness loss with microcracks rapidly accumulating. By the first 25% of bone’s fatigue life, there is stabilization in stiffness loss, which remains constant throughout stage II during which time the cracks grow in size. During the crack growth period, there is not much degradation in the biomechanical properties of bone because secondary cracking ahead of the crack tip relieves stress concentrations. Just before failure during the last 10% of bone’s fatigue life when the cracks reach a critical size and coalesce into larger-scale macrocracks, the stiffness deteriorates rapidly and results in bone fracture .
Tensile, compressive, bending, or torsional loading can be used to determine bone’s fatigue properties. Bone’s fatigue behavior is commonly characterized by measuring the total number of cycles until failure (N) as a function of the applied stress, which is termed the stress–life or “S–N” approach. Using this method, the fatigue lifetime illustrates the number of cycles needed to initiate and propagate a crack to cause failure. This approach is most commonly used to characterize the fatigue behavior of mineralized tissues such as bone . An S–N curve (applied stress vs number of cycles until failure) can be used to illustrate the testing results where the failure is generally defined as the number of cycles needed for the specimen to lose 30% of its intrinsic stiffness.
Numerous studies have been conducted using these methods to characterize bone’s fatigue behavior. In particular, it has been shown that fatigue properties of cortical bone depend on porosity, density, and mineral content . In addition, there is a higher fatigue life for younger bone compared to older bone, and bone with higher density has a longer fatigue life . A more recent study shows that physical characteristics at the microstructural level (osteonal vs interstitial bone) also affect bone’s fatigue behavior where the ratio of osteonal to interstitial hardness values deteriorates fatigue strength .
13.2.4
Material characterization: fracture mechanics
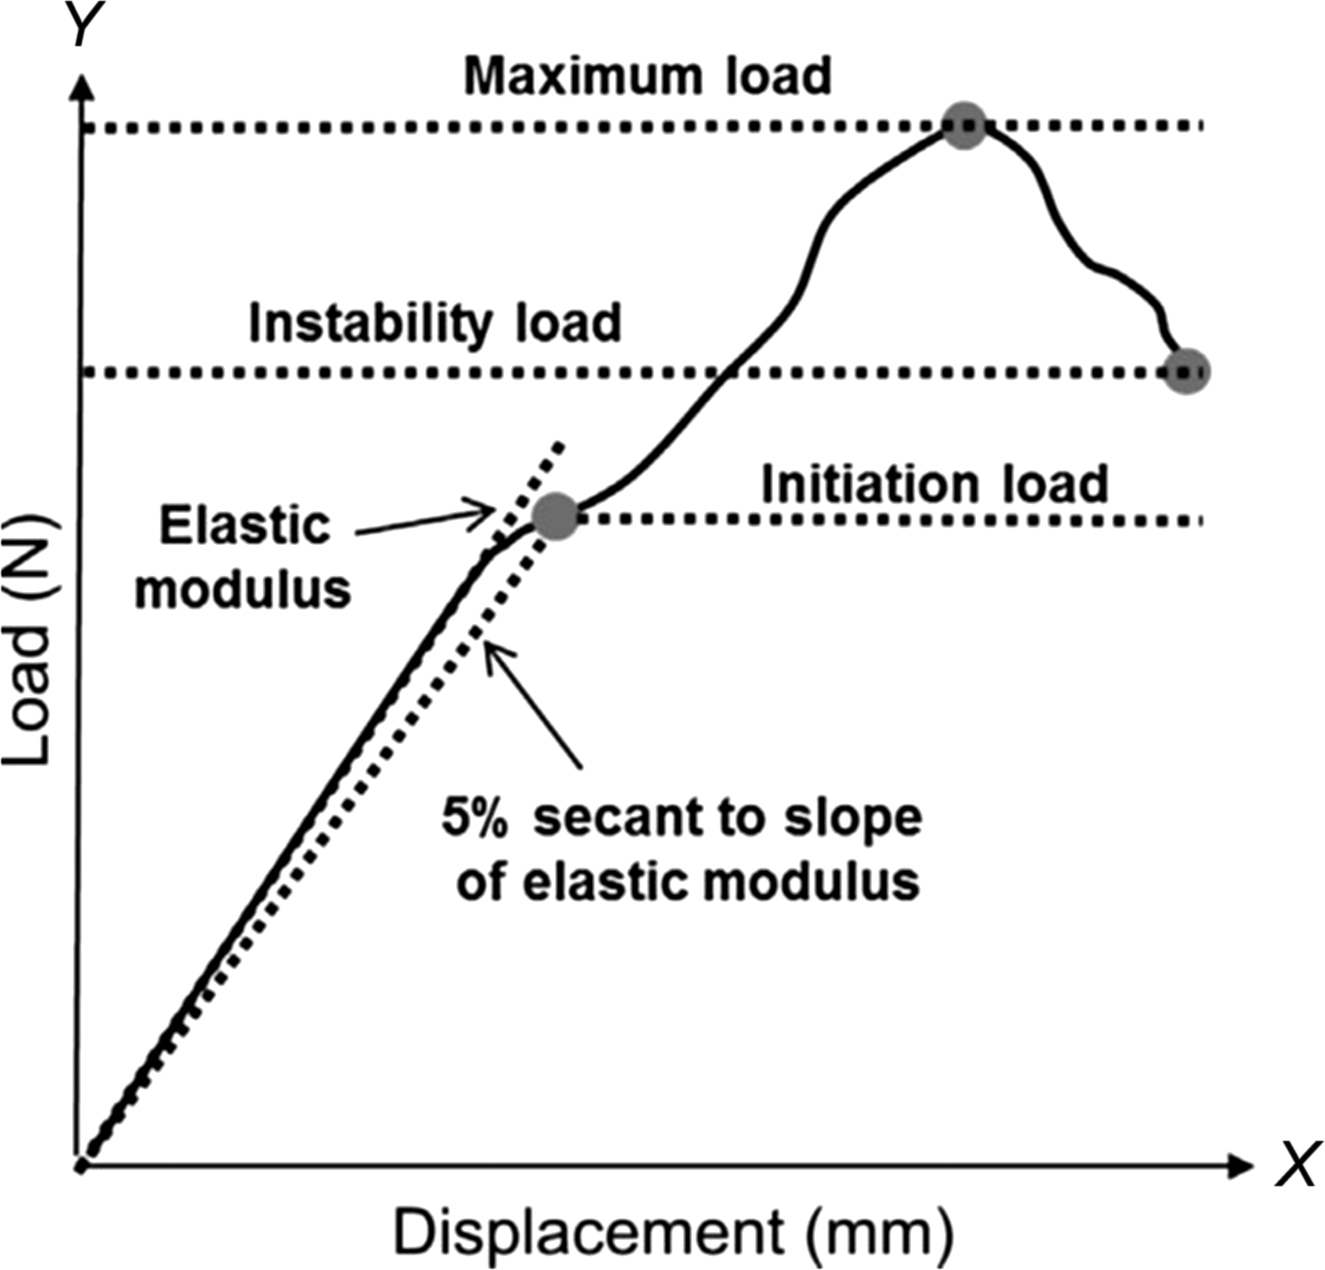
In order to measure bone’s material properties, early studies utilized the strength-of-materials approaches discussed in Section 13.2.3 . These methods result in the initiation and propagation of fracture from the random distribution of natural flaws . However, fracture resistance depends also on the presence of preexisting defects (i.e., microdamage) in addition to the stress or strain applied to bone. Hence, to characterize materials with naturally occurring defects better, a fracture mechanics-based approach was developed in which a sharp crack of standardized geometry is induced in the specimen before mechanical loading. This precrack allows for the fracture to initiate from a specific location under carefully controlled loading and allows one to measure the resulting changes . Using a precracked specimen, toughness at initiation and propagation can be measured ( Fig. 13.5 ). Initiation toughness illustrates the inherent toughness of the material, while propagation toughness measures a material’s resistance to the propagation of the initiated crack .
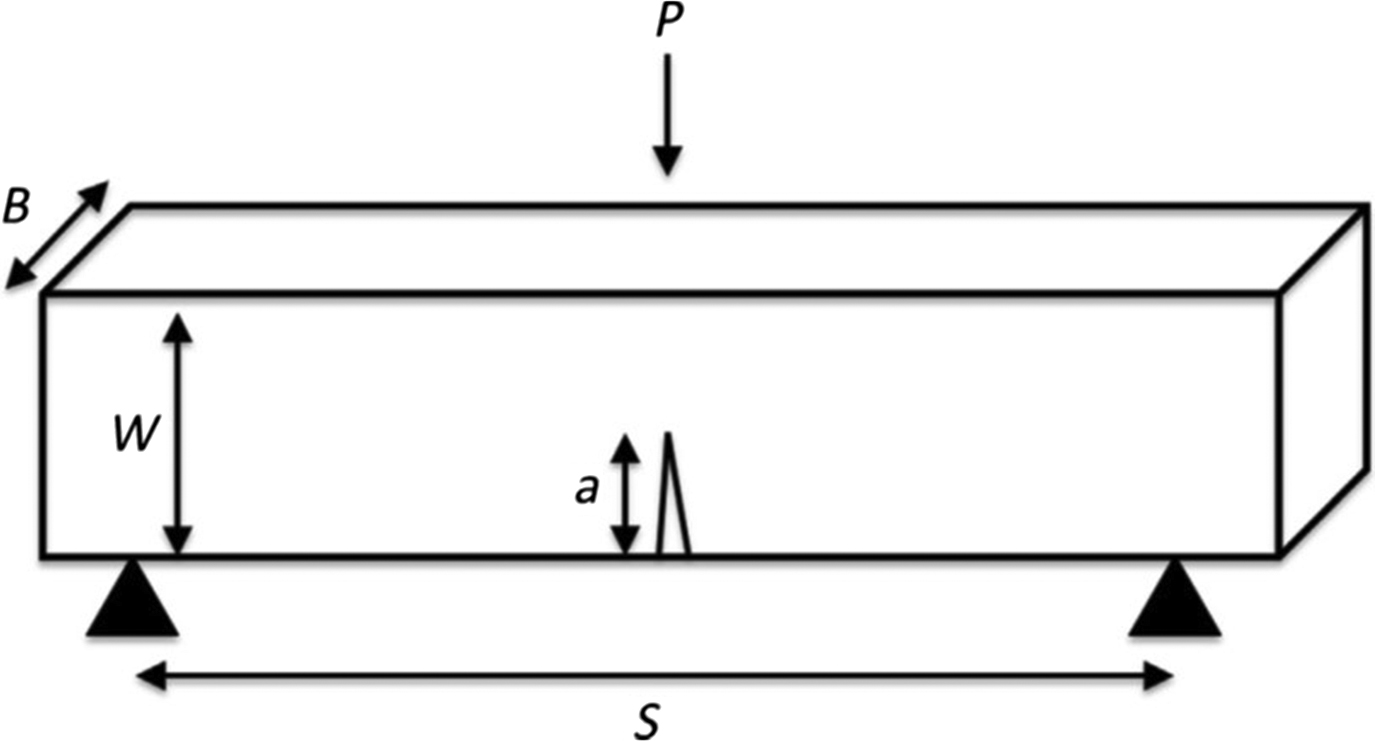
The critical stress intensity factor (K) can be measured by characterizing information regarding the stress state near the tip of the crack in a linear-elastic material . The stress state near the crack changes with the thickness of the specimen until it reaches a critical dimension associated with plane strain. Once the critical dimension is attained, K becomes fairly constant at which point it is known as the plane–strain fracture toughness . K solutions for more complex configurations incorporate a geometric shape factor that is a function of crack and specimen size and shape . The most common test specimen configurations include single edge notch bend ( Fig. 13.6 ) or compact tension specimens. Specimen geometry, notch parameters, and loading data are used to calculate toughness at initiation ( K init ) and propagation ( K prop ) using formulas described in the American Society for Testing and Materials (ASTM) standards .
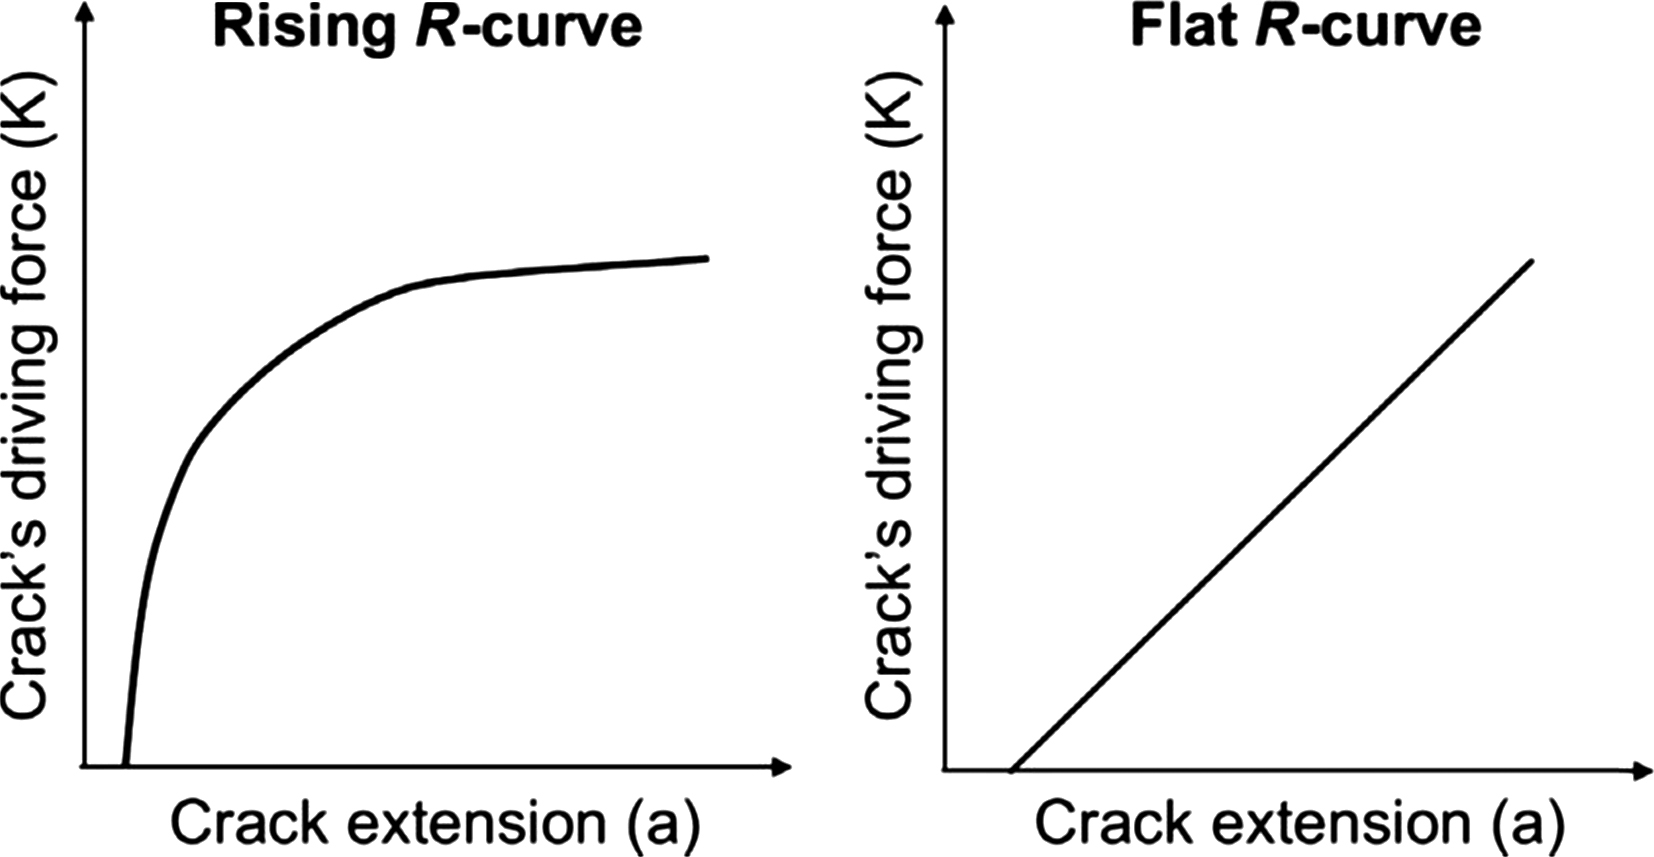
Toughness can be described by the crack growth resistance curve ( R -curve) where toughness changes with increasing crack propagation . This curve illustrates the crack’s driving force (e.g., K) as a function of crack extension. A typical crack growth resistance curve for a linear elastic material is initially steep as the crack initiates and has little growth (initiation toughness). However, fracture resistance increases as the crack propagates (propagation toughness) until it reaches a steady state, at which point the R -curve reaches a plateau . Some materials such as bone can exhibit a rising R -curve shape, while others have a flat R -curve ( Fig. 13.7 ). The slope provides a measure of the crack growth toughness . Because rodent bones are too small to generate full R -curve behavior, and it is not feasible to monitor crack extension within such small specimen dimensions, the most suitable approach to measure bone toughness in a small animal model is to determine a single value of K by testing via three-point bending . In this approach, precracked (i.e. via a small notch in the mid-diaphysis) rodent long bones are mechanically tested via three-point bending. To calculate fracture toughness, three-dimensional (3D) images, obtained via microcomputed tomography, can be utilized to pinpoint the exact location of the notch made in the bone. A cross-sectional image of the notch can then be used to measure the inner and outer radii, cortical thickness, and notch angles (initial notch and notch at the instability region). Geometry measurements and the load obtained during fracture can be incorporated to calculate the fracture toughness.
Comparison between the traditional and contemporary methods shows that the notched technique produces smaller variations in fracture toughness than the unnotched method . In addition, it was found that crack propagation measures more comprehensively capture the fracture behavior of bone than initiation measures . As toughness measurements via this fracture mechanics-based approach are dependent on the applied loading and the material, they reflect changes only in the material properties . Fracture toughness values reported in the literature for human cortical bone are listed in Table 13.2 .
13.3
Role of bone composition and microstructure on bone mechanical properties
13.3.1
Mineral density and porosity
The mechanical properties of cortical bone are heavily dependent on the degree of matrix mineralization (i.e., deposition and maturation of mineral content within bone), degree of crystallinity (i.e., quality of the mineral), and porosity . Mineralization and degree of crystallinity are closely linked, temporally aligned processes and, therefore, are typically considered together. Over 80% of the variation in the elastic modulus of cortical bone can be explained by a power–law relationship with matrix mineralization and porosity as explanatory variables . A few studies show that with increasing age, the mineralization of the matrix increases, leading to stiffer, but more brittle material behavior , while other studies indicate that there are no age-related changes in the degree of mineralization .
The elastic modulus and strength of trabecular bone are also determined to a great extent by bone mineral density . Power–law relationships with bone density as the explanatory variable explain 60%–90% of the variation in modulus and strength . These power–law relationships indicate that small changes in apparent density can lead to dramatic changes in mechanical behavior. For example, a 25% decrease in apparent mineral density (equivalent to 15–20 years of age-related bone loss) would be predicted to lead to a 44% decrease in trabecular bone strength. Notably, however, the yield and ultimate strains of trabecular bone have very weak or no dependence on bone density and are relatively constant for a given anatomic site .
13.3.2
Anisotropy
Both cortical and trabecular bone are anisotropic materials, which means that their mechanical properties are direction-dependent. Most types of bone tissue exhibit a class of anisotropy called orthotropy, where the material properties differ along each of the three mutually perpendicular directions. The anisotropic nature of bone reflects its function as a load-bearing structure, as it is generally stiffest and strongest in the primary loading direction. For instance, cortical bone from the femoral diaphysis has a higher elastic modulus and strength when loaded in the longitudinal direction than in the transverse direction , which is known as transverse isotropy. Trabecular bone from the vertebral body is much stiffer and stronger in the vertical direction than in the transverse direction . Yet, trabecular bone properties from the iliac crest and central femoral head are nearly isotropic , indicating that the degree of anisotropy varies with anatomical site and functional loading . Although the anisotropy of bone tissue allows for greater resistance to loads applied in the primary loading direction for a given amount of tissue, it necessarily results in a lesser load-bearing capacity in directions oblique to the principal loading direction.
13.3.3
Microarchitecture
Given the anisotropic nature of trabecular bone and the variation in predicted modulus for a particular bone density , it is evident that density alone cannot explain all of the variability in trabecular bone’s mechanical behavior. Empirical observations and theoretical analyses indicate that trabecular architecture plays an important role in determining its mechanical properties . The architecture can be characterized by the thickness, number, and separation of the individual trabecular elements, extent of interconnectivity, shape of trabeculae (rod-like vs plate-like), as well as the degree of anisotropy.
However, defining the precise role of microarchitecture in prediction of the mechanical behavior of bone and its influence on fracture risk is complicated by the fact that microarchitecture characteristics are strongly correlated to each other and to bone density. Trabecular number, trabecular thickness, and connectivity all decline with decreasing density, whereas trabecular separation and anisotropy increases . Previous studies using architectural features derived from a model assumes that trabecular bone architecture is “plate-like” suggested that architectural features provided only modest improvements in the prediction of mechanical properties over those provided by bone density alone . However, these previous findings should be interpreted with caution, as more recent data indicate significant differences in structural indices derived from the traditional plate-model compared to those computed directly from high-resolution 3D images . Indices of trabecular structure determined directly from 3D microcomputed tomography have been shown to significantly improve the prediction of the mechanical behavior of trabecular bone specimens from several skeletal sites and prediction of the strength of whole vertebrae . More recent techniques use individual trabecular segmentation (ITS), in which the entire 3D trabecular network is segmented into an assembly of individual trabecular plates and rods . Studies using ITS demonstrated that trabecular bone microarchitecture changes from plate- to rod-like with aging, suggesting that trabecular microarchitecture is an important factor to consider for the prediction of bone strength . In particular, ITS has shown that although trabecular plate-related microstructural parameters correlated highly with mechanical properties such as yield strength and elastic modulus, rod-related parameters were moderately inversely correlated with these same properties .
As mentioned previously, because changes in trabecular architecture are strongly interrelated, it is difficult to discern the relative effect on bone strength of reductions in trabecular number versus trabecular thickness for both vertically and horizontally oriented trabecular struts. To address this issue, Silva and Gibson developed a two-dimensional (2D) model of vertebral trabecular bone to simulate the effects of age-related changes in trabecular microstructure. They found that reductions in the number of trabeculae decreased vertebral bone strength two to five times more than reductions in trabecular thickness that resulted in an identical decrease in bone density. For instance, removing longitudinally oriented trabecular elements to create a 10% reduction in density resulted in a 70% reduction in bone strength. In contrast, reducing trabecular thickness to achieve a 10% reduction in density resulted in only a 20% reduction in strength. This study implies that it is important to maintain trabecular number in order to preserve bone strength with aging. Consequently, therapies designed to counter age-related declines in bone strength should strive to maintain or restore the number of trabeculae, rather than just increasing the thickness of existing trabecular struts.
13.3.4
Protein composition
Bone’s organic matrix is composed primarily of type 1 collagen, which is a major extracellular matrix protein found in many tissues including bone, cartilage, tendons, and vasculature. Collagen can undergo various molecular level biochemical modifications such as crosslinking. One pathway for intra- and intermolecular cross-linking is enzymatic where enzymatic cross-link formation is controlled by either lysine hydroxylases or lysyl oxidase . Generally, these enzymatic cross-links contribute positively to bone mechanical behavior, whereas impaired formation of enzymatic cross-links is associated with decreases in bone strength .
Similar to other soft tissues in the body, bone collagen also accumulates cross-links via nonenzymatic glycation (NEG) . The process of NEG involves a reaction between an aldehyde of an extracellular sugar and the ε-amino group of hydroxylysine or lysine. The resulting glucosyl-lysine rearranges to form an Amadori product or Schiff base, both of which undergo further reactions to form irreversible cross-links known as advanced glycation end-products (AGEs) . These cross-links form between tropocollagen molecules and across collagen fibers and, therefore, can affect collagen flexibility and have an overall impact on bone mechanical properties . Specific NEG cross-links such as pentosidine have a detrimental effect on bone material properties, such that accumulation of these cross-links leads to more brittle behavior . AGE content is positively correlated with the stiffness of the organic matrix of bone, and increased organic matrix stiffness can reduce microcracking and collagen deformation . Hence, AGE accumulation in the bone matrix may decrease bone toughness by modifying the key intrinsic toughening mechanisms.
In addition to modifications of the collagen network, noncollagenous proteins such as osteopontin and osteocalcin in the bone matrix can also affect bone material properties. Osteopontin is important for mineralization and plays a role in the bone resorption process by helping anchor osteoclasts to the mineral matrix on the bone surface . More importantly, this protein has been considered to act as a “glue” that holds mineralized collagen fibers together. Under an applied force this nonfibrillar component stretches, energy dissipates by the breaking of sacrificial bonds, and harmful crack formation is prevented . Moreover, osteocalcin stimulates mineral maturation and inhibits bone formation . Specifically, this protein recruits osteoclast precursors to bone resorption sites and helps with their differentiation into mature osteoclasts . Notably, osteocalcin-deficient mice have altered crystallinity and consequently reduced bone hardness compared to controls .
13.3.5
Microdamage
Microscale damage can accumulate in bone as a consequence of repetitive cyclic loading with daily activities. In reviewing the potential role of skeletal microdamage in age-related fractures, Burr et al. suggest that microdamage caused by repetitive loading of bone likely initiates at the level of the collagen fiber or below and may include collagen fiber-matrix debonding, disruption of the mineral–collagen aggregate, and failure of the collagen fiber itself . They hypothesize that the accumulation and coalescence of these small defects eventually lead to microcracks that are visible under light microscopy. Laboratory studies have shown that damage accumulation in bone leads to a decrease in bone strength and fatigue life ex vivo .
Naturally occurring microcracks have been observed in human specimens from several anatomic locations, including trabecular bone from the femoral head, iliac crest, and vertebral body, as well as cortical bone from the femoral and tibial diaphysis . The type of microdamage formed depends on interactions of the applied loading with the extracellular matrix, bone microarchitecture and other bone tissue components . The two main morphologies of microdamage are diffuse damage and linear microcracks, which can be distinguished by their low and high surface-to-volume ratios, respectively. Diffuse damage forms as clusters of small cracks at the sublamellar and ultrastructural levels (<1–2 μm) , whereas linear microcracks (>2 μm) are mostly parallel to the direction of osteons . In general, tensile loading produces diffuse damage, while compressive and torsional loading leads to linear microcracks ( Fig. 13.8 ). Diffuse damage is beneficial to bone because it allows for the dissipation of energy under applied loads and is self-limiting. In contrast, linear microcracks are thought to be detrimental to bone because they are composed of submicroscopic cracks that can coalesce and propagate to produce a catastrophic fracture ( Fig. 13.8 ).

It has been hypothesized that the accumulation of microdamage in vivo may contribute to the increased fragility of the aging skeleton . However, despite the contribution of microdamage to ex vivo bone biomechanical properties, the effects of in vivo microdamage on bone mechanical properties have proved difficult to establish. A few studies reported that loss of elastic modulus in bone is correlated with the amount of microdamage accumulation . More recently, fluorochrome staining of bone specimens to determine the amount of microdamage suggest that modest amounts of microdamage (damage volume fraction DV/BV=1.5%) were associated with 50%–60% reductions in cancellous bone strength . Moreover, in a series of studies investigating the consequences of suppressed bone remodeling by bisphosphonate treatment in dogs, Burr et al. determined that 1 year of treatment leads to increased microdamage accumulation and reduced bone toughness in the rib . However, whereas bisphosphonate treatment was also found to reduce the toughness of vertebral trabecular bone, the treatment had no effect on work-to-failure and led to an increase in the ultimate load for the vertebra . Further, a longer term follow-up study demonstrated that microdamage did not continue to accumulate between 1 and 3 years of treatment, yet toughness declined further over this period of time . These data indicate that the observed decrease in toughness may result from factors other than microdamage. A more recent study shows that microdamage does not affect trabecular bone toughness as significantly as bone quantity, suggesting that although microdamage accumulation can be detrimental to bone strength, improvements in bone quantity at the expense of some microdamage accumulation may still have an overall positive effect on bone .
13.4
Mechanical behavior of whole bone
13.4.1
Clinically relevant loading of whole bone
The principal challenge in the design of laboratory tests that seek to characterize clinically relevant mechanical behavior of a whole bone is to identify appropriate loading conditions. These loading conditions have been estimated using gait analysis, simulated falls, instrumented prostheses, and, in some cases, direct measurement in tissues. Gait analysis, or more generally, inverse dynamics analysis applied to activities of daily living and to falls , can estimate joint contact and muscle forces for a variety of physiological motions. For example, these types of analysis have estimated that the magnitude of the force acting on the femoral head during the stance phase of walking is 250±30% of body weight and that approximately 85% of the total impact force sustained from a sideways fall to the hip is delivered along a line of action that passes directly through the hip joint . With the increase in child obesity, gait analysis helped to better understand the changes in joint loading . It was found that hip and knee joint loading increased proportionally to body fat and increase in body mass, which highlights the role of obesity in pediatric joint pain . For the spine, intradiscal pressure is a direct measure of the load transferred to the vertebral body via adjacent intervertebral discs. Intradiscal pressure measurements have been conducted in vivo, using either an implanted pressure transducer or a pressure transducer that is attached to a needle inserted in the nucleus pulposus . These data have indicated that the pressure at the L4–L5 disc is 0.1 MPa while standing . However, these pressure distributions are just one aspect of vertebral loading in vivo, and biomechanical models that account for the complex muscular structure and muscular coactivity in the spine are lacking .
Prostheses instrumented with load sensors that can transmit data remotely have also been designed and implanted in other anatomic sites such as the shoulder, hip, and knee joints . These instrumented implants have the same geometry and function as conventional implants, and the force data that they provide have been invaluable for gauging the accuracy of the force estimates from gait analysis and for optimizing implant design. For example, Damm et al. used data collected from instrumented hip implants to estimate the moments caused by friction during walking to better understand the lubricating properties of the synovia and to better replicate in vivo lubrication conditions in simulations that may lead to improved implant designs. The data are also advantageous when used by physiotherapists to rehabilitate patients and assess the usefulness of aids such as braces .
13.4.2
Whole bone fracture patterns
An important goal of producing fractures in the laboratory is to simulate the mechanisms of accidents that typically result in fractures and to produce types of fractures that are similar to those observed clinically. Numerous classifications of fractures exist and the classification strongly depends on the anatomical localization of the bone involved. For long bones, which are frequently involved in biomechanical testing, fractures can be classified based on morphologic criteria related to the mechanism of the injury into transverse, oblique, spiral, or butterfly fractures ( Fig. 13.9 ) .

