24.1
Introduction
Women spend about one-third of their life span in the postmenopausal period. Menopause represents a vulnerable time in a women’s life for a number of reasons, but in particular, for her skeletal health. In this chapter, we review methodological issues in studying the menopause and also studies that describe changes in bone density as measured by dual-energy X-ray absorptiometry (DXA) and quantitative computed tomography (QCT). A major focus of our chapter is the Study of Women’s Health Across the Nation (SWAN), which has added significantly to our understanding of changes in women’s bone health over the menopausal transition (MT). Newer data on changes in femoral neck (FN) bone strength indices, hip geometry and size parameters as estimated by DXA, trabecular bone score (TBS), and bone turnover markers across menopause are included. The hormonal changes that influence these skeletal changes are reviewed. Finally, the growing data from SWAN on fracture risk across menopause are summarized. It is important to acknowledge that while this chapter specifically addresses skeletal changes around the MT, premenopausal bone status is influenced by whether or not the individual reached their peak skeletal mass, within their genetic potential and the age-related bone loss that occurs in both men and women that reflects the remodeling imbalance that can begin as early as the third decade of life.
24.2
Methodological issues in studying menopause
Different definitions of “perimenopause” and “menopause” have been used making comparisons across studies difficult. The World Health Organization defines “perimenopause” as the period of time immediately before menopause (when the endocrinological, biological, and clinical features of approaching menopause commence) and the first year after menopause. To operationalize this for research, different definitions have been used. For example, the Massachusetts Women’s Health Study defined perimenopause as self-report of 3–12 months of amenorrhea ; the Melbourne Study defined “early” as new onset of cycle irregularity and “late” as absence of menses for 3–11 months . In the SWAN, early perimenopause was defined as at least one menstrual cycle in the last 3 months but noted a “change” in cycle irregularity. “Late” perimenopause was defined as no menstrual bleeding in the last 3 months but some menstrual bleeding during the last 11 months .
The Stages of Reproductive Aging Workshop plus 10 (STRAW+10) updated nomenclature and staging systems for ovarian aging, including menstrual and qualitative hormone criteria STRAW+10 provides a comprehensive overview for classifying various stages of reproductive aging in research and clinical settings. Application of these criteria to clinical and epidemiologic studies will facilitate comparisons across studies.
Another major issue in studying menopause and the accompanying hormonal changes is the difficulty in standardizing the collection of blood samples, including the frequency and day of menstrual cycle. In SWAN, we attempted to draw blood in a specific window, days 2–5 of the menstrual cycle (early follicular phase). However, as women progressed through the MT, this became increasingly difficult because of increased cycle length variability. In SWAN when women were classified as late perimenopausal, more than 90% of blood draws were not able to be done in the early follicular phase due to unpredictability of cycles. To address this, in a subset of women, we collected daily urine samples for one cycle up to 60 days but this was costly, time-consuming, and burdensome to participants and could not be carried out in most epidemiologic studies. Analytically, SWAN has approached this issue by using several techniques, including adjustment for whether the blood sample was collected within the time window or not. Alternatively, analyses can be stratified by this variable (in window, yes or no) to test whether results differ by timing of blood draw.
The “menopause” is usually defined as 12 months of amenorrhea. But definitions of menopause using this criterion are imprecise for women who are in early or late perimenopause who may be more or less proximal to their final menstrual period (FMP). Bone loss could differ in those two stages. A more precise definition is a retrospective one based on identification of the FMP.
The initiation of hormone therapy during the menopause is an important confounding factor in studying the natural history of bone loss at menopause. Estrogen with or without a progestin has been consistently shown to reduce bone loss and decrease fracture risk . Many women initiate hormone therapy before 12 months of amenorrhea and therefore the date of menopause cannot be identified. Women go on and off their hormone therapy frequently. Finally, there are many hormonal regimens and it is impossible to standardize or to analyze outcomes by dose or product. Similarly, the date of menopause cannot be defined in women who undergo hysterectomy without oophorectomy before 12 months’ amenorrhea. In SWAN, we approached these methodological issues by censoring women at time of hormone therapy initiation and date of hysterectomy.
24.3
Pathophysiology of skeletal changes at menopause
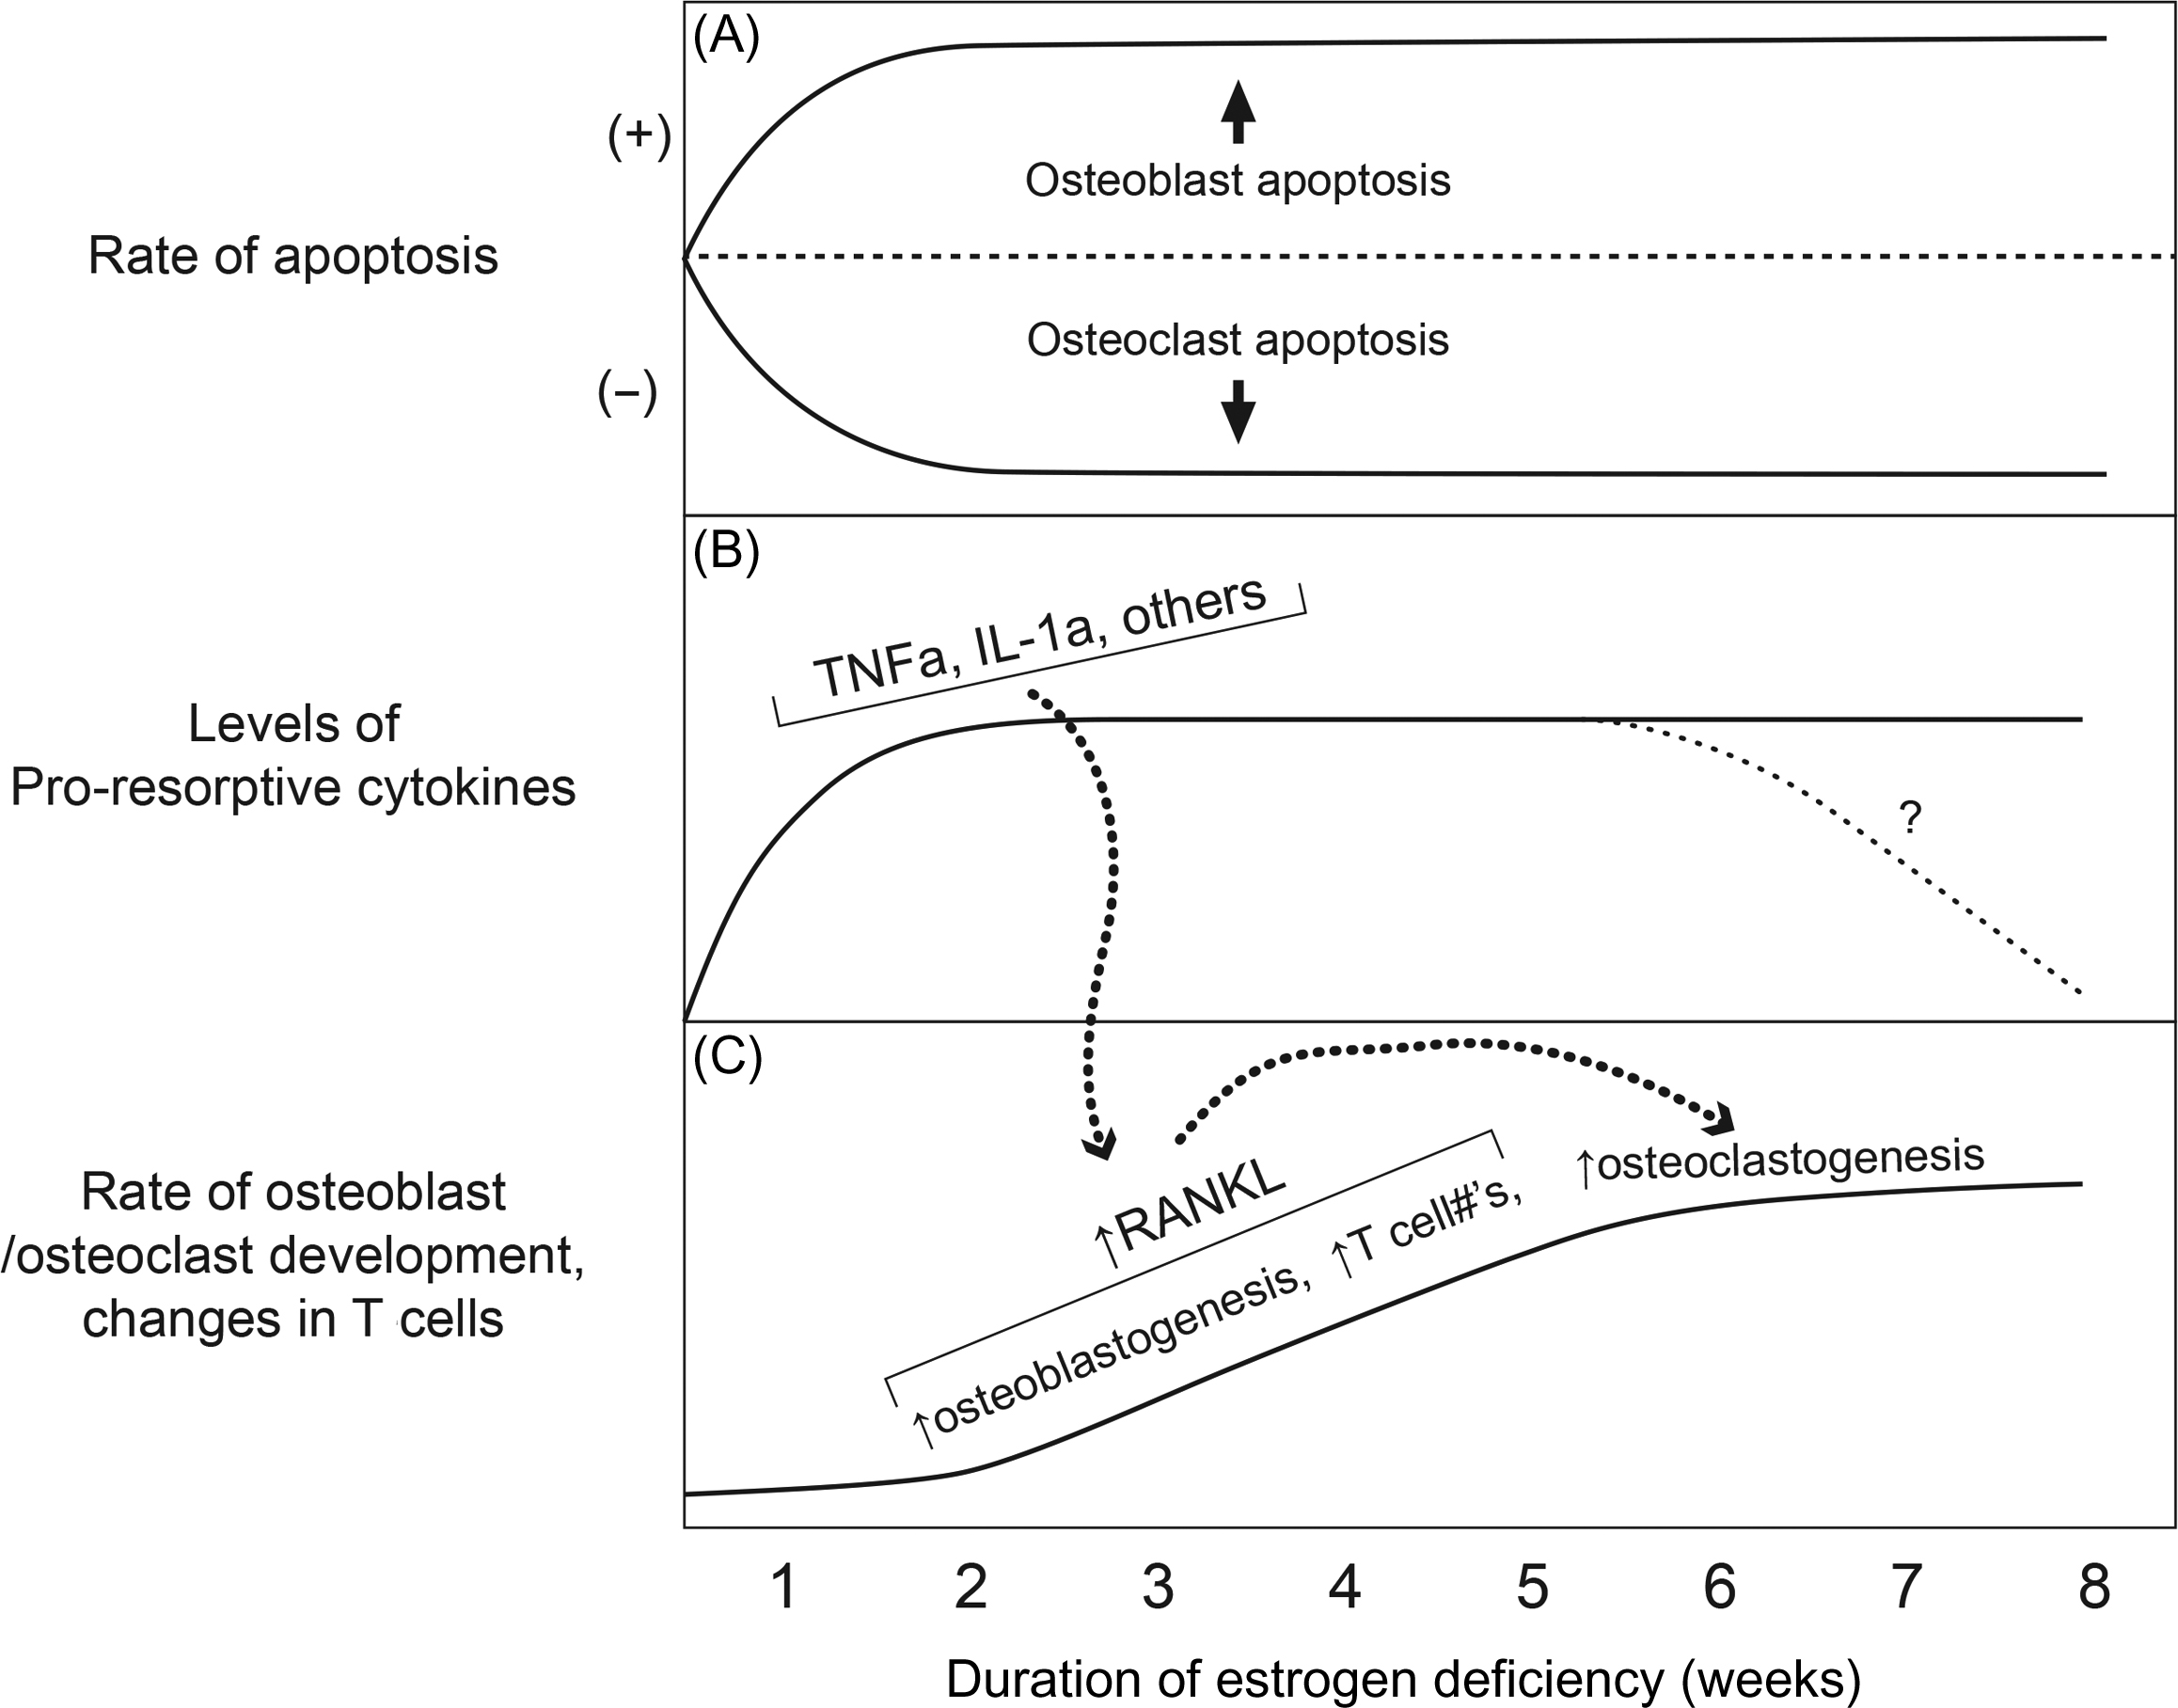
A full description of the pathophysiology of bone loss at menopause is complex and beyond the scope of this chapter. Briefly, the estrogen deficiency associated with menopause increases bone remodeling leading to an imbalance between bone formation and bone resorption. Khosla has developed a working model of changes after acute estrogen deficiency ( Fig. 24.1 ). Estrogen stimulates osteoclast apoptosis and suppresses osteoblast and osteocyte apoptosis. This leads to a longer life span of osteoclasts and shorter one for osteoblasts. Estrogen opposes the action of proinflammatory cytokines, such as, interleukin-6 and tumor necrosis factor α. With the estrogen deficiency of menopause, the activity of these proinflammatory cytokines increases and the rise in these cytokines enriches the pool of osteoclast precursor cells increasing the development, activity, and life span of receptor activator of nuclear factor kappaB ligand (RANKL), a key regulator of osteoclastogenesis. The end result of these physiologic changes is a loss of bone increased activation frequency with greater resorption than formation leading to a loss of bone .
24.4
Changes in bone density across menopause
24.4.1
Cross-sectional studies
Early cross-sectional studies described lower bone mineral density (BMD) by single- or dual-photon absorptiometry (SPA, DPA, respectively) among perimenopausal and postmenopausal women compared to premenopausal women . One cross-sectional study used conventional DXA and noted a lower lumbar spine (LS) BMD around age 50–51 years, the mean age at menopause . However, these cross-sectional studies cannot determine the time during the transition when bone loss occurs or the rate of bone loss at various stages of the transition.
24.4.2
Longitudinal studies
Early longitudinal studies of menopausal changes in BMD are summarized in Table 24.1 . The first longitudinal study was published in 1986 and characterized bone loss at menopause in 139 women aged 20–80 years . Over the 2-year follow-up, women who remained premenopausal increased BMD at the radial shaft by 0.5% but experienced a 1.4% loss at the LS. Women who transitioned through menopause lost about 1% BMD per year at both the radius and spine. This first paper suggested that bone loss does indeed begin before menopause, especially at trabecular-rich BMD sites.
| Author | Study population | Classification | BMD measure | Results |
|---|---|---|---|---|
| Riggs et al. |
|
|
|
|
| Slemenda et al. |
|
|
|
|
| Pouilles et al. |
|
| Lumbar spine BMD by DPA |
|
| Sowers et al. |
|
|
|
|
| Recker et al. |
|
| Spine, hip, and TBBM by DPA then DXA |
|
| Ahlborg et al. |
|
|
|
|
| Bainbridge et al. |
|
| BMD by DXA |
|
| Guthrie et al. |
|
| BMD by DXA |
|
Slemenda et al. was the first to differentiate between the early and late perimenopausal and postmenopausal periods. Results suggested that bone loss began in the late perimenopausal period and continued through the early and late postmenopausal period. Both estrone and estradiol (E2) concentrations were correlated with rates of bone loss. This study was the first to include a marker of bone turnover “bone gla protein,” now known as osteocalcin, and showed that the association between E2 and rates of bone loss was attenuated in models with osteocalcin suggesting that a portion of the effect of estrogen on rates of bone loss was mediated by bone turnover.
Other early longitudinal studies demonstrated greater bone loss in the perimenopausal period compared to the postmenopausal period . Ahlborg et al.’s and Recker et al.’s studies were the first to define menopause retrospectively as time since FMP. Follow-up for these studies was extensive, 16 years and 8 years , respectively. Both studies showed that the rate of bone loss was greatest in the early postmenopausal period and tapered off more than 5 years after menopause. Recker et al. estimated that the largest proportion of the bone loss was estrogen dependent with a very small proportion due to aging .
The Melbourne Women’s Midlife Health Project is a prospective study of 438 Australian women aged 45–55 years. DXA was measured annually for 9 years. There were modest changes in BMD in the pre- to early perimenopausal period in both the hip and spine but increased two- to threefold in the late peri- to postmenopausal period .
The Michigan Bone Health Study enrolled 583 women who were aged 24–44 years at baseline in 1992–93. The sampling frame was the historical family records of the Tecumseh Michigan Community Health Study. BMD was measured annually by DXA. Two reports from this study have been published with 4 years or 6 years of follow-up. After 4 years, there was little evidence of bone loss at the LS. The loss was greater at the FN, especially, among perimenopausal women. After 6 years, greater loss was reported for postmenopausal women but loss is expressed as “percentage of a Z -score” and hence, difficult to interpret.
Insights from these early longitudinal studies suggested little bone loss in early perimenopausal women with rates accelerating in the late perimenopausal period. Rates of bone loss appeared to slow several years after the FMP. However, these studies are limited by small sample sizes, short duration, variations in definitions of menopause status, use of old less precise BMD technologies, or changes in measurement techniques over time.
All of the previous studies analyzed rates of change in areal BMD (aBMD), which may be confounded by bone size and represents an integrated measure of trabecular and cortical BMD. To our knowledge, two studies quantified rates of bone loss over 5 years using QCT of the spine. In one study of 85 Japanese women that also included peripheral QCT (pQCT), rates of bone loss appeared greater for volumetric BMD (vBMD) of the spine, radius, and tibia compared with DXA. For example, the annual percentage of bone loss was 5.5% at the spine measured by QCT compared to 2.6% at the spine measured by DXA, in perimenopausal women. The faster rate of LS bone loss by QCT likely reflects the dominance of trabecular vBMD at this site. A smaller study from Germany followed 34 women who were pre-, peri-, and early postmenopausal for up to 6 years. Women who were premenopausal or perimenopausal at baseline and transitioned through menopause lost the greatest vBMD, but the number of women was small .
24.5
Bone structure/size changes
Paired transilial biopsies specimens were obtained from 38 women premenopausally and 12 months after their last menstrual period . Bone volume fraction (−13%), trabecular number (−9%), apparent (−10%), and tissue volumetric density (−1%) declined significantly after menopause. In addition, trabecular spacing (+7%) and the structural model index (conversion of trabecular plate to rod-like structure) increased (1.2-fold) in the transmenopausal period ( Table 24.2 ). No significant changes in the trabecular thickness, connectivity density, or the average cortical thickness were observed in the transmenopausal period. However, trabecular connectivity density showed a trend toward increases during the transmenopausal period. These results demonstrate that trabecular bone structure declines at menopause and likely contributes to increased bone fragility with age.
| Mean±SD | Premenopausal | Postmenopausal |
|---|---|---|
| BV/TV% | 31.0±7.5 | 27.0±7.4 a |
| Tb.N/mm | 1.74±0.37 | 1.59±0.172 a |
| Tb.Th (mm) | 0.21±0.05 | 0.2±0.05 |
| Tb.S (mm) | 0.56±0.08 | 0.60±0.07 a |
| Conn.D | 5.15±1.5 | 5.46±1.5 b |
| SMI | 0.157±0.642 | 0.353±0.64 a |
| App.D (g/cm 3 ) | 294±58 | 264±58 a |
| Tiss.D (g/cm 3 ) | 744±18 | 737±19 a |
| Average cortical thickness (mm) | 0.95±0.26 | 0.95±0.24 |
Stay updated, free articles. Join our Telegram channel

Full access? Get Clinical Tree


