Initial observational studies of the natural history of breast cancer (untreated) viewed all breast cancers as the same, causing death a median of 2.7 years after presentation.1 Similarly, initial treatment trials2-4 viewed breast cancer as a homogeneous disease with no consideration of possible biological differences. Fortunately, in the 1960s, breast cancer heterogeneity was beginning to be recognized and included such factors as tumor size, the number of tumor-involved lymph nodes,5-7 and later the influence of estrogen receptor (ER) and progesterone receptor (PR).8-10
This progress in understanding the heterogeneity of breast cancer has accelerated in the past 2 decades. Another example of this heterogeneity is the human epidermal growth receptor 2 (HER-2) and its correlation with relapse and survival.11,12 Approximately 20% of tumors have high levels of HER-2 expression (3+ by immunohistochemical staining or an amplified HER-2 gene number copy by fluorescence in situ hybridization). HER-2 represents an important prognostic factor because it identifies patients who may benefit from HER-2-directed therapy.13-15 Most recently, gene expression studies have identified several major subtypes of breast cancer16: the luminal subtypes, which typically express hormone receptor (HR)-related genes, and 2 HR-negative subtypes, the HER-2+/ER− subtype and the basal-like subtype. Prognosis varies by subtype, with worse outcomes traditionally seen with the 2 HR-negative subgroups compared to the luminal subgroups.17-19 “Triple-negative” breast cancer (phenotypically ER, PR, and HER-2 negative) have an early aggressive clinical course when compared with other forms of breast cancer, but the effect appears transient.
Initially, the heterogeneity of breast cancer was defined by light microscopy histologic differences with hematoxylin and eosin (H&E) stains and then specific immunostains. Moving beyond conventional light microscopy and basic histology, gene expression microarrays attempt to identify which genes are overexpressed or underexpressed in a given breast cancer specimen as compared with normal controls.
From breast cancer specimens, sets of DNA sequences are immobilized on solid substrates. Genes of interest are labeled and hybridization to the array occurs. After a period of time, an image of the array is obtained showing the individual nucleic acid species based on the amount of hybridization to complementary DNAs in known positions on the array. Different fluorescent dyes are used to quantify the relative abundance of a particular gene; the ratio of the intensities of 2 fluorescent dyes provides this answer. This allows researchers to examine and compare genes under varying conditions, that is, to know when and where a gene is expressed.20,21
Clustering of breast cancers according to their intrinsic gene expression patterns by gene expression array profiling studies on breast tumors reveal at least 5 intrinsic subtypes: 16-19 luminal A and B, HER-2+/ER-negative, normal breast-like, basal-like, and potentially a “claudin-low” subtype (low expression of luminal and cell-cell junction proteins)22 (Fig. 83-1). This technology has illustrated that “breast cancer” represents a group of biologically distinct diseases. The “luminal” subtypes are named because of their similarity in gene expression pattern to the luminal epithelial component of the breast. Luminal A and B are both ER and PR positive, but luminal A tumors are more likely to be lower grade, have lower proliferative indices, higher expression of ER genes, and a lower chance of HER-2 overexpression. The HER-2+/ER-negative subtype is characterized by the overexpression of HER-2 and the lack of ER genes. The basal subtype typically is “triple negative,” or ER, PR, and HER-2 negative, but these terms are not complete synonyms because 20% of basal tumors are not triple negative (although 91% of triple-negative cancers have basal-like gene expressions).23 These breast cancer subtypes are highly reproducible,17-19 are concordant between the primary tumor and the metastasis,24 are found in the preneoplastic lesion ductal carcinoma in situ,25 and persist before and after therapy.
Figure 83-1
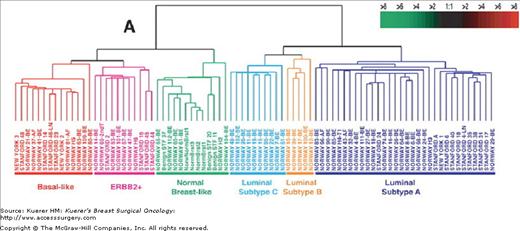
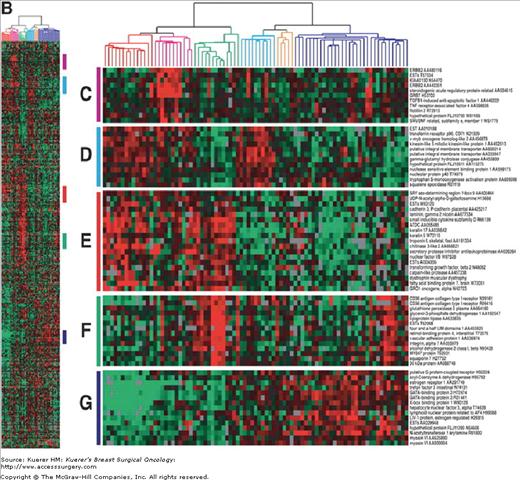
Gene expression patterns of 85 experimental samples representing 78 carcinomas, 3 benign tumors, and 4 normal tissues, analyzed by hierarchical clustering using the 476cDNA intrinsic clone set. (Reproduced, with permission, from Sørlie T, Perou CM, Tibshirani R, et al. Proc Natl Acad Sci USA. 2001;98:10869-10874.)
Although they are the gold standard to identify breast cancer subgroups, RNA-based microarrays are not suitable for routine use in clinical environments for both technical reasons and the need for frozen tumors. However, these gene expression analyses have helped explain the genetic heterogeneity of breast cancer and have caused a shift in planning treatment trials for breast cancer for specific subtypes.
One of the most important contributions seen from this molecular breast cancer classification system is identifying the poor prognostic basal subtype. The initial studies examining outcome by intrinsic subtype uniformly found a poor prognosis in basal breast cancer.17,19 In population-based studies such as the Carolina Breast Cancer Study, the triple-negative phenotype demonstrated reduced breast cancer–specific survival compared with luminal phenotypes as predicted by the early translational studies.26 In a single institution cohort study involving more than1600 patients, triple-negative breast cancer had an increased likelihood of distant recurrence (hazard ratio 2.6, 95% confidence interval [CI], 2-3.5) and death (hazard ratio 3.2, 95% CI 2.3-4.5) within 5 years of diagnosis, but not after 5 years because the peak of distance recurrence peaked at 3 years.27 Another study also showed a difference in overall survival between triple-negative and non-triple-negative cancers that was most obvious at 3 years and decreased to no difference at 10 years.28
Oncotype DX Recurrence Score (Genomic Health, Inc; Redwood City, California) is a 21-gene breast cancer assay that predicts the 10-year distant recurrence risk and benefit to adjuvant chemotherapy in node-negative/HR-positive disease treated with tamoxifen. In 2001, the Genomic Health Company developed a reverse transcriptase polymerase chain reaction method for paraffin block tissues. Model-building studies using data from 447 breast cancer cases, including 233 cases from NSABP B-20, were used to select the 21-gene assay. The 21-gene assay has been validated for women with early stage, lymph node–negative, ER-positive breast cancers using available paraffin blocks from the National Surgical Adjuvant Breast and Bowel Project (NSABP) B-14 and the Kaiser Permanente Study.29
To determine an individual patient’s risk for recurrence, a fixed paraffin-embedded tumor block or six 10-μm sections and 1 H&E slide are submitted to Genomic Health for analysis. The 21-gene assay is performed. Results are reported using a numeric recurrence score (RS) from 0 to 100. The RS is used to predict the average rate of distant recurrence at 10 years. Recurrence Scores are subdivided into low-, intermediate-, and high-risk groups (Table 83-1).29
| Risk Category | Recurrence Score | Patients, % | 10-yr Rate of Distant Recurrence (95% CI) |
|---|---|---|---|
| Low | <18 | 51 | 7%* (4.0–10) |
| Intermediate | 18–30 | 22 | 14% (8–20) |
| High | ≥31 | 27 | 31%* (24–37) |
The recurrence score also has a correlation with magnitude of chemotherapy benefit. For patients with high-risk recurrence scores (RS ≥ 31), there was 28% absolute benefit from a combination of tamoxifen and chemotherapy (relative risk: 0.26; 95% CI, 0.13-0.53).30 In the low recurrence score group, there was no clear reduction in distant recurrence at 10 years (relative risk: 1.31; 95% CI, 0.46-3.78; increase of 1% in absolute risk). The benefit of chemotherapy in the intermediate recurrence score group was less clear (relative risk: 0.61; 95% CI, 0.24-1.59; increase of 2% in absolute risk).30
Because of this uncertainty, this group is the subject of further study. The TAILORx (Trial Assigning Individualized Options for Treatment) breast cancer trial is designed to determine whether adjuvant hormonal therapy alone is as effective as adjuvant hormonal therapy in combination with chemotherapy for certain women with breast cancer. Eligibility criteria include women with ER-positive and/or PR-positive, HER-2/neu negative breast cancer who are lymph node negative. The primary study group is women with recurrence scores between 11 and 25. These patients are randomized to receive adjuvant hormonal therapy alone or adjuvant chemotherapy in combination with hormonal therapy. This study was activated in 2006, and the accrual goal is approximately 10,000 patients.31
MammaPrint is a 70-gene assay that uses molecular technology to determine the likelihood of distant recurrence within 5 to 10 years after initial diagnosis for node-negative disease in women 60 years of age or less. MammaPrint was developed by the Agendia Company located in Amsterdam, Netherlands. Investigators from the Netherlands Cancer Institute in Amsterdam (NKI) studied a core set of 70 genes that were found to be significantly associated with distant metastasis at 10 years.32 The 70-gene assay has been on the market in Europe since 2005 and was cleared by the Food and Drug Administration for use in the United States in 2007. It has been independently validated for breast cancer patients with the following criteria: age less than 61 years, tumor size smaller than 5.0 cm, lymph node negative, and ER-positive status. This test should be limited to lymph node negative stage 1 or stage 2 patients.33
To perform a test, a MammaPrint Specimen Collection and Transportation Kit should be obtained. The 3-mm punch biopsy device from the kit is used to a fresh specimen for analysis from the surgical specimen within 1 hour of surgery. The tumor biopsy is placed in preservative solution to avoid RNA degradation. The biopsy specimen is then shipped to an Agendia laboratory for analysis. Upon receipt, each specimen is reviewed for histology and RNA quality. A specimen is rejected if there are less than 30% tumor cells histologically. The expression of 70 preselected genes is determined using DNA microarray technology. The data is analyzed using a specific algorithm that determines the MammaPrint Index and the expression profile of the sample as low risk or high risk for distant metastasis.
Tumor samples with a MammaPrint Index above a threshold of 0.4 are low risk. Tumor samples with a MammaPrint Index equal to or smaller than this threshold are classified as high risk. A low- risk patient has a 95% chance of being metastasis-free within the following 5 years (90% within the following 10 years), whereas a high-risk patient has a 78% chance of being metastasis-free within the following 5 years (71% within the following 10 years).32
The Microarray for Node Negative Disease May Avoid Chemotherapy Trial (MINDACT) is a multicenter, prospective, randomized phase III trial with planned accrual of nearly 6000 European breast cancer patients. The primary objective of MINDACT is to expand the 70-gene indication through identification and validation of novel gene expression signatures that can predict clinical response to chemotherapy and endocrine therapy.
Two other prognostic profiles have been studied in the literature but are not currently recommended for clinical use. The 76-gene prognostic profile for node-negative disease risk-stratifies patients into a good or poor profile group for risk of early distant metastasis. It has been validated in several studies and has shown similar prognostic performance to the 70-gene assay.34-36 A 2-gene ratio has been validated in node-negative, ER-positive patients treated with adjuvant tamoxifen monotherapy.37-39 Homeobox gene 13 (HOXB13) and interleukin 17B receptor (IL17BR) were analyzed as a ratio HOXB13:IL17BR (marketed as H/I; AvariaDx; Carlsbad, California), and the studies have shown that the higher the ratio, the worse the relapse-free survival, disease-free survival, and overall survival.37-40
Several clinically useful prognostic indices incorporating relevant clinical information have been developed. These include the Nottingham Prognostic Index, the St. Gallen’s risk categories, and a Web-based model, Adjuvant! online. Currently, neither the National Comprehensive Cancer Network (NCCN) nor the American Society of Clinical Oncology (ASCO) have guidelines regarding the use of these prognostic indices.
The Nottingham Prognostic Index (NPI) is calculated using tumor grade (1-3) plus lymph node stage (1-3) plus maximum tumor diameter (centimeters multiplied by 0.2) giving a range from 2.08 (no lymph nodes, grade 1, size 0.4 cm) to 6.8 (nodal stage 3, grade 3, size 4.9 cm).41 It has been prospectively validated and is applicable to all operable breast cancers.42-47 The NPI can be divided into 6 groups: excellent (2.08-2.4), good (2.42-≤3.4), moderate I (3.42-≤4.4), moderate II (4.42-≤5.4), poor (5.42-≤6.4), and very poor (6.5-6.8), with the 10-year breast cancer specific survivals 96%, 93%, 81%, 74%, 50%, and 38%, respectively.48
The St. Gallen’s consensus meeting updated its risk stratification criteria in 2005, continuing to place patients into low-, intermediate-, or high-risk categories. Low-risk includes node negative and the tumor 2 cm or larger, grade 1, no peritumoral vascular invasion, HER-2 negative, and patient 35 years or more. Intermediate-risk includes node negative and the tumor larger than 2 cm, or grade 2 to 3, or peritumoral vascular invasion, or HER-2+, or age less than 35 years, or node positive (1-3) and HER-2 negative. High-risk includes 1 to 3 positive nodes and HER-2+ or 4 or more positive nodes.49 In an independent retrospective validation, this risk categorization had high prognostic value. The 5-year distant disease-free survivals for the low-, intermediate-, and high-risk groups were 100%, 92%, and 72%, respectively (p < 0.00005).50
To help physicians and their patients make treatment decisions and understand prognosis, Adjuvant! (www.adjuvantonline.com) was designed to estimate objectively the benefit of adjuvant systemic therapy for individual breast cancer patients.51,52 Adjuvant! includes patient age, comorbid conditions, tumor grade, HR status, tumor size, and the number of involved lymph nodes. The estimates of benefit on Adjuvant! were derived from estimating a patient’s risk of a negative event (death or relapse) and then multiplying that by the proportion of negative events that a given adjuvant therapy will prevent. The Surveillance, Epidemiology, and End Results (SEER) registry estimates of outcome for breast cancer in the United States were used for estimates of prognosis. Efficacy estimates of adjuvant tamoxifen and chemotherapy were initially derived from the Early Breast Cancer Trialists’ Collaborative Group 1998 meta-analysis data and then updated with the 2000 Overview Analysis of Randomized Adjuvant Tamoxifen and Chemotherapy Breast Cancer Trials.53-55 The efficacy of combined endocrine and chemotherapy was developed from the product of the individual risk reductions from endocrine therapy and chemotherapy alone.52
On the main screen of Adjuvant! the physician enters patient information: age, comorbidity status, ER status, histologic grade, tumor size, positive nodes, and adjuvant therapy option. An option exists for adjustments to a “prognostic factor impact calculator” where the user enters the relative risk of the high-risk group versus the low-risk group and the percentage of patients in the high-risk group. Adjuvant! does not make projections based on HER-2 status or the use of trastuzumab. The physician is able to print for the patient the 10-year risk of recurrence and overall survival graphs with risk reduction estimates with endocrine therapy, chemotherapy, and combined therapy.
Adjuvant! has been validated based on comparison of predicted overall survival (OS), breast cancer–specific survival (BCSS), and event-free survival (EFS) estimates with observed outcomes for 4083 British Columbian women with stage I or II breast cancer. The 10-year predicted and observed outcomes were within 1% for OS, BCSS, and EFS (p > 0.05) across all patients. In subgroup analysis, Adjuvant! overestimated OS, BCSS, and EFS in women less than 35 years of age or with lymphatic or vascular invasion (LVI), for these 2 factors are not automatically incorporated into the Adjuvant! calculation. When the prognostic factor impact calculator was adjusted for the distribution of LVI, the predicted and observed outcomes were not significantly different.56 Adjuvant! is an important tool for physician-patient communication regarding probability.
Stay updated, free articles. Join our Telegram channel

Full access? Get Clinical Tree


