Fig. 27.1
Fourteen-year-old boy with venous malformation. (a, b) CT scan with contrast shows an extensive heterogeneous lesion of the face with infiltration of the masseter, buccal floor, tongue, parapharyngeal region, and mandibular bone. Phlebolith was seen
MRI – The first acquisition has to be done with a wide field of view to assess the extent of the lesion. VM can be seen on every part of the body. On T1-weighted images, VM is hypointense or isointense compared to the muscle. They may present with a heterogeneous or intermediate signal secondary to thrombosis or hemorrhage. Absence of flow void is mandatory for the diagnosis of VM. On fat-sat T2-weighted sequences, high-signal intensity is observed. Sometimes, low-signal intensity is related to thrombosis or phleboliths. Fat suppression with short TI (inversion time) inversion recovery (STIR) T2-weighted sequence with a 512 matrix is well suited for this purpose. T2-weighted gradient-echo sequences can also be used to demonstrate calcifications or hemosiderin. On gradient-echo sequences, the absence of signal in the blood vessel in the vicinity of the malformation suggests a slow-flow malformation. Fluid-fluid level can be seen in regions of low or no flow.
FSE T1-weighted sequences with fat suppression should be performed after gadolinium injection to evaluate the perfusion of the malformation. Heterogeneous enhancement is seen after injection of gadolinium. MRI may also demonstrate soft tissue changes related to the VM, such as fatty replacement, atrophy of the adjacent musculature, or hypertrophy of the subcutaneous fat compared with the contralateral side [7].
To evaluate the dynamics of the VM, we perform a dynamic perfusion study 1, 2, 5, and 10 min after contrast infusion using a 3D ultrafast spoiled gradient-echo acquisition (volumetric interpolated breath-hold examination (VIBE) sequence). These contrast-enhanced 3D acquisitions are also useful to appreciate the drainage of the malformation in the venous system [1, 8].
On 3D contrast-enhanced MRA, the lesions and their drainage into the systemic venous system can be mapped and should be documented on the report. The absence of deep venous system can be a contraindication for sclerosing treatment in some complex cases (Figs. 27.2, 27.3, and 27.4).
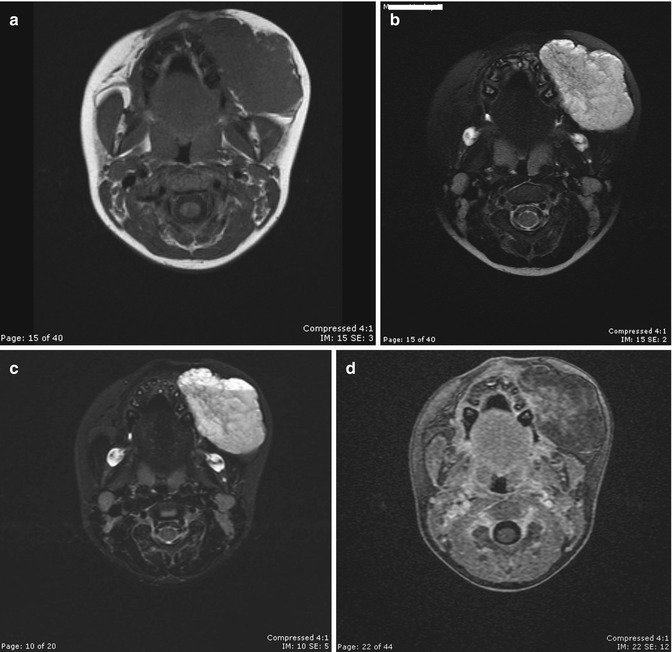
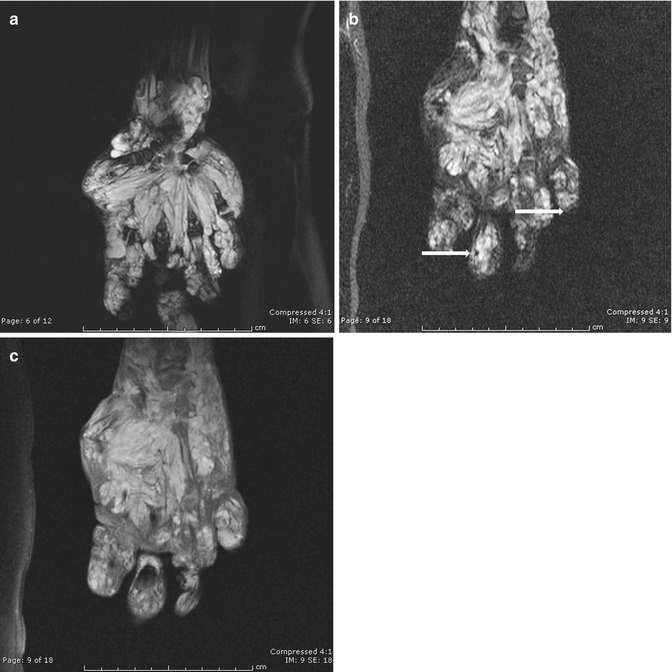
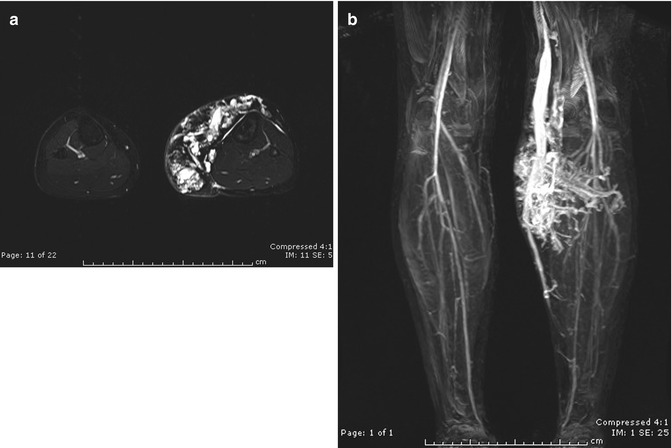
Fig. 27.2
Five-year-old girl with cheek venous malformation. (a) Axial T1-weighted image shows an isodense lesion of the left cheek. (b) Axial fast SE T2-weighted fat-suppressed image demonstrates a well-defined hyperintense lesion without perilesional edema. (c) STIR images show hyperintense lesion with small signal voids (phleboliths). (d) Dynamic VIBE acquisition was performed. At 10 min, heterogeneous filling of the malformation by gadolinium was seen
Fig. 27.3
Four-year-old girl with an extensive venous malformation of the hand. (a) Coronal axial T2 fat-suppressed image reveals a hyperintense signal of a significant infiltrative lesion of the muscle tendon of the hand. (b) STIR image shows the presence of hyperintense lesion with multiple phleboliths (arrows), seen as a signal void in the lesion. (c) Delayed contrast-enhanced fat-suppressed VIBE T1-weighted image shows diffuse enhancement of the venous malformation
Fig. 27.4
Eighteen-year-old female with Klippel-Trénaunay syndrome. (a) Axial T2-weighted image demonstrates numerous hyperintense vessels in the subcutaneous fat. (b) Coronal contrast VIBE sub mip image shows numerous abnormal veins draining in a medial marginal vein. The deep venous system is normal
Arteriovenous Malformations
Arteriovenous malformations (AVMs) are isolated anomalies or are part of a syndrome, such as Parkes Weber or Rendu-Osler-Weber.
On CT scan, AVMs appear as highly enhancing lesions with numerous feeding and draining vessels, without persistent tissue staining (Fig. 27.5).
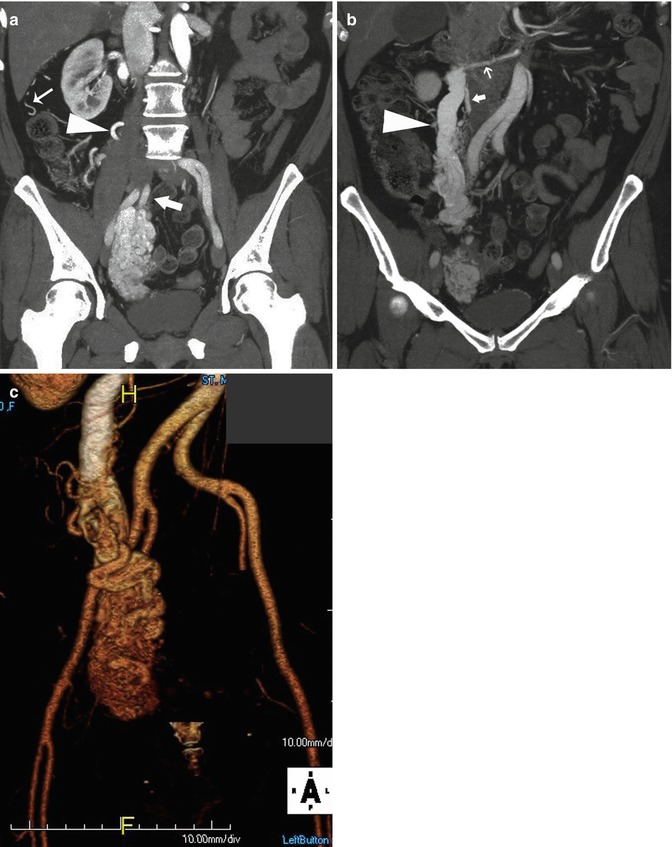
Fig. 27.5


Patient presenting a pelvic AVM involving the right ovary and parameter. (a) Coronal reformation of a CTA in arterial phase showing the large AVM and the contribution of the right internal iliac artery (large arrow). Contributions of an enlarged right ovarian artery (arrowhead) and renal capsular arteries (small arrow) can be seen. (b) A large ovarian vein (arrowhead) draining the AVM is observed on a posterior coronal reformation. The proximal portion of the enlarged ovarian artery (large arrow) arising from an accessory renal artery (small arrow) is also demonstrated. (c) The extension and 3D anatomy of the AVM are well seen on this volume rendering reformation
Related posts:

Stay updated, free articles. Join our Telegram channel
Full access? Get Clinical Tree
