Radiologic Imaging of Renal Cell Carcinoma: Its Role in Diagnosis
Peter L. Choyke
INTRODUCTION
Imaging plays a major role in the diagnosis and management of renal cancer. Advances in imaging technology have resulted in uniformly high-quality scans that, in turn, result in the detection of small renal masses hitherto unrecognized. Because these tumors tend to be low grade, their detection has improved the apparent overall cure rate from renal cancer. It has also added to the burden of deciding whether particular lesions require follow-up or intervention. This chapter reviews the technical aspects of current imaging modalities, computed tomography (CT), magnetic imaging, ultrasound, and positron emission tomography (PET). The chapter also discusses the role of imaging in detecting and classifying cystic and solid lesions as well as approaches to small renal masses. Finally, percutaneous image-guided therapies, radiofrequency ablation (RFA), and cryotherapy are discussed.
IMAGING MODALITIES
Computed Tomography
Among the imaging modalities in clinical use, CT ranks first as the most reliable method for detecting and staging renal cancers. CT is now performed with multidetector helical CT scans instead of the older slice by slice mode. In the helical mode, the patient moves continuously while the x-ray tube subtends a circle around the patient. Multiple rows of detectors (hence “multidetector”) receive x-rays during each pass of the tube. Two major implications of this are increased speed of scanning and the routine acquisition of three dimensional datasets (Fig. 42.1). This means that CT data are more readily reformatted in the coronal or sagittal planes without the jagged edges that accompanied 2D acquisitions (Fig. 42.2). The development of multiple detector CT scanners with 4 to 256 rows of detectors has dramatically increased the speed of CT (1).
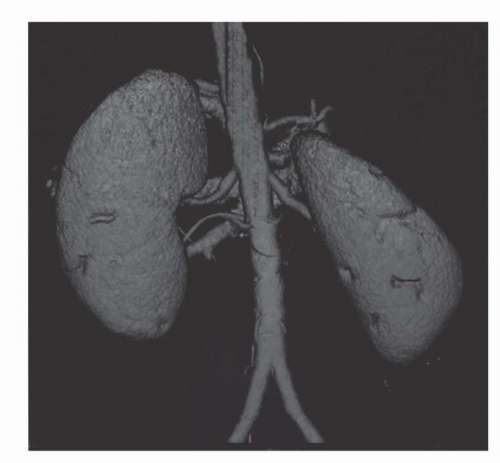 FIGURE 42.1. Three-dimensional volume rendering of the kidneys from a high-resolution CT of the kidneys made possible by helical acquisition of the data. Note that an accessory right renal artery is seen. |
Contrast media is a vital part of the CT examination for renal imaging. Typically, a nonionic iodinated contrast media is given to the patient through a 20G intravenous line at 3 mL/s using a mechanical injector. Nonionic contrast has much fewer side effects (nausea, vomiting, anaphylactoid reactions) than ionic contrast media (2). It is also less nephrotoxic (3). Patients with prior history of allergy to contrast media should be given prophylaxis consisting of a steroid preparation and antihistamine prior to injection (2). Patients with compromised renal function should be well hydrated and any nephrotoxic drugs should be discontinued (3,4). There is some evidence that N-acetyl cysteine given orally prior to and after contrast administration reduces contrast-induced nephrotoxicity, but hydration is generally considered more important in reducing nephrotoxicity (5,6). It is unclear whether a “cutoff” value of serum Creatinine for administering intravenous iodinated contrast exists, but most centers use a value between 1.7 and 2.0 mg/dL. Creatinine clearance or calculated clearance based on race, body weight, and gender (e.g., Cockroft-Gault) may be superior methods of determining a cutoff for administering contrast media. Iodinated contrast media is generally considered safe for effective glomerular filtration rates >30 mL/min. However, patients with risk factors such as hypertension and diabetes are at especially high risk (5,6). It should be emphasized, however, that all patients should be well hydrated prior to receiving intravenous iodinated contrast media and that diabetics are at especially increased risk of contrast nephrotoxicity. Contrast nephrotoxicity generally occurs within 48 hours of the injection and resolves with conservative measures within 7 to 10 days although a small fraction of patients have permanent damage to their renal function.
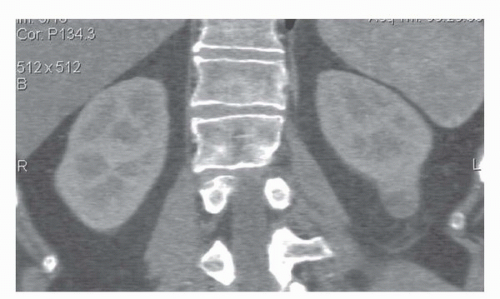 FIGURE 42.2. Coronal reformat of a CT scan. Note that the coronal reformat demonstrates a left lower pole renal cancer without loss of resolution and with no “stair step” artifacts. |
 FIGURE 42.3. Value of arterial phase images. (A) The arterial phase CT image of the left kidney depicts a small cortical cyst relatively easily whereas, (B) the lesion is obscured on delayed phase images. |
Concerns about radiation dosage have, in recent years, limited the amount of scanning that is routinely performed. The ideal CT for renal masses begins with a non-contrast-enhanced (“precontrast”) series of images through the kidney with 2.5 to 5 mm thick slices. It is very important that the same technical factors (slice thickness, milliampere-seconds, kilovoltage, field of view) be used on all images so that changes in density within a lesion can be attributed only to the characteristics of the lesion and not to technique (1). This allows the reliable detection and characterization of renal masses down to about 1 cm in diameter. Below this diameter, it is still possible to characterize lesions as cysts but not unequivocally detect enhancement within a lesion. This is caused by a fundamental limitation of CT known as partial volume averaging. If the slice thickness includes both the lesion and part of the normal renal parenchyma, then the CT density reading is a weighted average of both. In the case of a cyst, this could lead to a falsely high density readings implying that the lesion is enhancing and therefore, is not a cyst. To avoid this, thin slices can be used; however, there are several problems with this approach. First, as the slice thickness decreases, the relative noise increases making the images grainy and causing a wider spread of density measurements. Also, as slice thickness decreases, the radiation dose to the patient (to maintain signal to noise ratios) increases and the number of slices increases, making data management more difficult. Thus, 2.5 to 5 mm is a reasonable compromise for renal imaging, although thinner slices are needed for 3D reconstructions (Fig. 42.1).
 FIGURE 42.4. Value of delayed phase images. (A) The arterial phase CT demonstrates a hyperenhancing renal cancer in the lower pole of the left kidney which is isodense with the renal parenchyma. (B) Delayed phase image demonstrates the tumor to better of advantage as a low-density lesion near the lower pole renal sinus. |
The ideal CT examination for renal masses can be divided into four phases: precontrast, arterial phase (˜25 seconds postinjection), nephrographic (˜90 seconds postinjection), and excretory phase (˜5-7 minutes postinjection). Not all of these phases are necessary in all cases. Indeed, concerns about radiation exposure may lead to limiting scanning to just the most informative phases. Among these, the more important are the precontrast and nephrographic phases.
During the arterial phase, the cortex is brightly enhancing compared to the medulla (Fig. 42.3). This phase is most useful for identifying the renal arteries and for hypervascular masses, especially small ones that may be more difficult to see on later images (7). A limitation of the arterial phase image, however, is that hyperenhancing lesions may be lost in the bright background of the hyperenhancing cortex (7) (Fig. 42.4).
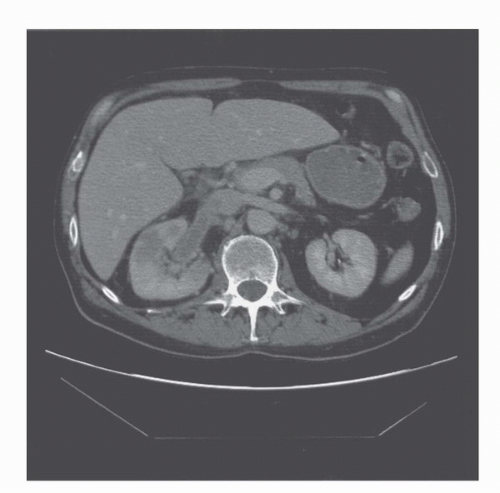 FIGURE 42.5. Right renal vein tumor thrombus depicted on CT. This early phase CT demonstrates part of a right renal tumor as well as a filling defect within the right renal vein extending into the inferior vena cava. The nephrographic phases of CT are better suited to the task of detecting venous thrombus than are later phases when the intensity of contrast within the veins is diminished. |
The nephrographic phase is generally the most useful for detecting renal lesions because the normal renal parenchyma is uniformly enhanced, yet there is still no excretion within the collecting system to interfere with the image. As a consequence, tumors generally appear low in density compared to the normal parenchyma. Highly vascular tumors, however, may be masked by the relatively high-density normal parenchyma. This phase also offers uniform enhancement of the veins making it the best time point for assessing renal vein and inferior vena cava thrombus arising from a tumor (Fig. 42.5). This phase has the highest sensitivity and specificity for renal masses (Fig. 42.6). Direct coronal and sagittal reconstructions have been particularly useful in identifying vessels, thrombi, and anatomic relationships between the renal cancer and adjacent structures.
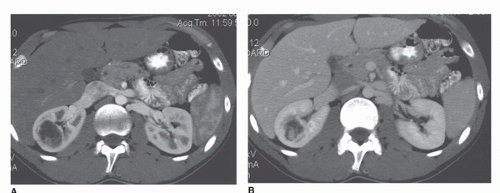 FIGURE 42.6. Complex cystic renal cancer depicted on nephrographic phase CT. (A) Early phase CT demonstrates a cystic lesion in the right kidney with minimal enhancement. (B) Nephrographic phase CT demonstrates clear filling in of the lesion with central and mural enhancement which is indicative of a cystic renal cancer. |
The excretory phase is obtained at least about 5 to 7 minutes after injection at a time when the kidney has excreted a large amount of the contrast into the urinary tract. In some cases, furosemide (5-20 mg Lasix) is administered to induce a diuresis, which distends the ureters. As a consequence, assessment of collecting system and renal pelvic involvement by a tumor can be made most easily (8,9) (Fig. 42.7). For hematuria workups, this phase offers the possibility of examining the urothelial tract for tumors as well. In fact, a technique known as “CT Urography” has become the de facto standard for hematuria workups. In CT Urography, a precontrast scan is obtained from above the kidneys to below the bladder to evaluate for stones. Following this, a nephrographic phase CT is obtained through the kidneys. Finally, the patient is turned prone (or given low doses of Lasix), and thin-section CT is obtained on delayed scans from above the kidney to below the bladder to evaluate the ureters and bladder. If the patient is well hydrated, excellent opacification of the ureters is seen and small filling defects indicative of urothelial tumors can be readily detected.
The unit of density measurement in CT is the Hounsfield unit (HU) in honor of Sir Godfrey Hounsfield, the inventor of the first CT device. The Hounsfield scale runs from −1,000 to +1,000. Zero HU corresponds to pure water. Fat ranges from −100 to −20 HU, while the normal unenhanced renal parenchyma is 25 to 35 HU (Fig. 42.5). Renal stones are usually >100 HU and air usually is < −500 HU. The HU scale is clinically important because it is used to judge the degree of enhancement, a surrogate for the presence of tumor. Changes of <10 HU are not considered significant and indicate that the lesion is a cyst. Changes in density >20 HU are invariably caused by tumors. Changes in density between 10 and 20 HU must be considered on an individual basis. If the scan is technically optimal and there are no focal morphologic abnormalities within the lesion, the change may be considered abnormal. However, technical artifacts may also be responsible for this apparent enhancement. It should be noted that just as tumors enhance, they also de-enhance. A drop in density on two scans taken at two different times after the same injection (e.g., 1 minute and 2 minutes after intravenous
contrast) has the same significance as enhancement indicating the presence of a tumor. Thus, lesions measuring 0 to 20 HU that do not change density after intravenous contrast are generally considered cysts. After intravenous contrast the density measurements of cysts may rise slightly but usually <10 HU. Why do the values change at all if the cyst is avascular? There are several reasons. First, the surrounding parenchyma usually increases from 25 to 35 HU to well over 150 HU. Even subtle partial volume effects will cause a rise in the apparent density of a cyst. Moreover, because the kidneys and other organs of the body are higher in density after contrast media, the x-ray beam tends to “harden”; that is, the lower energy x-rays are preferentially absorbed by the higher density tissue leaving only the higher energy x-rays to form the image (10,11). This shift in x-ray energy distribution, or “beam hardening,” can cause a slight increase in the density of nonenhancing lesions such as cysts, which is known as “pseudoenhancement”(12,13,14). Streak artifacts arising from very dense contrast in the renal collecting system can also artifactually increase the apparent density of a lesion (Fig. 42.3B).
contrast) has the same significance as enhancement indicating the presence of a tumor. Thus, lesions measuring 0 to 20 HU that do not change density after intravenous contrast are generally considered cysts. After intravenous contrast the density measurements of cysts may rise slightly but usually <10 HU. Why do the values change at all if the cyst is avascular? There are several reasons. First, the surrounding parenchyma usually increases from 25 to 35 HU to well over 150 HU. Even subtle partial volume effects will cause a rise in the apparent density of a cyst. Moreover, because the kidneys and other organs of the body are higher in density after contrast media, the x-ray beam tends to “harden”; that is, the lower energy x-rays are preferentially absorbed by the higher density tissue leaving only the higher energy x-rays to form the image (10,11). This shift in x-ray energy distribution, or “beam hardening,” can cause a slight increase in the density of nonenhancing lesions such as cysts, which is known as “pseudoenhancement”(12,13,14). Streak artifacts arising from very dense contrast in the renal collecting system can also artifactually increase the apparent density of a lesion (Fig. 42.3B).
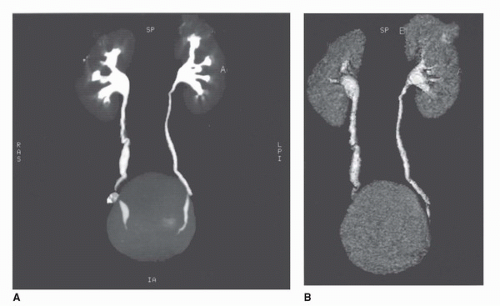 FIGURE 42.7. Excretory phase images obtained 5 minutes after contrast administration. (A) Patient undergoing workup for hematuria demonstrates no filling defects within the collecting system on this coronal reformatted projection image of the ureters. The outpouching in the distal right ureters is due to a sharp turn in the course of the ureters. (B) Patient with upper pole tumor in the left kidney obtained with volume rendering demonstrates that the small tumor has no connection with the collecting system. |
Three dimensional imaging of the kidneys is now possible on most CT scanners. To achieve adequate 3D imaging, 1- to 3-mm overlapping slices are obtained. Overlapping sections allow the computer algorithm to select thin slices that overlap each other by 50%, which, in turn, allows the creation of very smooth 3D volume renderings of the kidney. A 3D rendering obtained during the arterial phase will create a CT angiogram (CTA) that can be used to determine the number and location of renal arterie (15,16) (Fig. 42.8). Renderings from the nephrographic phase can be used to identify a renal mass within the kidney and display it as it would be seen intraoperatively. This can be useful for planning nephron-sparing surgery (17). Finally, 3D renderings during the excretory phase, known as CT Urography or CTU, can display the ureters and collecting system in a manner analogous to the intravenous urogram (9,18,19,20) (Fig. 42.9). It should be noted that CTA, nephrographic phase reconstructions, and CTU studies require additional time and expertise to process and thus are more expensive than conventional CT scans. The ultimate role of these 3D methods, which add some radiation exposure and expense, remains to be determined.
Magnetic Resonance Imaging
Magnetic Resonance Imaging (MRI) has evolved to the point where it can easily substitute for CT when the latter cannot be performed. MRI has the virtue of not subjecting the patient to radiation which is important in patients who will be monitored over a period of years. Moreover, patients with severe allergies to iodinated contrast agents may safely have a contrast-enhanced MRI. Recently, a complication of MRI contrast material has emerged in patients with severe renal dysfunction.
In such patients, it is thought that the prolonged clearance times of the agents lead to dissociation of the Gadolinium ion from its chelate, a process known as transmetallation. Some MR contrast agents are more susceptible to transmetallation than others (21,22,23,24,25). The dissociated Gadolinium ion can cause a severe dermal fibrosis known as nephrogenic systemic fibrosis, which at best is debilitating and at worst can be lethal (21,22,23,24,25). As a consequence, care should be exercised in administering Gadolinium contrast media to patients with severe renal dysfunction (eGFR < 30 mL/min).
In such patients, it is thought that the prolonged clearance times of the agents lead to dissociation of the Gadolinium ion from its chelate, a process known as transmetallation. Some MR contrast agents are more susceptible to transmetallation than others (21,22,23,24,25). The dissociated Gadolinium ion can cause a severe dermal fibrosis known as nephrogenic systemic fibrosis, which at best is debilitating and at worst can be lethal (21,22,23,24,25). As a consequence, care should be exercised in administering Gadolinium contrast media to patients with severe renal dysfunction (eGFR < 30 mL/min).
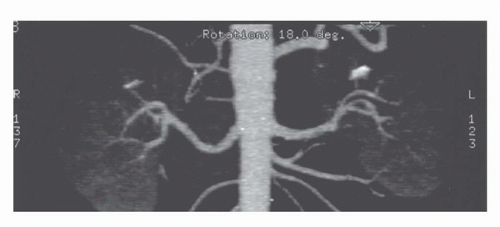 FIGURE 42.8. Maximum intensity projection image of the kidneys obtained during the arterial phase demonstrates a normal CTA. Note that both main renal arteries are easily detected. Other branches arise from the superior mesenteric artery or lumbar arteries and are unrelated to the kidney. |
 FIGURE 42.9. Pre- and postcontrast MRI of the kidney. (A) Precontrast T1-weighted MRI depicts a high signal intensity lesion in the right kidney. This could represent either a hemorrhagic cyst or lipid within an angiomyolipoma. (B) Postgadolinium-enhanced T1-weighted MR with fat saturation demonstrates that the lesion does not enhance and that it does not suppress with fat saturation excluding an angiomyolipoma and confirming a hemorrhagic cyst. |
The MRI examination of the kidney consists of several parts. T1 axial scans are obtained to look for areas of hemorrhage or fat within the kidney, both of which are high in signal on T1-weighted images (Fig. 42.9). Slice thickness is generally 3 to 7 mm. T2-weighted axial or coronal images are highly sensitive for fluid within renal cysts (26). Cysts are typically very high in signal intensity unless they contain hemorrhage or high protein content (Fig. 42.10). Thus, T2-weighted imaging can help identify cysts (Fig. 42.11). Fast T2-weighted scans can be obtained during a breath-hold and are exquisitely sensitive to small amounts of fluid in cysts. Recently, diffusion-weighted MRI has been added as a noncontrast scanning method. This type of MRI sequence relies on the diffusion of water that is high in cystic spaces but low in solid components (27,28). However, the most useful of MRI scan types is the precontrast and postcontrast T1-weighted MRI scans (which is directly analogous to the precontrast and postcontrast CT scan). Precontrast scans and postcontrast scans must
be obtained with the same parameters; otherwise, the MR unit may reset the gain values on the receiver making precontrast and postcontrast comparisons of signal intensity invalid (29). If this happens, it may be impossible to compare the signal obtained from a lesion before and after intravenous contrast. During a typical MR, a low-molecular-weight gadolinium chelate (Gd) is injected as a bolus (0.1 mmol/kg). This can usually be accomplished quickly because of the small volumes of Gds that are required for MRI (10-20 mL). Serial T1-weighted gradient-echo images in the coronal or axial planes are typically obtained during breath-holding (Fig. 42.10). Because there is no ionizing radiation with MRI, the acquisitions can be performed repeatedly without penalty. For practical reasons, we usually scan immediately before, immediately after, and at four additional times at 1 minute intervals (Fig. 42.10). A lesion can then be measured serially at 5 time points to determine whether it changes in enhancement. A“noise floor” of about 15% is accepted, meaning that signal changes within 15% of baseline are not considered “real”(29). It is also useful to evaluate the pattern of enhancement. A pattern characterized by an immediate increase in intensity followed by a slow decline in intensity is highly suggestive of an enhancing neoplasm, whereas a pattern characterized by unpredictable increases and decreases in signal is most likely related to a motion artifact. Subtraction can also be performed (the postcontrast image is subtracted from the precontrast image) to obtain a net enhancement image. In theory, nonenhancing structures should be black on the subtraction image, although changes in position of the kidney may create registration artifacts on the subtracted image.
be obtained with the same parameters; otherwise, the MR unit may reset the gain values on the receiver making precontrast and postcontrast comparisons of signal intensity invalid (29). If this happens, it may be impossible to compare the signal obtained from a lesion before and after intravenous contrast. During a typical MR, a low-molecular-weight gadolinium chelate (Gd) is injected as a bolus (0.1 mmol/kg). This can usually be accomplished quickly because of the small volumes of Gds that are required for MRI (10-20 mL). Serial T1-weighted gradient-echo images in the coronal or axial planes are typically obtained during breath-holding (Fig. 42.10). Because there is no ionizing radiation with MRI, the acquisitions can be performed repeatedly without penalty. For practical reasons, we usually scan immediately before, immediately after, and at four additional times at 1 minute intervals (Fig. 42.10). A lesion can then be measured serially at 5 time points to determine whether it changes in enhancement. A“noise floor” of about 15% is accepted, meaning that signal changes within 15% of baseline are not considered “real”(29). It is also useful to evaluate the pattern of enhancement. A pattern characterized by an immediate increase in intensity followed by a slow decline in intensity is highly suggestive of an enhancing neoplasm, whereas a pattern characterized by unpredictable increases and decreases in signal is most likely related to a motion artifact. Subtraction can also be performed (the postcontrast image is subtracted from the precontrast image) to obtain a net enhancement image. In theory, nonenhancing structures should be black on the subtraction image, although changes in position of the kidney may create registration artifacts on the subtracted image.
 FIGURE 42.10. Benign complex cyst. (A) T2-weighted MRI demonstrates a high signal intensity lesion within the left kidney with a small internal defect. Although not quite as bright as the cerebrospinal fluid seen in the spinal canal, the lesion is nonetheless most consistent with a cyst. (B) Postcontrast-enhanced T1-weighted scan demonstrates no enhancement within the cyst except at two small projections at opposite sides of the lesion. These represent the insertion sites of a septum crossing the lesion which is not visible on the MRI due to lack of enhancement. These findings suggest that this is a simple septated cyst (Bosniak Type II). |
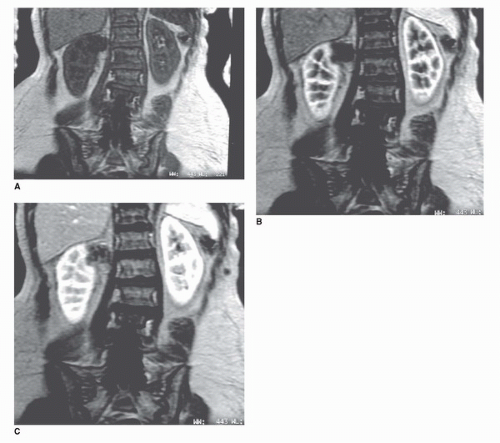 FIGURE 42.11. Serial dynamic-enhanced MRI of an upper pole renal tumor (clear cell carcinoma). (A) Precontrast scan demonstrates no specific findings except for a mass in the right upper pole. (B) Early dynamic-enhanced MRI approximately 1 minute after intravenous contrast administration demonstrates minimal visible enhancement. (C) Delayed dynamic-enhanced MRI approximately 2 minutes after intravenous contrast demonstrates enhancement within the tumor. Serial dynamic MRI is easily performed and there is no “radiation penalty” for repeated imaging. In this case the tumor enhanced 25% over baseline. |
A unique feature of MRI that can be exploited in urologic imaging is its sensitivity for blood flow. A family of techniques known as “bright blood” methods depict normally flowing blood as high in signal. Thus, thrombi within the vein, for instance, will appear as defects within the lumen of the vessel. This technique is very useful for staging renal cancers (Fig. 42.12).
Like CT, MR images can be rendered in 3D. Thus, MR angiography can be used to determine the number and location of renal arteries (15,30). MR venography can assist in localizing the extent of renal vein thrombus and MR urography (MRU) can be used to assess the collecting system and ureters (18,31,32,33). All of these techniques require the administration of intravenous Gd and delays of varying times.
It has been found that the addition of a small amount of Lasix (<20 mg) intravenously results in improved distention of the urothelial tract and thus improved diagnosis when employing MRU (34).
It has been found that the addition of a small amount of Lasix (<20 mg) intravenously results in improved distention of the urothelial tract and thus improved diagnosis when employing MRU (34).
Related posts:
 Androgen Receptor Signaling in Castration-Resistant Prostate Cancer
Management of High Risk Prostate Cancer
Bladder Cancer Staging
Testicular Cancer: Clinical Signs and Symptoms
Late Events and Long-Term Complications After Treatment for Testicular Cancer
Management of Metastatic Renal Cell Carcinoma
Androgen Receptor Signaling in Castration-Resistant Prostate Cancer
Management of High Risk Prostate Cancer
Bladder Cancer Staging
Testicular Cancer: Clinical Signs and Symptoms
Late Events and Long-Term Complications After Treatment for Testicular Cancer
Management of Metastatic Renal Cell Carcinoma
Stay updated, free articles. Join our Telegram channel

Full access? Get Clinical Tree


