Intensity-modulated proton therapy is effective for complex targets
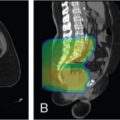
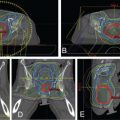
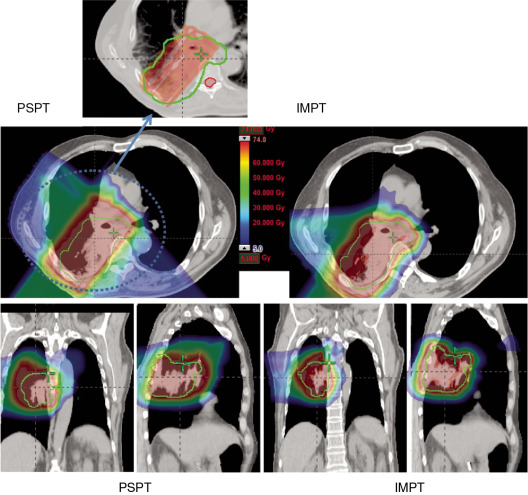
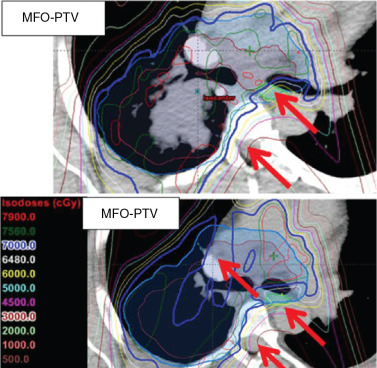
Proton beam therapy (PBT), with its characteristic Bragg peak, holds the promise of further reducing toxicity. Several techniques exist for the administration of PBT, including passive scatter proton therapy (PSPT) and intensity-modulated proton therapy (IMPT). Although PSPT decreases dose distally, we also face a clinical challenge with dose-escalated radiotherapy using PSPT for tumors in very complicated anatomy. Because of a limited number of treatment fields, delivering ablative doses to targets with complicated shapes or locations, such as tumors curved around sensitive critical structures, is very difficult using PSPT. In IMPT, a pencil beam (spot or beamlet) can be magnetically scanned in two-dimensional directions perpendicular to the beam direction to form an irradiating field. By charging protons with different energies, pencil beams can be used to penetrate with different depths and “scan” the entire designated target volume. The delivery of the sum of all Bragg peaks individually modulated is thus sought to create highly conformal dose distributions to cover the three-dimensional (3D) tumor target. Mathematically, IMPT using scanning beam therapy can simultaneously optimize the intensities and the energies of all pencil beams using an objective function that takes into account targets as well as normal tissue constraints. Compared with PSPT, IMPT is more effective for designing treatment plans that deliver ablative doses to targets with complicated shapes or locations, such as tumors curved around sensitive critical structures. As shown in Fig. 5.1 , because of the close proximity of the spinal cord and planning target volume (PTV), the aperture has to be edited to meet the cord dose constraint. This aperture editing caused the underdose of the PTV, as shown in the enlarged image of the target region. Clinically, we have observed local recurrence in these underdosed regions for patients treated with PSPT technique at our center. Compared with intensity-modulated radiation therapy (IMRT)/volumetric-modulated arc therapy (VMAT) technology, IMPT treatment plan can be designed optimall to take advantage of the proton beam. The IMPT plan is able to significantly reduce the dose to the healthy organs while delivering a similar target dose. Fig. 5.2 shows a comparison of IMPT and VMAT plans for the first patient treated with multiple-field optimization (MFO) IMPT at our center. We can see that the mean lung dose for the IMPT plan is reduced by 4.4 Gy compared with the VMAT plan. Currently, patients with thoracic cancer are the most complex cases, for whom dose-volume constraints cannot be met by VMAT plans or because they need reirradiation.

Uncertainties
Because of the greater dosimetric advantage of IMPT compared with IMRT and PSPT, lately, newer proton centers have started adopting scanning beam–only delivery technology. Translational research on treatment planning centers on developing IMPT-specific planning technology. Among the most important planning technology developments is that of robust optimization for IMPT. There are several sources of nonrobustness of IMPT plans: (1) range uncertainty, (2) setup uncertainty, (3) motion/interplay uncertainties for moving anatomy, and (4) anatomical change uncertainties.
Range uncertainties
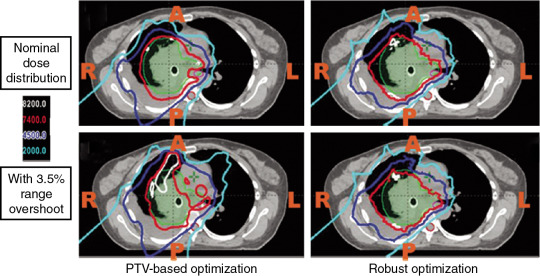
The most important dose-sparing ability of the proton beam is that the proton can stop at roughly the end of the proton’s range. However, because of approximation of tissues on computed tomography (CT) scans into Hounsfield units (HUs), there are systematic range uncertainties of about 3% in our understanding of where protons stop in patient tissues. Fig. 5.3 shows the dose distribution of an original plan and the dose distribution of a plan assuming a 3.5% range overshooting. The target dose is well covered by the prescription in the original plan, but the target is severely underdosed if the plan is 3.5% undershot. If a beam of a plan stops right before a critical organ, such as the spinal cord or brain stem on an original plan, the brain stem or spinal cord will actually receive much more dose than if the beam is overshot by 3.5%. Currently, one of the rules of thumb of selecting beams is still to not select beams stopping right before critical organs.
Setup uncertainties
All modalities of radiation therapy, regardless of whether they are proton or photon, suffer from setup uncertainties. Setup uncertainties are attributed to the misalignment of incident beams and the patient anatomy and the realignment of internal heterogeneities among themselves and with respect to the target volume. For photon therapy, setup uncertainties are mitigated by the use of expansion margins from the clinical target volume (CTV) to the PTV. The margin approach works well for photon therapy and is based on a nice property of the photon: the spatial nature of photon dose distributions is minimally perturbed by uncertainties. In other words, a photon dose distribution is relatively robust in the face of uncertainties. Unkelbach et al. have used the term static dose cloud to describe a photon dose distribution. However, the margin approach does not work well for proton therapy. Distal and proximal to the beam direction, the margins for proton therapy should be determined by the range uncertainties. In the lateral direction, the static dose cloud will be broken under the lateral setup uncertainties. As shown in Fig. 5.4 , the symmetry of the dose cloud, shown as the red isodose line that covers the target (blue shaded region), is broken if the patient moved up by 5 mm. The target is still covered in the up direction but is underdosed in the middle. The underdose shown in Fig. 5.4 cannot be mitigated by the margin.

Motion/interplay uncertainties
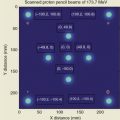
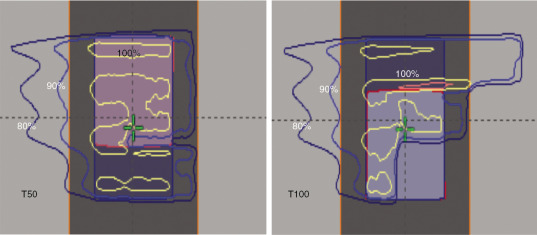
Protons are sensitive to variations in tissue density in the beam path. , This is particularly important when the tissue moves, as in the case of tumors in the lung. The sensitivity of protons to moving anatomy can be seen by calculating dose distributions on different phases of four-dimensional CT (4D CT). Fig. 5.5 shows uncertainties caused by breathing motion imitated with a phantom. In this extreme case, we can see that the dose in the T0 phase is drastically different than in the T50 phase if the plan is designed using only the T50 phase.
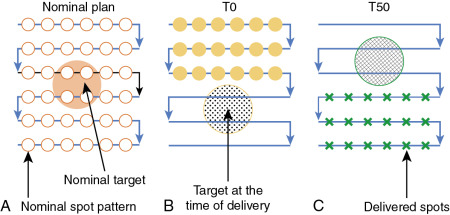
Both PSPT and IMPT techniques have uncertainties in dose distribution in the different phases of CT. However, for the IMPT plan, there is an extra uncertainty. For the IMPT technique, a magnetically deflected particle beam scans the tumor volume laterally by sequentially delivering a series of scanning spots and longitudinally, layer by layer, by altering proton energy. If the target moves at the same time as the scanning beam is delivered, the motion of the pencil beam might interfere with the delivery of the intended dose distribution, causing deviations from the planned dose distributions. This interference usually results in local regions of underdoses and overdoses, referred to as interplay effects. As shown in Fig. 5.6 , if the tumor motion and dynamic delivery are synchronized unfavorably, we might have a complete miss of the target in extreme cases.
Anatomical change uncertainties
Anatomical changes during radiation therapy are sometimes a consequence of radiation therapy. Because radiation is used to eradicate tumors, the tumors will shrink during the course of treatment. This can be seen in Fig. 5.7 ; the tumor/gross tumor volume (GTV) at simulation is different from the tumor/GTV shown on the day 50 CT scan. Also, patients often lose weight during the course of treatment, especially those with head and neck (HN) cancer. The anatomical change during the course of the treatment affects proton much more than photon therapy. Because of the larger perturbation of the IMPT plan attributed to anatomical change, we propose that plan adaption is mandatory for lung cancer IMPT plans to ensure target coverage. At our center, more 30% of lung IMPT plans need adaptation during the course of treatment to compensate for the uncertainties caused by anatomical change.
Robust evaluations
Planning target volume and clinical target volume concept
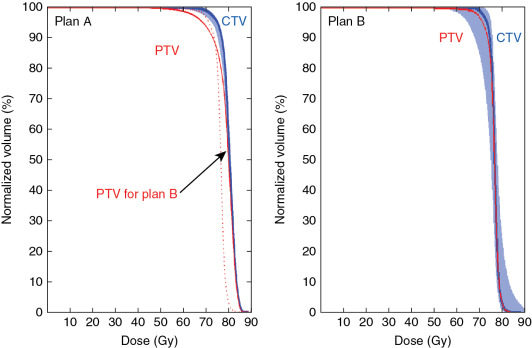
As a result of the various uncertainties discussed previously, the major challenge facing the proton therapy community is how to evaluate the robustness of the treatment plan. In the photon world, the major tool for evaluating robustness is the concept of PTV and planning risk volume (PRV). The PTV is usually defined as the CTV plus a margin. One formula for margins is 2.5 Σ + 0.7 σ, where Σ is the systematic error, and σ is the random error. Based on the famous work of Van Herk, , if the PTV margin is set based on 2.5 Σ + 0.7 σ, the CTV treated based on the facility’s systematic and random error, the chance that the CTV will receive 95% of the prescription dose is 95%. The margin formula has been widely adopted as the guideline for evaluating the robustness of photon therapy. However, using PTV as a means to evaluate the robustness of a proton plan was increasingly realized to be ineffective for IMPT plans. Fig. 5.8 shows the dose-volume histograms (DVHs) of two plans; the PTV coverage of plan A represented by the solid line is worse than that of plan B represented by the dashed line. However, the range of DVH variation of CTV under different uncertainty scenarios (shown by the shaded DVHs for plan A) is much narrower than that for plan B. For this plot, we used the same uncertainty scenarios for both plan A and plan B; apparently, plan A is more robust than plan B. Thus Fig. 5.8 indicates that better PTV coverage for the proton plan does not necessarily lead to more robustness of the plan. In other words, PTV is not a good way to evaluate the robustness of proton plans.
Worst-case robust evaluation
Currently, worst-case dose distribution and worst-case DVH are increasingly being adopted as the major tools for evaluating the robustness of proton plans. Worst-case dose distribution was first proposed by Lomax et al. After a treatment plan was designed, it was recalculated with different uncertainty scenarios. Each uncertainty scenario essentially leads to a new plan. Because it is not convenient to evaluate so many new plans, Lomax et al. proposed to use a “worst-case” dose distribution to represent many plans with different uncertainty scenarios. The worst-case dose distribution introduced by Lomax et al. is a method of combining multiple dose distributions (e.g., dose distributions calculated for different ranges of the Bragg peaks) into a single one. For a voxel inside the target volume, the minimum dose of this voxel in all dose distributions is stored in the worst-case dose distribution. For a voxel outside the target volume, the maximum is taken. The worst-case dose distribution evaluation is not actually adopted in commercial treatment planning systems (TPSs). In practice, the commercial Eclipse TPS used at our center released a tool, termed a range uncertainties tool, to facilitate calculation of many new perturbation plans. It can also plot DVHs from many uncertainty plans. The DVHs of a particular organ of interest from many plans are essentially combined to form a band of DVHs. We can gauge the robustness of the plan by the “band” of DVHs. Trofimov et al. even proposed redrawing those band DVHs as shaded DVHs and using them as a standard approach to evaluate the robustness of IMPT plans.
Although the concept of worst-case dose distribution and worst-case DVHs seems to be a valid approach to evaluate the robustness of IMPT plans, two unanswered questions remain: (1) how many uncertainty scenarios should be used? and (2) what is the criterion to say that a plan is robust or not robust?
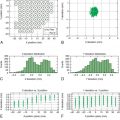
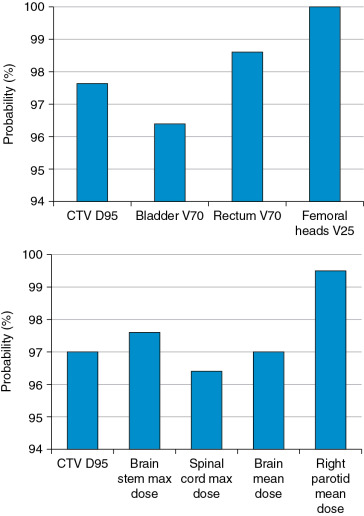
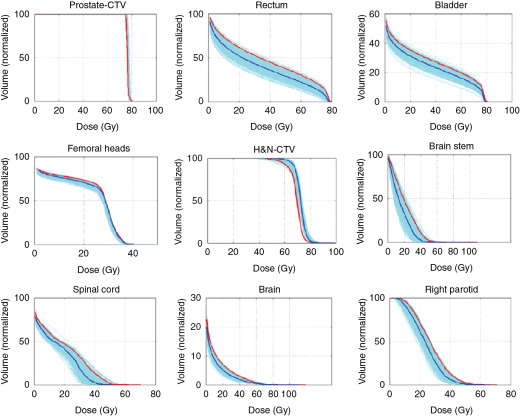
Much work has been done to address the first question. One approach is to use statistical uncertainties. However, in our practice, we adopted only eight different scenarios and plotted the banded DVH with nine scenarios (eight perturbations plus the original one.) The eight scenarios are calculated by shifting the isocenter of the original plan by +−d x , +−d y , +−d z , and over/undershooting range b y +−d r , where dx, dy, dz are the systematic uncertainties in x , y , and z directions, and dr is the range uncertainty, normally chosen to be 3.5%. We were tempted to use 95% coverage of the worst-case CTV to be equivalent to 95% coverage of the PTV as in the photon plan. But this concept has not been valid. Moreover, the nine-scenarios approach is only an approximation. The assumptions of this method may not be solid for the following reasons: (1) it is not always appropriate to assume that only cold spots have negative effects in treating the target; (2) the error on a perturbation dimension, say dx, cannot be +3 mm and −3 mm at the same time; (3) worst-case analysis (WCA) examines the shift in x , y , and z directions and beam range uncertainties separately, but shift always happens in all directions simultaneously with range uncertainties. It is therefore not clear whether WCA would over- or underestimate the plan sensitivity to uncertainties. It is necessary to validate the WCA method in a comprehensive way. We used a Monte Carlo–like approach to examine a large number of possible treatment plan–related scenarios with different perturbations. In our study, a series of perturbations to modify proton beam range and to shift the isocenter was sampled 500 times with the Ziggurat rejection sampling algorithm to derive the probability distribution of possible plan qualities for a prostate case and an HN case. The magnitude of the perturbation was assigned randomly following a Gaussian distribution with specified standard deviations in each perturbation dimension. The perturbed dose was calculated for each sampling, and DVHs were obtained. Dose-volume indices, including dose that was received by 95% of the target volume (D95) of CTV, volume of rectum and bladder exposed to at least 70 Gy (V70), V25 of femoral heads (V50 and V45 were all zero in the studied case), maximum dose to brain stem and spinal cord, and mean dose to brain and right parotid, are inspected here for demonstration purposes. The results were compared with the ones derived by WCA. The probabilities by which the dose volume indices of a perturbed dose are superior to the ones from WCA are shown in Fig. 5.9 . For CTV, 97.6% in the prostate case and 97% in the HN case of perturbed doses show a D95 value higher than the value given by WCA. For normal tissues, at least 96.4% of perturbed doses show lower dose-volume indices than the ones by WCA. As shown in Fig. 5.10 , the DVHs of 500 perturbed doses spread over narrow or broad bands, and the DVH curves from WA lie within those bands and near the “worst” edges. This suggests that WCA may reasonably evaluate the IMPT plan’s sensitivity to setup and range uncertainties. On the other hand, the observation that the perturbed dose could be worse than the WCA results with low but finite probabilities suggests that the plans’ sensitivities were not overestimated by WCA.
Regarding the second unanswered question about the uncertainty criterions, no research has been done to date on this question. We believe that to fully address this question, one must correlate clinical outcomes with the IMPT plan to determine the robust evaluation criterion. When this chapter was written, this was an active focus of our research.
Robust evaluation considering motion
The worst-case dose distribution considered only setup and range uncertainties. However, for lung and liver tumors, tumor and normal tissue organ motion can be very large. The effect of that motion on proton plans poses another challenge for evaluating the robustness of proton plans. As seen in Fig. 5.5 , the same plan may produce very different dose distributions on different breathing phases. At MD Anderson Cancer Center MD Anderson strongly discourages the use of this (or other) initialisms; it prefers to be spelled out as “MD Anderson Cancer Center” at first mention and simply “MD Anderson” elsewhere., regardless of whether the plan is PSPT or IMPT, the dose must always be calculated on both the T0 and T50 phases as a robust evaluation strategy for thoracic cancer. To evaluate the interplay effect of the dynamic delivery and mobile tumor or anatomy, we developed a dynamic dose simulator. The 4D dynamic dose simulator calculates dose on the basis of the treatment planning procedures and beam delivery system details at our institution. With this 4D dynamic dose simulator, we defined a metric that represents the target coverage of a single-fraction 4D dynamic dose without considering rescanning, denoted as the 1FX dynamic dose. The target coverage of the 1FX dynamic dose, calculated with the use of our 4D dynamic dose simulator, has become our clinical standard for evaluating the magnitude of interplay effects.
Robust optimization
After we understood the various sources of uncertainties, different strategies were proposed to make the plan robust against those uncertainties. To compensate for the range uncertainties that were not seen in photon planning, a concept termed beam-specific PTV (bsPTV) was proposed. The beam-specific target is the CTV/GTV, expanded laterally using the margins similar to CTV to PTV margins but expanded distally and proximally using the distal margins and proximal margins determined by the range uncertainties. One drawback of the bsPTV approach is that this approach can work only for single-field optimization (SFO).
Since the mid-2010s, robust optimization by incorporating errors directly into the optimization algorithm has evolved from early exploratory research , , into clinical practice. , Robust optimization can be done in several ways: the probabilistic approach and worst-case optimization. The probabilistic approach , assumes prior knowledge of the probability distribution of the uncertainty; in most cases, the distribution was assumed to be normal. The worst-case optimization optimized the worst case that could have occurred. After Pflugfelder et al. implemented the first version of the worst-case optimization in their in-house TPS for particle therapy (KonRad, Heidelberg, Germany), the worst-case dose optimization or its slight variations have now become the standard method implemented at MD Anderson or commercially. , The worst-case optimizations were first formulated as :
MinFRobust=∑i∈TwT,min(Di,min-Dp,T)2+∑i∈TwT,max(Di,max-Dp,T)2+∑i∈OARwOAR(Di,max-Dp,OAR)+2
Stay updated, free articles. Join our Telegram channel

Full access? Get Clinical Tree


