Principles of Flow Cytometry
INSTRUMENTATION
A flow cytometer is versatile in its capability of measuring multiple parameters simultaneously. These parameters include the physical properties of cells (e.g., cell size and cytoplasmic granularity), surface membrane, cytoplasmic and nuclear antigens, and DNA-RNA contents of individual cells in a cell suspension. Surface, cytoplasmic, and nuclear antigens are detected by means of fluorochrome-conjugated antibodies. These antigens are thus the extrinsic properties of the cell. The physical properties of the cell are the intrinsic properties, because no exogenous reagents are added for their detection. These parameters are measured through an optical system, and the light signal thus generated is registered in an electronic system. The computer system is responsible for data storage, gating, and graphic display on a screen.
Although the Coulter counter can be considered a flow cytometer, the term flow cytometer is usually reserved for cell counters with fluorescence detectors, such as the FACSCanto II (Becton Dickinson) (Fig. 2.1) and the Cytomics FC500 (Beckman Coulter, Inc.) (Fig. 2.2). The design of the optical, electronic and computer systems may be somewhat different in various flow cytometers, but they are constructed with essentially the same principles.
With the change of light source from mercury arc to laser, the cooling system from water cooled to air cooled, and the computer system from simple to sophisticated, the size of the flow cytometer has become smaller (table-top) and its function expanded in terms of data storage, number of fluorochromes used, and graphic and data display. However, the basic components of a flow cytometer remain the same: the fluid transport system, the optical system, the electronic system, and the computer system (1, 2, 3, 4, 5, 6, 7 and 8).
FLUID TRANSPORT SYSTEM
The fluid transport system starts with a sample receiving area where test tubes containing patients’ specimens and controls are placed in a carousel. The cell suspension is aspirated by means of differential air pressure or vacuum into a tubing system leading to the flow chamber (Fig. 2.3). When in the flow chamber, which is a conical nozzle, the specimen is surrounded by a cell-free stream of sheath fluid, producing a laminar flow configuration. The outer sheath fluid forces the cells in the sample to line up single file. When the sample exits from the flow chamber through a narrow orifice, the flow velocity becomes markedly increased (about 1 to 10 m/s). The cell stream then meets the light source (mercury arc lamp or laser) at the light interception point in the sensing area, and electric or optical signals are generated.
OPTICAL SYSTEM
Electric signals are generated due to changes in electric resistance of the fluid when cells suspended in an electrically conducting medium pass through a light beam in the sensing area. Based on the fact that blood cells have lower electric conductivity than saline solution has, Wallace Coulter designed a cell counter that has dominated the American market for >30 years. The principle he used to measure cell volume is now called the Coulter Principle. This principle was also used in some older models of flow cytometers, such as the fluorescence-activated cell-sorting (FACS) analyzer (Becton Dickinson), which contains a mercury-cadmium arc lamp. The advantages of using mercury and xenon arc lamps are their low cost, ease of operation, and broad range of spectral output. The disadvantages are nonuniform radiance, low brightness, and instability of the arc. Because the disadvantages outweigh the advantages, mercury arc lamps are no longer used in the new models of flow cytometers.
Currently, all flow cytometers use lasers as the light source, and optical instead of electric signals are generated. Lasers can deliver intense, coherent (waves of light that are parallel and unidirectional), monochromatic light (single color or wavelength), thus resulting in low divergence and high brightness of the signals generated. The use of small air-cooled ion lasers has facilitated the development of smaller, less expensive, easier-to-install flow cytometers, such as the FACSCanto II and Cytomics FC500.
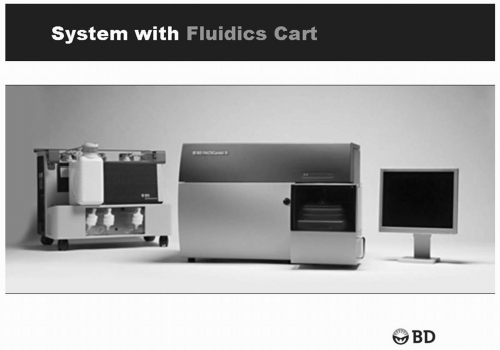 FIGURE 2.1 Photograph of FACSCanto II flow cytometer manufactured by Becton Dickinson. (From Becton Dickinson with permission.) |
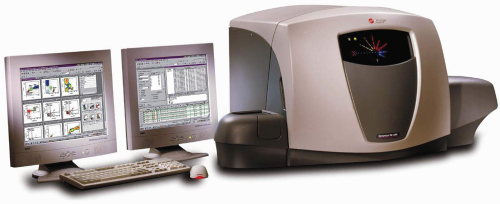 FIGURE 2.2 Photograph of Cytomics FC500 flow cytometer manufactured by Beckman Coulter. (From Beckman Coulter, Inc., with permission.) |
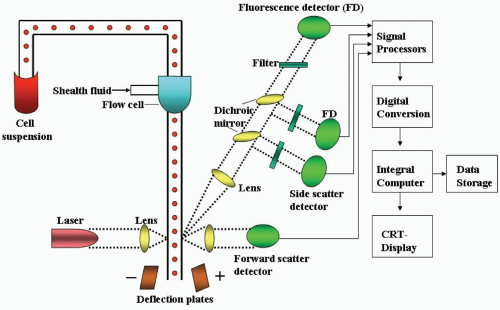 FIGURE 2.3 Basic structure of a flow cytometer showing the fluid transportation system, the optical system, the electronic system, and the cell sorter. |
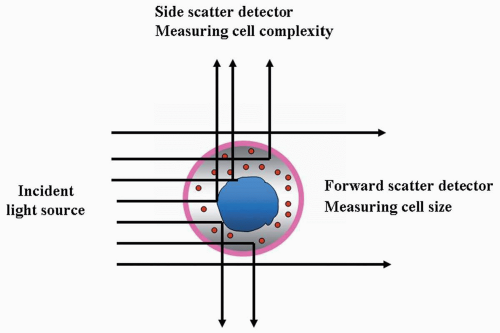 FIGURE 2.4 Schematic illustration showing the relationship of light scatter and cell size/structure. |
The most frequently used optical signals are forward-angle (2 to 10 degrees) and right-angle (90 degrees) light scatter (Fig. 2.4). The former is proportional to cell size, and the latter is related to cell characteristics, such as cytoplasmic granularity and nuclear configuration.
Fluorescent Signals
The light scatter signals are usually used for screening. However, the characterization of cells is mainly based on their surface, cytoplasmic, and nuclear antigens, which are detected through a special optical signal: the fluorescent signal. Fluorescent signals are generated through fluorochrome-labeled antibodies that react specifically with various cell antigens, thus facilitating the identification of cell lineage, developmental stage, and special groups of tumor cells. Cellular DNA and RNA can be directly stained by intercalating agents, such as propidium iodide, which can bind DNA and RNA with the resultant generation of fluorescent signals.
Fluorochrome-labeled cells absorb incident light from the laser, resulting in emission of a longer wavelength, which is called fluorescence. The color of light emitted is a function of its wavelength (Table 2.1). As long as the wave-lengths emitted from the various fluorochromes do not overlap, the same specimen can be treated with 2 to as many as 10 fluorochrome-conjugated antibodies. The selection of fluorochrome is determined by the compatibility between the wavelength spectrum of the light source and the excitation ranges of the fluorochromes (Table 2.2). The most frequently used fluorochrome pair is fluorescein isothiocyanate (FITC) and phycoerythrin (PE).
Lens, Filter, and Mirror
A series of optical devices is used to direct the incident light, reflected light, and fluorescence to detectors. A beam-shaping lens is used to focus the laser down to a narrow beam waist of 20 to 100 µm in the sensing area. In multicolor analysis, separation of multicolored light is accomplished by the combined use of filters and dichroic mirrors. A short-pass filter allows only light of short wavelengths to pass and blocks that of the longer wavelengths. A long-pass filter acts the opposite way. Dichroic mirrors, in contrast, allow light of certain wavelengths to pass and reflect the light that is not allowed to pass.
ELECTRONIC SYSTEM
After traveling through all the filters and lenses, the photons of light impinge on the detectors and are converted into electrons (photoelectric effect). The detectors include photomultiplier tubes, which are commonly used for side-scatter and fluorescence signals, and photodiodes, which are used for absorption, extinction, and forward-scatter signals. The electronic signals or voltage pulses are analog signals in various magnitudes from 1 to 10 V. Analog signals may be processed as peak amplitude (height), integral (area), width (duration), or shape of the pulse and are expressed in either logarithmic or linear scales.
TABLE 2.1 Wavelength and Color of Fluorochromes | ||||||||||||||||||||||||||||||||||||||||
|---|---|---|---|---|---|---|---|---|---|---|---|---|---|---|---|---|---|---|---|---|---|---|---|---|---|---|---|---|---|---|---|---|---|---|---|---|---|---|---|---|
|
TABLE 2.2 Wavelength of the Light Source and Choice of Fluorochrome Combination | |||||||||||||||||||||
|---|---|---|---|---|---|---|---|---|---|---|---|---|---|---|---|---|---|---|---|---|---|
| |||||||||||||||||||||
The analog signals are digitized in the analog-to-digital converters. The digital signal is a function of instrument resolution. A low-resolution instrument may have 256-channel resolution, whereas a high-resolution instrument may range over 1,024 channels. The last component of the electronic system is the pulse height analyzer, which analyzes the digital signals and quantifies them for computer display on an oscilloscope screen.
COMPUTER SYSTEM
The flow cytometer can be interfaced with an external computer system that performs three important functions.
List-mode storage: All parameters measured can be stored permanently on a floppy disk or temporarily on a hard disk. All data can be combined and analyzed later and can be printed in graphic form as a permanent record.
Gating: A gate is an electronic window that can be set with a cursor on the screen in a rectilinear or amorphous form to circumscribe a group of cells with similar characteristics (e.g., size and cytoplasmic granularity). Gating is performed to isolate electronically this special group of cells for analysis, avoiding the difficult task of purifying the cell population by biologic means. Depending on the software capability, several gates can be set so that information can be gathered on several populations of cells.
Graphic display: The computer can provide graphic displays in several forms, as described below.
Scattergram (Dot Plot, Cytogram)
This is a graphic display of dots as determined by two related parameters along the x and y axes. For instance, one can plot forward-angle light scatter against right-angle light scatter; each dot represents a single cell or event. On the basis of cell size (forward angle) and cytoplasmic granularity (right angle), the scattergram usually shows three distinct groups of cells in peripheral blood samples. The lymphocytes are the smallest (with no cytoplasmic granules); the monocytes are the largest; the granulocytes have the most cytoplasmic granules (Fig. 2.5). In lymph node specimens, the distinction between a group of large cells and a group of small cells frequently helps to separate lymphoma cells from reactive lymphocytes or a small cell lymphoma from a mixed small and large cell lymphoma.
Single Histogram
This graph is usually used to display the number of cells (y axis) versus fluorescence intensity (x axis). When cells are stained with a fluorochrome-labeled antibody, a single histogram provides the percentages of positive and negative populations (Fig. 2.6). An isotopic-negative control should be used to determine the cutoff point between these two populations. For instance, if the monoclonal antibody is mouse immunoglobulin G (IgG), the mouse IgG with no specific antibody function should be used. When DNA stain is used, the single histogram can demonstrate the percentage of cells in different stages of the cell cycle and determine the ploidy of chromosomes with a normal control.
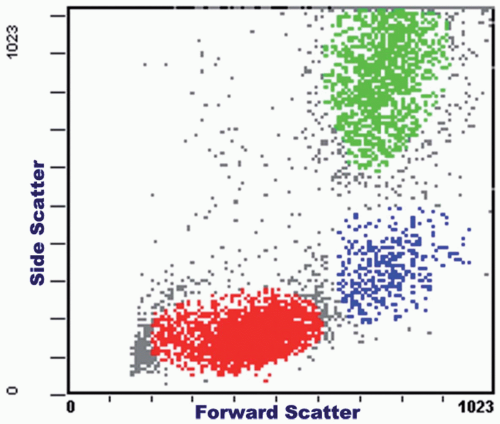 FIGURE 2.5 Scattergram with side scatter plotted against forward scatter, showing clusters of lymphocytes (red), monocytes (blue), and granulocytes (green) in a peripheral blood specimen. |
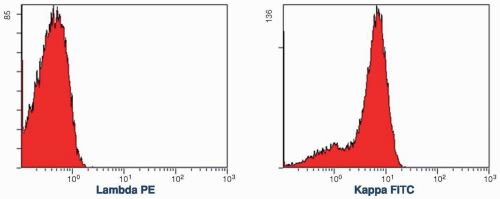 FIGURE 2.6 Histogram of a specimen stained with kappa and lambda antibodies. The lambda population is negative, whereas the kappa population is positive. PE, phycoerythrin; FITC, fluorescein isothiocyanate. |
Contourgram (Contour Plot, Contour Map, Contour Histogram, or Two-Parameter Histogram)
The contourgram computes the percentage of cell groups as determined by two parameters (e.g., two monoclonal antibodies or DNA and RNA contents) (Fig. 2.7). In contrast to the dot plot, the contour plot is composed of isocontour lines representing the cross-sections of the peaks and valleys of the data. An isocontour line connects all elements with a similar frequency of events. When the cutoff points of these two parameters are determined, the contourgram can be divided into four quadrants, and the percentages of subpopulations are readily computed. This is a very useful means for further characterization of subpopulations. Dot plots can also be used for this two-dimensional analysis.
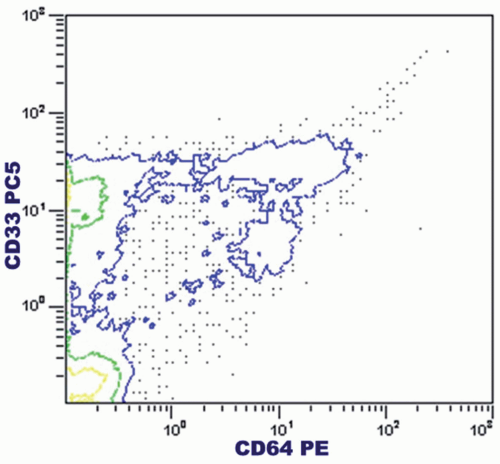 FIGURE 2.7 Contourgram of a case of acute myelomonocytic leukemia showing various populations as defined by CD33 and CD64. PC5, phycoerythrin-cyanin 5; PE, phycoerythrin. |
Isometric Plot (Three-Dimensional Isometric Curve)
The isometric plot is most frequently used for simultaneous DNA and/or RNA analysis, but it can be used to display the correlation of any three parameters (Fig. 2.8). An isometric plot is often used to present multifactor analysis in research projects and is seldom used in clinical laboratories for routine phenotypic analysis.
Cell Sorter
Although cell sorting can be based on the principle of electroacoustic or electromechanical fluid switching, most instruments use droplet sorting. For droplet sorting, the stream of cell suspension first passes through an ultrasonically vibrating nozzle so that the stream can be broken up into evenly spaced droplets (e.g., 30,000 to 40,000 droplets per second). At the discretion of the operator, the droplets containing the cells of interest, which have been identified by a monoclonal antibody, are selectively charged electronically, either positive or negative, and then deflected as
they fall through an electromagnetic field formed by two deflection plates. The uncharged droplets fall vertically into a waste container. The cells separated in this way are usually viable and 95% pure. The cell sorter is undoubtedly a useful tool in research laboratories; however, it is not an absolute necessity for a clinical laboratory, because different groups of cells can be separated by electronic gating, and the cell group of interest can thus be selected.
they fall through an electromagnetic field formed by two deflection plates. The uncharged droplets fall vertically into a waste container. The cells separated in this way are usually viable and 95% pure. The cell sorter is undoubtedly a useful tool in research laboratories; however, it is not an absolute necessity for a clinical laboratory, because different groups of cells can be separated by electronic gating, and the cell group of interest can thus be selected.
Related posts:

Stay updated, free articles. Join our Telegram channel

Full access? Get Clinical Tree


