Clinical Application


Clinical Application


The clinical application of immunohistochemistry is discussed in Chapter 3; this chapter is devoted mainly to flow cytometric applications. By using a panel of appropriately selected monoclonal antibodies, flow cytometric analysis may determine the cell lineage (T cell, B cell, natural killer [NK] cell, or myelomonocytic cell), developmental stage (mature vs. immature, thymic vs. postthymic) and clonality (monoclonal vs. polyclonal) of a given cell population. It may also determine the heterogeneous and aberrant features and the percentage of the tumor cells (1). The analysis of these parameters by immunologic means is called immunophenotyping.

Immunophenotyping serves many different functions. When the features of cytology and histopathology are not diagnostic, immunophenotyping helps distinguish a benign lesion from a malignant one, thus achieving a definitive diagnosis. Even when diagnosis is not a major problem, immunophenotyping is still needed and plays an essential role in differential diagnosis, subclassification, and prediction of prognosis. These functions are well exemplified in the area of low-grade B-cell lymphomas, such as small lymphocytic lymphoma, chronic lymphocytic leukemia, mantle cell lymphoma, follicular lymphoma, hairy cell leukemia, and various types of marginal zone B-cell lymphoma, to name just a few. The continuing discovery of new monoclonal antibodies enables better refinement for the diagnosis and classification of these diseases. For instance, the availability of CD23 antibody facilitates the distinction between small lymphocytic lymphoma and mantle cell lymphoma. The prognosis for a certain lymphoma can be evaluated by quantifying the proliferation-associated antigen, such as Ki-67 and PCNA (proliferating cell nuclear antigen). A poor prognosis may also be expected when high percentages of activation antigens (e.g., CD25, CD38, CD71, and human leukocyte antigen [HLA]-DR) are present.


CRITERIA FOR FLOW CYTOMETRIC DIAGNOSIS OF HEMATOLOGIC NEOPLASMS

The major drawback of flow cytometry (FC) for the diagnosis of hematologic neoplasms is its inability to correlate the cell morphology with the surface, cytoplasmic, or nuclear markers, because FC does not allow pathologists or other scientists to have a direct view of the cells examined. Therefore, a set of criteria is established to distinguish hematologic neoplasms from normal leukocytes (Table 6.1).


TABLE 6.1


Criteria for Diagnosis of Hematologic Neoplasms by Flow Cytometry


1.


Immunoglobulin light-chain restriction.


2.


Loss of surface immunoglobulin in a B-cell population.


3.


Coexistence of two different cell-lineage markers on the same cell population.


4.


Expression of immature cell markers in a large number of cells.


5.


Selective loss of one or more cell lineage antigens.


Immunoglobulin Light-Chain Restriction

The surface immunoglobulin (Ig) light-chain ratio is the most commonly used diagnostic criterion, because it defines the B-cell lineage and clonality at the same time. Its importance is based on the fact that 80% to 90% of lymphomas are of B-cell origin. When one light chain is dominant over the other, it is referred to as light-chain restriction and is indicative of monoclonality. The normal κ/γ ratio is about 2:1. The definition of monoclonality on the basis of this ratio varies from different studies. Taylor (2) defined a monoclonal pattern as a κ/λ ratio ≥3:1 or a λ/κ ratio ≥2:1. Samoszuk et al. (3) defined monoclonality as a κ/λ ratio of 5.5:1 and a λ/κ ratio of 1.7:1. By using a higher cutoff point in the λ/κ ratio the specificity is increased, whereas the sensitivity is decreased (false-negative rate was 27%). This false-negative rate is probably too high to be acceptable by clinical laboratories. Our experience is that if the B-cell population is <20% of the total population or if the minor light-chain component (either κ or λ) is >10% (e.g., κ 45% and λ 15%), the value of the κ/λ ratio is not reliable.


Taylor (2) also defined monoclonality as the ratio of the predominant heavy chain to the sum of other heavy chains ≥3:1. The argument against the use of heavy chains as markers for clonality is that heavy-chain switch may take place after gene rearrangement, and thus no predominant heavy chain will be detected in that situation. In addition, for cost effectiveness, most laboratories have discontinued the use of three or five heavy-chain antibodies. However, the demonstration of heavy-chain switch is sometimes associated with lymphoma transformation, such as in Richter syndrome (4). Furthermore, the data obtained from heavy-chain analysis can be used to double check the light-chain results and is useful in borderline cases (5). Nevertheless, for cost containment, most clinical laboratories have discontinued the use of heavy-chain antibodies.

For surface Ig studies, polyclonal antibodies should be used because monoclonal antibodies react only to a single antigenic epitope of a particular Ig and do not react to some subclasses of Ig (such as IgG3 or IgG4) that may be present exclusively on some tumor cells.


Loss of Surface Immunoglobulin in a B-Cell Population

In about 10% to 20% of lymphomas, B-cell antigens are demonstrated on tumor cells that show no surface Ig by immunohistochemical study or a low percentage of Ig-positive cells by flow cytometric analysis (5,6). Because surface Ig is the antigen receptor on normal B cells, the lack of it is found only on neoplastic cells. The common examples that express the surface Ig-negative, B-cell antigen-positive immunophenotype is the primary mediastinal B-cell lymphoma and acute lymphoblastic leukemia of B-cell origin (L1 and L2).


Coexistence of Two Different Cell Lineage Markers on the Same Cell Population

Dual-cell lineage markers have become the hallmark of several lymphoid tumors. For instance, chronic lymphocytic leukemia, small lymphocytic lymphoma, and mantle cell lymphoma carry a B-cell marker (either CD19 or CD20) and a T-cell marker (CD5), whereas hairy cell leukemia bears a B-cell marker (CD22) and a monocyte marker (CD11c). In acute myeloid leukemia, more and more lymphoid markers are being found on the leukemic cells. These doublelabeled leukemic cells previously were considered to be bilineal. However, when a single lymphoid marker (e.g., CD7) is coexistent with myeloid markers, it is now considered to be an aberrant phenotype, which is consistent with leukemia rather than a normal myeloid population.


Expression of Immature Cell Markers in a Large Number of Cells

The demonstration of terminal deoxynucleotidyl transferase (TdT) and CD10 (CALL) on tumor cells of lymphoblastic lymphoma and/or acute lymphoblastic leukemia and CD34 (hematopoietic progenitor cell antigen) and CD117 (c-kit or stem cell factor receptor) on cells of acute myeloid leukemia are good examples. The only exception is the presence of hematogones in pediatric bone marrow or in patients after bone marrow transplantation or chemotherapy (Fig. 6.1). Hematogones are precursors of lymphocytes, which may carry the immature markers, such as CD10, TdT, or CD34, but morphologically they appear like mature lymphocytes and not leukemic blasts (7, 8 and 9). However, immature-looking hematogones can also be present in occasional cases. Therefore, morphologic verification of an immature cell phenotype is always necessary, particularly in pediatric patients or those after chemotherapy or bone marrow transplantation.


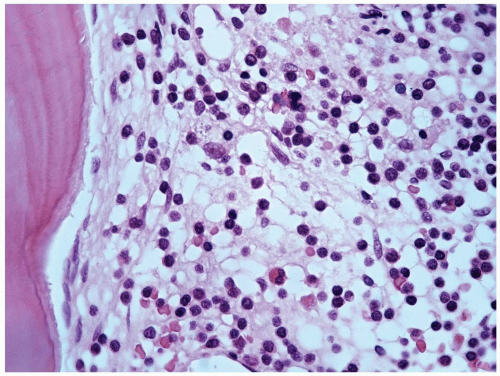
FIGURE 6.1 Bone marrow biopsy from a patient with acute myeloid leukemia after chemotherapy. Note a homogeneous population of small lymphocytes representing hematogones, as proved by flow cytometry. Hematoxylin and eosin, 60× magnification.

There is a tendency for commercial laboratories to offer a blast count based on the percentages of immature cell markers without the knowledge of clinical diagnosis and morphologic correlation. The general practice is to multiply the percentage of the gated population by the percentage of immature cell markers in this particular population. For instance, if the myeloid gate accounts for 50% of the total events registered in the flow cytometric analysis and 30% of the gated population expresses CD34, the blast count is then reported as 15%. This result can be very misleading, because the immature markers, as mentioned above, may be expressed by different kinds of cells and each dot (or event) in the dot plot does not represent an intact cell. These dots may include cell debris, noncell particles, platelets, and other contaminants.


Selective Loss of One or More Cell Lineage Antigens

Selective loss of one or more cell lineage antigens on a group of lymphoid cells is also an indication of malignancy (6,10). This criterion is particularly useful for diagnosis of T-cell lymphomas because there are no clonal markers for T cells analogous to light-chain restriction for B cells. When three pan-T-cell surface markers (CD3, CD5, and CD7) are included in a study panel, the early-appearing marker (CD7) is more frequently demonstrated in the tumor derived from an early T-cell developmental stage, whereas
the late-appearing T-cell markers (CD3 and CD5) may be decreased. In contrast, the late-appearing marker (CD3) is more frequently seen in peripheral T-cell lymphomas, and the early-appearing marker (CD7) may be absent. The gradual decrease in CD7+ cells in contrast to the persistence of CD3+ cells in cases of mycosis fungoides is one of the most dramatic examples. However, one must distinguish cytoplasmic from surface CD3, because the former is a marker that appears in immature T cells.


TABLE 6.2


Categories of Surface and Nuclear Antigens


Lineage-associated antigens


B cell: CD10, CD19, CD20, CD21, CD22, CD23, CD24, CD79, CD138, PCA-1,
immunoglobulins (IgA, IgG, IgM, IgD, κ, λ)


T cell: CD1, CD2, CD3, CD4, CD5, CD7, CD8, CD45RA, CD45RO, TCRαβ, TCRγδ


Nature killer cell: CD16, CD56, CD57


Myelocyte/monocyte: CD11b, CD11c, CD13, CD14, CD15, CD33, CD64, CD68, CD117


Immature cell antigens: CD10, CD34, CD117, TdT


Activation antigens: CD25, CD26, CD30, CD38, CD54, CD71, HLA-DR


Histocompatibility antigens: HLA-I, HLA-II (HLA-DP, HLA-DR, HLA-DQ)


Adhesion molecules: CD11a/CD18 (LFA-1), CD44, CD56 (NCAM), CD54 (ICAM-1),
CD102 (ICAM-2), CD106 (VCAM-1), CD31 (PECAM-1)


Proliferation-associated antigens: Ki-67, PCNA


TdT, terminal deoxynucleotidyl transferase; CD, cluster designation; TCR, T-cell receptor; HLA, human leukocyte antigen; LFA, lymphocyte function-associated antigen; NCAM, neural cell adhesion molecule; ICAM, intercellular adhesion molecule; VCAM, vascular cell adhesion molecule; PECAM, platelet-endotheial-cell adhesion molecule.


Another indicator for the existence of a monoclonal T-cell population is the predominance of a T-cell subset, mostly CD4 and occasionally CD8. However, the minor component (CD4 or CD8) usually is not entirely absent. In addition, in viral infections, especially human immunodeficiency virus (HIV) infection, CD8 will be markedly increased and CD4 will drop to a very low percentage. In Hodgkin lymphoma, in contrast, flow cytometric analysis of a lymph node may show predominantly CD4+ cells. Therefore, the selective loss of a T-cell subset alone is not diagnostic for non-Hodgkin lymphoma unless proven morphologically.


SELECTION OF MONOCLONAL ANTIBODY PANELS

A lymphoma or leukemia is diagnosed not by a single specific marker but by a panel of monoclonal antibodies. Therefore, the selection of a suitable monoclonal antibody panel is one of the most important steps for an accurate diagnosis of hematologic neoplasms. There have been many review articles summarizing the characteristic panels for each hematologic neoplasm (11, 12, 13 and 14). However, the state of the art is to balance between the inclusion of enough monoclonal antibodies to cover the differential diagnoses and the exclusion of excessive monoclonal antibodies to maintain cost effectiveness. There are many monoclonal antibodies available. They can be used to detect surface, cytoplasmic, and nuclear antigens. According to their function, these antigens can be further divided into six categories (Table 6.2).


Lineage-Associated Antigens

This category of antigens is most frequently used in a clinical setting for identifying the lineage of the tumor cells and further narrowing down the differential diagnosis. This category is further divided into B cell, T cell, NK cell, and myelomonocytic cell antigens. The list of B-cell-associated antigens is rapidly expanding. The most common ones include CD10, CD19, CD20, CD21, CD22, CD23, CD24, CD79, CD138, and PCA-1. The T-cell-associated antigens include CD1, CD2, CD3, CD4, CD5, CD7, CD8, T-cell receptor αβ and T-cell receptor γδ. The NK cell-associated antigens consist of only three antigens—CD16, CD56, and CD57—although other antigens, such as CD11c, are frequently expressed by NK cells. The myelomonocyte-associated antigens include CD11b, CD11c, CD13, CD14, CD15, CD33, CD64, CD68, and CD117.


Immature Cell Antigens

This category includes CD10, CD34, CD117, and TdT. The presence of these markers in a large number of cells usually indicates a hematologic neoplasm, except for the regenerating lymphocytes and/or myelomonocytic cells, hematogones, and dysplastic myeloid cells, which may express one or more immature cell markers.


Activation Antigens

This category is composed of CD25, CD26, CD30, CD38, CD54, CD71, and HLA-DR. These activation antigens may serve as growth factor receptors, may be involved in cellto-cell interaction, and bind to a microenvironment (15).
The activation antigens are usually present on actively proliferating tumor cells, thus conferring a poor prognosis. Some activation antigens may be associated with a particular tumor, such as CD25 in hairy cell leukemia and CD30 in anaplastic large cell lymphoma.


Histocompatibility Antigens

Histocompatibility antigens are important in directing cell-to-cell interaction. For instance, the CD4 cells react with cells carrying HLA-II antigen, whereas the CD8 cells react with those bearing HLA-I antigen. The HLA-II antigen includes HLA-DP, HLA-DR, and HLA-DQ. Among them, HLA-DR is the most frequently used antigen for immunophenotyping. HLA-DR is an early-appearing B-cell antigen, but its presence persists into the mature stage. Therefore, if HLA-DR is demonstrated alone without other cell lineage—associated antigens, it is consistent with a stem cell leukemia or lymphoma. HLA-DR is also present on activated T cells, myeloblasts, and monoblasts, but not on promyelocytes. Its absence on promyelocytes helps to identify acute promyelocytic leukemia.


Adhesion Molecules

Many adhesion molecules have been discovered in recent years, so that the inclusion of all antigens in this category is impossible. Adhesion molecules on lymphocytes play an important role in interactions with vascular endothelium and the extracellular matrix, thus controlling lymphocyte homing and migration (16, 17 and 18). In large cell lymphomas, the expression of the lymphocyte homing receptor, CD44, is frequently demonstrated in neoplasms of stages III and IV, but infrequently among cases of stages I and II (16). It appears that CD44 expression may influence lymphoma dissemination. Small lymphocytic lymphoma and chronic lymphocytic leukemia share the same immunophenotype except for the adhesion molecules CD11a/CD18, which are present in the former but absent in the latter (15). The presence or absence of adhesion molecules may explain why cells of small lymphocytic lymphoma stay in tissue, whereas those of chronic lymphocytic leukemia spread to the bloodstream. In addition, there are neural cell adhesion molecules, intercellular adhesion molecules (types 1 and 2), vascular-cell adhesion molecule type 1, and platelet-endothelial-cell adhesion molecule type 1.


Proliferation-Associated Antigens

The commonly known proliferation-associated antigens include Ki-67 and PCNA. Ki-67 is a nuclear antigen associated with proliferation and is expressed in all phases of the cell cycle except for the G0 phase (19). PCNA, in contrast, is present in low concentrations in G1 and G2-M phases, but in high concentration in S phase (20). Because these antigens are expressed only on the nuclei of proliferative cells, calculation of the percentage of Ki-67- or PCNA-positive cells may give a clue to the aggressiveness of the tumor. Detection of a high percentage of Ki-67-positive cells in a low-grade lymphoma is suggestive of transformation to a high-grade lymphoma.

The approach of monoclonal antibody selection differs in different laboratories under various situations (21). There are essentially three ways to select the panels.


Standard Panel

This approach was most common in the early era of FC when the number of monoclonal antibodies was limited. The standard panel usually included representative antibodies from different cell lineage, including B cell, T cell, monocyte, and HLA-DR. B-cell antibodies include CD19, CD20, and immunoglobulins. T-cell antibodies consist of three pan-T-cell antibodies, CD3, CD5, and CD7. The monocyte marker, CD14, is frequently combined with the panleukocyte antibody, CD45, for a gate check. However, because lymphoma and leukemia are further subclassified, as illustrated by the revised European-American Classification of Lymphoid Neoplasms (REAL) and the World Health Organization (WHO) classification, immunophenotyping has become increasingly complicated. A standard panel of 16 or 19 monoclonal antibodies can no longer meet the demand of the modern trend. Further expansion of the standard panel is not only unpopular under the current climate of cost containment, but also unfeasible because it needs a large sample.

A current trend of creating a computer database to facilitate interpretation of immunophenotyping for hematopoietic neoplasms by FC also falls into this category (22, 23, 24 and 25). On the basis of the computer score, a list of differential diagnoses is generated, and a correct diagnosis usually falls into one of the top four or five choices. This approach requires the use of a large panel of antibodies, yet it only narrows the range of differential diagnosis.


Two-Tiered Approach

This approach includes the use of a simple screening panel to obtain some preliminary information and, on the basis of this information, determines a specific panel. This approach is particularly suitable for acute leukemia. For instance, a few immature markers (e.g., TdT, CD10, CD34, and CD117) are analyzed; if one or more of them are positive, cell lineage markers are added for subclassification. Positive reactions to TdT and CD10 will direct the use of lymphoid markers for the diagnosis of acute lymphoblastic leukemia. In contrast, positive CD117 and CD34 will point to the direction of acute myeloid leukemia. Currently, a few core panels are suggested for the differential diagnosis of small B-cell lymphomas. Examples are panels consisting of CD20, CD10, CD23, and κ and λ light chains (26) or CD5, CD10, and CD23 (27) or double staining for CD23 and FMC-7 (28). In this approach, additional antibodies can be added later for a final diagnosis. Although this approach is economical in the optimal use of monoclonal antibodies, it is time consuming. Unless the screening and corroborative tests are done on the same day, this approach is generally not acceptable clinically.


Targeted Approach

This is the most efficient way to select a panel of monoclonal antibodies. It requires a morphologist to review the blood smear, bone marrow aspirate, or frozen section to make a preliminary diagnosis, and a monoclonal antibody panel will then be set up accordingly. If no specimen is available for examination, a preliminary clinical diagnosis should be obtained to determine the panel. With this approach, usually only six to eight monoclonal antibodies are needed. The remaining part of the specimen should be
saved in the refrigerator for additional monoclonal antibody testing, in the event that the preliminary diagnosis is incorrect or further subclassification is desired. However, Nguyen et al. (29) found that morphologic misinterpretation often occurred, leading to incorrect panel selection. These authors suggested setting up two large standard panels, designated blood/bone marrow/spleen panel and tissue/fluid panel, respectively.


TABLE 6.3


Cell Specificity and Clinical Application of Common Monoclonal Antibodies


Cluster Designation


Monoclonal Antibodies


Cell Specificity


Clinical Application


CD1a


Leu6, OKT6, T6


Thymocyte, Langerhans cells


T-ALL, T-lymphoma, histiocytosis


CD2


Leu5, OKT11, T11


E-rossette receptor


T-ALL, T- lymphoma


CD3


Leu4, OKT3, T3


T-cell receptor complex


T-ALL, T-lymphoma


CD4


Leu3, OKT4, T4


Helper/inducer T cell


Identification of T subset


CD5


Leu1, OKT1, T1


T-cell, B-cell subset


T-ALL, T/B lymphoma, CLL


CD7


Leu9, OKT16, 3A1


T-cell receptor for IgM-Fc


T-ALL, T-lymphoma


CD8


OKT8, T8


Cytotoxic/suppressor T cell


Identification of T subset


CD10


CALLA, OKBcALLa, J5


Immature B cell and T cell


ALL, B-lymphoma


CD11b


Leu15, OKM1, Mo1


Monocyte, granulocyte, NK cell, T-suppressor cell


AML


CD11c


LeuM5, αS-HCL3


Monocyte, B cell from HCL


AML, HCL


CD13


LeuM7, OKM13, My7


Monocyte, granulocyte


AML


CD14


LeuM3, OKM14, MY4, Mo2


Monocyte, granulocyte


AML


CD15


LeuM1, My1


Monocyte, granulocyte, Reed-Sternberg cell


Hodgkin lymphoma


CD16


Leu11


NK cell, granulocyte, macrophage


NK-cell disorder


CD19


Leu12, OKpanB, B4


B cell


B-ALL, B-lymphoma, CLL


CD20


Leu16, B1


B cell


B-ALL, B-lymphoma, CLL


CD21


CR2, OKB7, B2


Follicular dendritic cell, B cell, C3d


B-lymphoma


CD22


Leu14, OKB22, B3,αS-HCL1


B cell


B-lymphoma, HCL


CD23


B6, Leu20


B cell


B-lymphoma, CLL


CD25


IL-2, OKT26a, Tac


IL-2 receptor on T cell (Tac antigen)


HCL, adult T-cell leukemia


CD30


Ki-1, BerH2


Reed-Sternberg cell, activated T or B cell


Hodgkin lymphoma, anaplastic large cell lymphoma


CD33


LeuM9, My9


Monocyte, granulocyte


AML


CD34


HPCA-1, My10


Hematopoietic progenitor cell


Acute leukemia


CD38


Leu17, OKT10, T10


Plasma cell, activated T or B cell


Myeloma


CD41


J15


Platelet GPIIb/IIIa


Megakaryoblastic leukemia


CD42a,b


HPL14, AN51, 10P42


Platelet GPIX and GPIb


Megakaryoblastic leukemia


CD43


MT-1, Leu22, L60


T-cell, B-cell subset


T- or B-cell lymphomas


CD45


HLE-a, LCA


All leukocytes


Lymphomas, leukemias


CD45RA


MT-2


T-cell, B-cell subset


Follicular lymphoma


CD45RO


UCHL1


T cell, B cell, monocyte, granulocyte


T-lymphoma


CD56


Leu19, NKH-1


NK cell


NK-cell disorder


CD57


Leu7, HNK-1


NK cell, T-cell subset


NK-cell disorder


CD61


10P61, VI-PL2


Platelet GPIIIa


Megakaryoblastic leukemia


CD64


FcrP1, gp75


Monocyte


Monocytic disorder


CD68


KP1, PG-M1


Monocyte, histiocyte


Monocytic/histiocytic tumors


CD71


Tr receptor, OKT9, T9


Activated T/B cell, macrophage


Acute leukemias, lymphomas


CD74


LN2


B cell, monocyte


B-lymphoma


CDw75


LN1


B cell, T-cell subset


B-lymphoma


CD79a


HM47, HM56, JAB117


B cell


B-lymphoma


CD79b


SN8, B29/123, CH3-1


B cell


B-lymphoma


CD103


HML-1, B-ly7


B cell


HCL


CD117


C-kit, stem cell factor receptor


Hematopoietic stem cell


AML


CD138


B-B4, 1D4, F59-2E9, M115


B cell, plasma cell


B-lymphoma, myeloma


FMC-7


B cell


PLL, HCL, B-lymphoma


HLA-DR


B cell, activated T cell, myeloblast, monoblast


B-cell neoplasms


PCA-1


Plasma cell, monocyte, granulocyte


Myeloma


Glycophorin A


Erythroid series


Erythroleukemia


TCR-1, βF-1, WT31


T cell


T-lymphoma/leukemia


TCR-δ1, TCS1, antiδ


T cell


T-lymphoma/leukemia


ALL, acute lymphoblastic leukemia; AML, acute myeloid leukemia; CLL, chronic lymphocytic leukemia; HCL, hairy cell leukemia; IL-2, interleukin 2; NK, natural killer; PLL, prolymphocytic leukemia; Tr, transferrin; Ig, immunoglobulin.


TABLE 6.4


Minimal Monoclonal Antibody Panels for Diagnosis of Hematologic Neoplasms


Panel


Antibodies


B-cell lymphoma/chronic lymphocytic leukemia


κ/λ, CD5/CD19, CD23, CD10, FMC-7


T-cell lymphoma/leukemia


CD3/CD4, CD3/CD8, CD5, CD7, CD25, CD30


Hairy cell leukemia


κ/λ, CD11c/CD22, CD25, CD103, FMC-7


NK lymphoma/leukemia


CD2, CD3/CD4, CD3/CD8, CD16, CD56, CD57


ALL


TdT, CD7, CD10/CD19, CD34, Cµ, κ/λ


AML


MPO, CD7/CD13-CD33, CD14, CD34, CD117, HLA-DR


AML-M6 (erythroleukemia)


AML panel plus glycophorin A


AML-M7 (megakaryoblastic leukemia)


AML panel plus CD41, CD42b, CD61


Myeloma/macroglobulinemia


Surface and cytoplasmic κ/λ, CD5/CD19, CD38/CD138, CD56


MPO, myeloperoxidase; TdT, terminal deoxynucleotidyl transferase; NK, natural killer; ALL, acute lymphoblastic leukemia; AML, acute myeloid leukemia.


Since the early 1980s, thousands of monoclonal antibodies specific for leukocyte-differentiation antigens have been developed. These antibodies are categorized into different functional groups, and those that are reacting to the same epitope are assigned the same cluster designation or differentiator (CD). At the 8th International Workshop on Leukocyte Differentiation Antigens held in Adelaide, Australia, in December 2004, the last CD was CD339 (30). These antibodies have been used mainly on fresh and appropriately frozen cells. However, there has been an increasing number of newly developed antibodies that are reactive with antigens in fixed paraffin-embedded sections (31,32) (see Table 3.2). These antibodies are most helpful in morphologic correlation with immunophenotypes and in retrospective studies. The monoclonal antibodies that are commonly used for immunophenotyping of lymphomas and leukemias are summarized in Table 6.3. The minimal monoclonal antibody panels used in different types of lymphoma and leukemia are listed in Table 6.4.


REFERENCES

1. Rothe G, Schmitz G, Adort D, et al. Consensus protocol for the flow cytometric immunophenotyping of hematopoietic malignancies. Leukemia. 1996;10:877-895.

2. Taylor CR. Result of multiparameter studies of B-cell lymphomas. Am J Clin Pathol. 1979;72(suppl):670-686.

3. Samoszuk MK, Krailo M, Yan QH, et al. Limitations of numerical ratios for defining monoclonality of immunoglobulin light chains in B-cell lymphomas. Diagn Immunol. 1985;3:133-138.

4. Sun T, Susin M, Desner M, et al. The clonal origin of two cell populations in Richter’s syndrome. Hum Pathol. 1990;21: 722-728.

5. Sun T, Susin M. A practical approach to immunophenotyping of lymphomas: comparison of immunohistologic and immunocytologic techniques. Ann Clin Lab Sci. 1987;17: 14-16.

6. Picker LJ, Weiss LM, Medeiros LJ, et al. Immunophenotypic criteria for the diagnosis of non-Hodgkin’s lymphoma. Am J Pathol. 1987;128:181-201.

7. Longacre TA, Foucar K, Crago S, et al. Hematogones: a multiparameter analysis of bone marrow precursor cells. Blood. 1989;73:543-552.

8. Davis RD, Longacre TA, Cornbleet J. Hematogones in the bone marrow of adults: immunophenotypic features, clinical settings, and differential diagnosis. Am J Clin Pathol. 1994;102:202-211.

9. Leitenberg D, Rapeport JM, Smith BR. B-cell precursor bone marrow reconstitution after bone marrow transplantation. Am J Clin Pathol. 1994;102:231-236.

10. Sun T, Ngu M, Henshall J, et al. Marker discrepancy as a diagnostic criterion for lymphoid neoplasms. Diagn Clin Immunol. 1988;5:393-399.

11. Thakhi A, Edinger M, Myles J, et al. Flow cytometric immunophenotyping of non-Hodgkin’s lymphomas and related disorders. Cytometry. 1996;25:113-124.

12. Jennings CD, Foon KA. Recent advances in flow cytometry, application to the diagnosis of hematologic malignancy. Blood. 1997;90:2863-2892.

13. Ward MS. The use of flow cytometry in the diagnosis and monitoring of malignant hematological disorders. Pathology. 1999;31:382-392.

14. Knowles DM. Immunophenotypic markers useful in the diagnosis and classification of hematopoietic neoplasms. In: Knowles DM, ed. Neoplastic Hematopathology. 2nd ed. Philadelphia: Lippincott Williams & Wilkins; 2001:93-226.

15. Freeman AS, Nadler LM. Immunologic markers in nonHodgkin’s lymphoma. Hematol Oncol Clin North Am. 1991;5: 871-889.

16. Horst E, Meijer CJML, Radaszkiewicz T, et al. Adhesion molecules in the prognosis of diffuse large-cell lymphoma. Expression of a lymphocyte homing receptor (CD44), LFA-1 (CD11a/18), and ICAM-1 (CD54). Leukemia. 1990;4:595-599.

17. Pals ST, Horst E, Ossekoppels GJ, et al. Expression of lymphocyte homing receptor as a mechanism of dissemination in non-Hodgkin’s lymphoma. Blood. 1989;73:885-888.

18. Carlos TM, Harlan JM. Leukocyte-endothelial adhesion molecules. Blood. 1994;84:2068-2101.

19. Gendes J, Lemke H, Baisch H, et al. Cell cycle analyses of a cell proliferation-associated human nuclear antigen defined by the monoclonal antibody Ki-67. J Immunol. 1984;133: 1710-1715.

20. Garcia RL, Coltrera MD, Gown AM. Analysis of proliferative grade using anti-PCNA/cyclin monoclonal antibodies in fixed embedded tissues. Am J Pathol. 1989;134:733-739.

21. Stewart CC, Behm FG, Carey JL, et al. U.S. Canadian consensus recommendations on the immunophenotypic analysis of hematologic neoplasia by flow cytometry: selection of antibody combinations. Cytometry. 1997;30:231-235.

22. Verwer B, Terstappen L. Automatic lineage assignment of acute leukemia by flow cytometry. Cytometry. 1993;14: 862-875.

23. Diamond LW, Ngyen DT, Andreeff M, et al. A knowledge based system for the interpretation of flow cytometry data in leukemias and lymphomas. Cytometry. 1994;17:266-271.

24. Thews O, Thews A, Huber C, et al. Computer assisted interpretation of flow cytometry data in hematology. Cytometry. 1996;23:140-149.

25. Nguyen AN, Milam JD, Johnson KA, et al. A relational database for diagnosis of hematopoietic neoplasms using immunophenotyping by flow cytometry. Am J Clin Pathol. 2000;1113:95-106.

26. Kurtin PJ, Hobday KS, Ziesmer S, et al. Demonstration of distinct antigenic profiles of small B-cell lymphomas by paraffin section immunochemistry. Am J Clin Pathol. 2001;115:136-142.

27. Kaleem Z, White G, Wollmer RT. Critical analysis and diagnostic usefulness of limited immunophenotyping of B-cell non-Hodgkin lymphomas by flow cytometry. Am J Clin Pathol. 2001;115:136-142.

28. Garcia DP, Rooney MT, Ahmad E, et al. Diagnostic usefulness of CD23 and FMC-7 antigen expression patterns in B-cell lymphoma classification. Am J Clin Pathol. 2001;115: 258-265.

29. Nguyen D, Diamond LW, Braylan RC. Flow Cytometry in Hematopathology: A Visual Approach to Data Analysis and Interpretation. Totowa, NJ: Humana Press; 2003.

30. Zola H, Swart B, Nicholson I, et al. CD molecules 2005: human cell differentiation molecules. Blood. 2005;106:3123-3126.

31. Perkins SL, Kjeldsberg CR. Immunophenotyping of lymphomas and leukemias in paraffin-embedded tissues. Am J Clin Pathol. 1993;99:363-373.

32. Dabbs D. Diagnostic Immunohistochemistry. 2nd ed. Philadelphia: Churchill Livingstone; 2006.


CASE 1 Chronic Myelogenous Leukemia


CASE HISTORY

A 59-year-old man was admitted to the hospital because of marked leukocytosis found incidentally on routine work-related physical examination. He was otherwise asymptomatic. He denied having fevers, chills, night sweats, weight loss, and other constitutional symptoms. Physical examination on admission showed no hepatosplenomegaly and no lymphadenopathy. He is a radiation health safety officer and was estimated to have 25 rads lifetime exposure. His half-sister died of leukemia at young age.

Peripheral blood examination revealed a total leukocyte count of 42,300/µL with 56% segmented neutrophils, 9% bands, 2% metamyelocytes, 5% myelocytes, 1% blasts, 19% lymphocytes, 3% monocytes, 2% eosinophils, and 3% basophils. His hematocrit was 50.6%, hemoglobin 16.4 g/dL, and platelets 463,000/µL.

A bone marrow biopsy showed 0.5% myeloblasts, 2.3% promyelocytes, 21.8% myelocytes, 8% metamyelocytes, 15% bands, 27% segmented neutrophils, 1.5% monocytes, 4.8% eosinophils, 4.8% basophils, 1.8% pronormoblasts, 1.3% basophilic normoblasts, 2.8% polychromatophilic normoblasts, and 8.3% orthochromatophilic normoblasts. The M/E ratio was 6:1. No myelodysplastic changes were demonstrated.

A core biopsy showed 90% cellularity with a widened cuff of immature myeloid cells along the bony trabeculae. The cellular component is predominantly myeloid cells. However, trilineage hematopoiesis was still present. A diagnosis of chronic myelogenous leukemia (CML) was established by flow cytometry (FC) and fluorescence in situ hybridization (FISH).

The patient was treated promptly with Gleevac. In a 3-month follow-up, the total leukocyte count returned to 4,850/µL with normal hematocrit, hemoglobin, and platelets. FISH analysis revealed no fusion signals. A bone marrow transplant is planned for the patient.


FLOW CYTOMETRY FINDINGS

Flow cytometric analysis of the bone marrow showed myeloperoxidase 78%, CD13-CD33 79%, human leukocyte antigen (HLA)-DR 20%, CD34 13%, CD117 43%, CD14 0%, and CD7 0% (Fig. 6.1.1).


MOLECULAR GENETICS

FISH for breakpoint cluster region/Ableson (BCR/ABL) was performed, which showed fusion signals in 79% of cells.


DISCUSSION

CML was first reported in two patients in 1845, but it was not until 1960 that the association of CML with the Philadelphia chromosome (Ph’) was identified (1). The karyotype of t(9;22)(q34;;q11) was reported in 1973, and the molecular characterization of the BCR/ABL fusion gene was established in the 1980s.

CML is now recognized as a clonal myeloproliferative disorder that originates in a hematopoietic stem cell. Therefore, it involves not only the myeloid cells but also monocytes, erythrocytes, megakaryocytes, and lymphocytes. Its stem cell origin is evidenced by the occurrence of blasts of various cell lineages during the blast crisis and by the demonstration of BCR/ABL fusion products in different kinds of cells (2, 3, 4 and 5). This is the first hematologic neoplasm in which the association between cytogenetic aberration and leukemogenesis is established. It is one of the most common leukemias, accounting for 15% of leukemias in adults (2).


Morphology

Clinically, CML is divided into three phases: chronic, accelerated, and blast, which can be identified through morphology. In the chronic phase, the peripheral blood shows leukocytosis, usually over 50,000/µL and most cases exceed 100,000/µL (6,7). The leukocytes are mainly composed of granulocytes of various stages, from myeloblasts to segmented neutrophils, but the major population is composed of myelocytes and segmented neutrophils (Fig. 6.1.2). This phenomenon is sometimes referred to as myelocyte bulge and is characteristic of CML. Peripheral basophilia, in addition to granulocytosis, is probably the most important finding for a morphologic diagnosis of CML because it helps to distinguish reactive granulocytosis. However, the absence of basophilia does not exclude CML. Eosinophilia is also a common feature in CML, but it can also be seen in allergy and many other reactive conditions, so its presence is not specific.

The blast count in the chronic phase is <3%, and the percentage of blasts and promyelocytes combined is <10% (7). The percentage of monocytes is usually below 3%, but, due to the high leukocyte count, an absolute monocytosis may be present (5). The platelet count is usually elevated, and its morphology is often normal. In the minority of cases, giant platelets or platelets with decreased or absent granules may be present. Most patients have mild anemia, but the red cell morphology is essentially normal. Nucleated red blood cells may be detected in the peripheral blood in a small number of cases.

The bone marrow features are similar to those of the peripheral blood with a wide spectrum of myeloid cells
(Fig. 6.1.3) (5, 6 and 7). However, these cells are usually more immature than those in the blood, showing more promyelocytes and myelocytes. Blasts are usually <5% in the bone marrow. Myelodysplastic changes are not seen in the chronic phase. Megakaryocytes are increased and are characteristically microcytic and hypolobated (Figs. 6.1.4 and 6.1.5). In some cases, megakaryocytic hyperplasia is so prominent that some authors designated it Ph’-positive essential thrombocythemia (7). The degree of myelofibrosis is usually proportional to megakaryocytosis, and reticulin fiber
is increased in up to 40% of CML patients (5). Erythrocyte precursors are generally decreased, resulting in an M/E ratio as high as 10:1. Sea-blue histiocytes and pseudo-Gaucher cells (Fig. 6.1.6) are frequently present because of an increase of cell turnover. The bone marrow biopsy shows marked hypercellularity with granulocytosis and megakaryocytosis (Fig. 6.1.7). The immature myelocytes normally reside along the bony trabeculae and form a 2- to 3-cell layer. In CML cases, the paratrabecular cuff of immature myelocytes may become widened to up to a 5- to 10-cell layer (5).


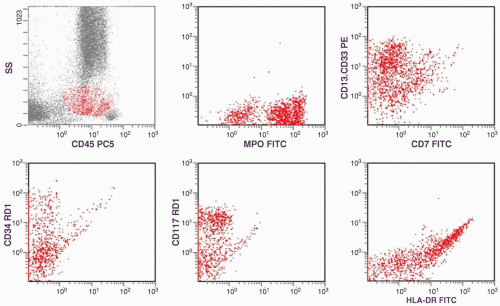
FIGURE 6.1.1 Flow cytometric analysis shows positive myeloperoxidase and CD13-CD33; partially positive CD34, CD117, and human leukocyte antigen (HLA)-DR reactions; but negative CD7 reaction. FITC, fluorescence in situ hybridization; PE, phycoerythrin; MPO, myeloperoxidose.


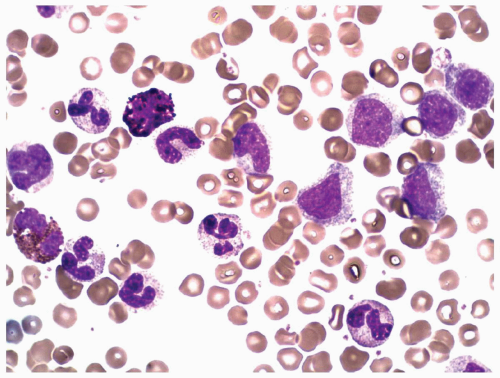
FIGURE 6.1.2 Peripheral blood smear from a patient with chronic phase of chronic myelogenous leukemia (CML) shows predominantly myelocytes and segmented neutrophils. A basophile and an eosinophil are also seen. Wright-Giemsa, 100× magnification.


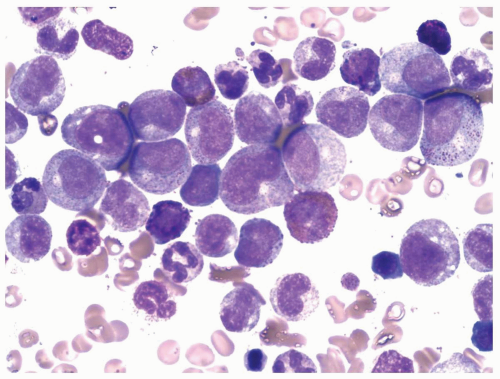
FIGURE 6.1.3 Bone marrow aspirate from a patient with chronic phase of chronic myelogenous leukemia (CML) shows predominantly promyelocytes and myelocytes with a few eosinophils and basophils. Wright-Giemsa, 100× magnification.


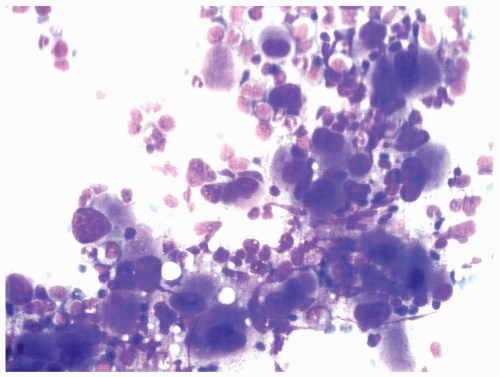
FIGURE 6.1.4 Bone marrow aspirate from a patient with chronic myelogenous leukemia (CML) shows a large cluster of megakaryocytes. Most megakaryocytes are mononucleated or hypolobated microcytic forms. Wright-Giemsa, 100× magnification.

The progress from chronic phase to accelerated phase is indicated by one or more of the following criteria as defined by the World Health Organization (WHO) (5): (i) a blast count in the peripheral blood and/or bone marrow between 10% and 19% (Fig. 6.1.8); (ii) peripheral blood basophils 20% or above; (iii) persistent thrombocytopenia (<100,000/µL) unrelated to therapy, or persistent thrombocytosis (>1,000,000/µL) unresponsive to therapy; (iv) increasing spleen size and increasing leukocyte count unresponsive to therapy; and (v) cytogenetic evidence of clonal evolution. Marked myelodysplasia and prominent megakaryocytic proliferation with microcytic and hypolobated forms are also suggestive of accelerated phase. However, they have not yet been established as independent indicators of accelerated phase. In addition, nucleated erythrocytes are more frequently seen in the peripheral blood, and reticulin or collagen fibrosis is more prominent in the bone marrow than in the chronic phase.


FIGURE 6.1.5 Bone marrow biopsy from a patient with chronic myelogenous leukemia (CML) reveals megakaryocytic proliferation. Hematoxylin and eosin, 40× magnification.


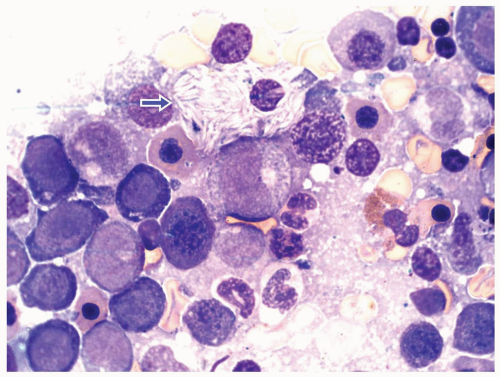
FIGURE 6.1.6 Bone marrow aspirate from a patient with chronic myelogenous leukemia (CML) reveals a peudo-Gaucher cell (arrow). 100× magnification.


FIGURE 6.1.7 Bone marrow biopsy from a patient with chronic phase of chronic myelogenous leukemia (CML) shows widening of the paratrabecular cuff of immature myeloid cells. Hematoxylin and eosin, 40× magnification.


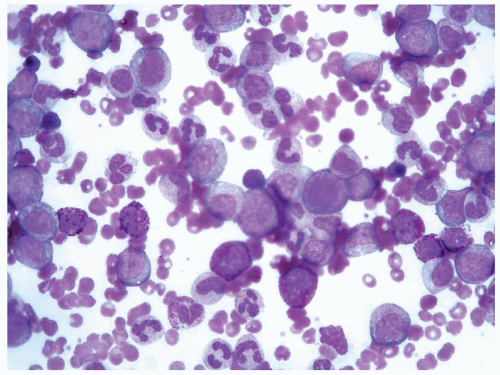
FIGURE 6.1.8 Peripheral blood from a patient with accelerated phase chronic myelogenous leukemia (CML) reveals an increased number of blasts with the presence of eosinophils and basophils. Wright-Giemsa, 100× magnification.

The blast phase is defined as the presence of 20% or more blasts in the peripheral blood and/or bone marrow (Fig. 6.1.9) (4,5). However, blast phase is also indicated when large clusters of blasts are demonstrated in the bone marrow biopsy (Fig. 6.1.10) (5). Under unusual conditions, high blast count is not demonstrated in the peripheral blood or bone marrow, but extramedullary blast proliferation is present (8). This phenomenon was considered to be a predisposing condition of blast crisis, but it is now defined as one of the manifestations of blast phase (5).

In the blast phase, basophilia is still present, but cytopenia occurs in cell lines other than myeloid. Myelodysplastic changes become more prominent in blast crisis than in accelerated phase. About two thirds of the cases are of myeloblastic crisis and one third lymphoblastic. However, monoblastic, megakaryoblastic, promyelocytic, erythroblastic, and multilineage blastic crises have been reported. The identification of the blasts frequently requires immunophenotyping.


FIGURE 6.1.9 Bone marrow aspirate from a patient with blast phase chronic myelogenous leukemia (CML) shows 90% of blasts. Wright-Giemsa, 40× magnification.


FIGURE 6.1.10 Bone marrow biopsy from a patient with blast phase chronic myelogenous leukemia (CML) shows total replacement of normal hematopoietic cells by the blasts. Hematoxylin and eosin, 40× magnification.


Immunophenotyping

Immunophenotyping does not play an important role in the initial diagnosis or in therapeutic monitoring. A definitive diagnosis and follow-up of the patients depend on the demonstration of t(9;22) or the bcr-abl fusion product.

FC may demonstrate a myeloid population with positive CD13, CD15, CD33, and myeloperoxidase (5). Except in the blast phase, lymphoid and monocyte antigens are generally negative. This immunophenotype is not specific because it cannot distinguish CML from leukemoid reaction. However, immunophenotype can help to distinguish various phases of CML. A flow cytometric study showed that the range of CD34-positive cells is 0% to 26% in the chronic phase, 6% to 64% in the accelerated phase, and 27% to 97% in blast phase (9). An immunohistochemical study revealed the ranges of CD34-positive cells to be 0.1% to 1.1% in the chronic phase, 2.8% to 10.0% in the accelerated phase, and 0.6% to 98% in the blast phase (10). However, due to the small sample size, the difference between the accelerated phase group and the blast phase group was not statistically significant. CD117 is also positive in CML cases, proportional to the blast count. However, no systematic study of CD117 in CML has been reported.

Immunophenotyping is most useful in the distinction between different blasts. CD34 may identify both myeloblasts and lymphoblasts, but CD117 is positive only in myeloblasts. Lymphoblasts are positive for terminal deoxynucleotidyl transferase and CD10; the latter is mainly seen in B lymphoblasts. This distinction is very important because the treatment and prognosis of patients with myeloblast crisis and lymphoblast crisis are markedly
different. The megakaryoblasts can be identified by CD41, CD42, and CD61, and the erythroblasts can be identified by glycophorin A and hemoglobin A staining.


Comparison of Flow Cytometry and Immunohistochemistry

Both FC and immunohistochemistry are not very useful in the initial diagnosis of CML because the immunophenotypes between CML and leukemoid reaction are very similar if the blast count is not high in the CML case. The timehonored test of leukocyte alkaline phosphatase (LAP) score, in contrast, is very useful as a screening technique in distinguishing these two entities. The cytoplasmic granules in the granulocytes of CML cases have low LAP activities, thus the score is lower than the normal granulocytes in leukemoid reaction. However, the LAP activity is inhibited by anticoagulants; therefore, the blood for the test has to be obtained by finger stick and a smear is to be made immediately. This is one of the reasons that the LAP score is not frequently performed. Naturally, it is more convenient for the clinician to order the sophisticated molecular genetic tests (e.g., FISH) for a prompt diagnosis, and the screening test is usually skipped.


Molecular Genetics

CML is characterized by the presence of t(9;22)(q34;q11) as detected by conventional karyotyping in 95% of patients. The shortened chromosome 22 was originally called the Ph’ chromosome, a term that is still used today. This genotype has now been verified by molecular biology as the translocation of a proto-oncogene, ABL, on chromosome 9 to juxtapose the BCR gene on chromosome 21. As a result, a BCR/ABL fusion transcript is formed, and its product (a fusion bcr/abl protein) acts as a constitutively active cytoplasmic tyrosine kinase. Because the breakpoint in the BCR gene can be at the minor BCR (m-bcr), major BCR (M-bcr), or micro-bcr, the fusion proteins are sized at 190, 210, and 230 kd, respectively.

All typical CML cases express a 210-kd bcr/abl. A subgroup of CML expressed a larger 230-kd bcr/abl fusion protein and showed clinically a lower white cell count and slower progression than the typical CML (11). This subgroup has been reclassified recently as chronic neutrophilic leukemia (12,13). Ph’-positive acute lymphoblastic leukemia (ALL) cases express either a 210-kd or a 190-kd bcr/abl protein. In childhood ALL, 80% of patients carry the 190-kd bcr/abl protein (13).

The role that the bcr/abl protein plays in CML leukemogenesis is complicated. For this aspect, the reader is referred to several excellent review articles (1, 2 and 3,14, 15, 16 and 17). In this section, only several well-established theories are briefly summarized. First, bcr/abl protein can transform hematopoietic cells in vitro so that their growth and survival become independent of cytokines. The mechanism is through its tyrosine kinase activity to phosphorylate the tyrosine residues of several substrates (1,3,18). As a result, multiple signal transduction cascades affecting cell growth, differentiation, adhesion, and death are activated. These cells then escape normal constraints on growth and become leukemic. Second, bcr/abl protein can protect hematopoietic cells from programmed cell death (apoptosis) in response to cytokine withdrawal and DNA damage (1, 2, 3 and 4,14, 15, 16 and 17,19). This effect is dependent on tyrosine kinase activity of the bcr/abl protein and is reported to be associated with the activation of the Ras gene (14). As a result, these cells become immortal. In contrast, because apoptosis does not occur after DNA damage in CML cells, the accumulated mutations in CML cells may finally lead to blast crisis (14,19). Third, defective adherence of immature hematopoietic CML cells to marrow stroma cells and extracellular matrix may facilitate their release into the blood and home to extramedullary locations or trap inside the blood compartment (1,14,15).

At the time of transformation to the accelerated and blast phases, cytogenetic evolution occurs in 50% to 80% of patients (2,5). The most common change is trisomy 8. In myeloblast crisis, double Ph’ chromosome, trisomy 8, trisomy 19, or isochromosome i(17q) may occur (7). The association between trisomy 8 and c-Myc overexpression and between isochromosome i(17q) and p53 mutation were suspected but have not been established (19). In contrast, the pathologic effects are more clear in t(3;21)(q26;q22) associated with expression of the AML-1/EVI-1 fusion protein and t(7;11)(9p15;p15) associated with expression of the NUP98/HOXA9 fusion protein (19). In addition, deletion or inactivation of tumor suppression genes, such as p53, RB1, and p16, have also been associated with blast crisis in CML (2,15). As p53 is genetically or functionally inactivated in a large fraction of CML cases in blast phase, it obviously plays an important role in CML blast crisis (2,19).

One of the most obvious differences between the normal abl protein and the bcr/abl fusion protein is their subcellular locations (1). The abl protein is located in both the nucleus and cytoplasm, but the bcr/abl fusion protein is located exclusively in the cytoplasm. In contrast, the vast majority of secondary changes involve genes encoding nucleuslocalized proteins that regulate gene transcription (19). It is interesting that when imatinib inhibits the bcr/abl tyrosine kinase in vitro, the bcr/abl protein may enter into the nucleus of the culture cells (1). Therefore, it appears that the aberration of the genes that encode the nucleus-localized proteins, the subcellular location of bcr/abl fusion protein, and the progression of the disease are related sequences.

The current case showed leukocytosis with immature myeloid cells and basophilia in the peripheral blood that led to the suspicion of CML. The high M/E ratio and disproportional high percentage of myelocytes in the peripheral blood and bone marrow also supported the diagnosis. Finally, it was the identification of bcr-abl fusion product by FISH that established a diagnosis of CML. Although the total leukocyte count below 50,000/µL and the absence of splenomegaly are in favor of leukemoid reaction, the presence of many immature myeloid cells, particularly myeloblasts, in the peripheral blood makes leukemoid reaction the unlikely diagnosis. The FISH result is decisive in excluding this entity. If bcr/abl fusion product is not detected, myelodysplastic/myeloproliferative diseases should be considered. The atypical chronic myeloid leukemia may have similar morphology in the peripheral
blood and bone marrow, but the bone marrow should reveal prominent myeloid dysplasia. Chronic myelomonocytic leukemia may also show similar features, but there should be high monocyte counts in both peripheral blood and bone marrow with marked myelodysplastic changes.


TABLE 6.1.1


Salient Features for Laboratory Diagnosis of Chronic Myelogenous Leukemia


1.


Leukocytosis: 50,000 to 100,000/µL


2.


Wide spectrum of myeloid cells with myelocyte bulge, basophilia, and eosinophilia in the peripheral blood


3.


Hypercellular bone marrow with particular increase in myelocytes or promyelocytes, basophilia, and eosinophilia


4.


Blast count: chronic phase <5%; accelerated phase 10% to 19%; blast phase >20%


5.


Immunophenotype: Positive for CD13, CD15, and CD33, and increased CD34 and CD117 proportional to blast counts


6.


Cell lineage of blasts should be determined by flow cytometry or immunohistochemistry.


7.


Low leukocyte alkaline phosphatase (LAP) score


8.


Philadelphia chromosome, t(9;22) demonstrated by karyotyping


9.


Breakpoint cluster region/Ableson (BCR/ABL) gene/messenger RNA/protein detected by molecular biology techniques


The salient features for laboratory diagnosis of CML are summarized in Table 6.1.1.


Clinical Manifestations

CML is usually seen in patients between 40 and 60 years old, with a median age of 53 years (6,14). The male/female ratio is about 1.4:1. About 40% of patients are asymptomatic, and 50% of patients are diagnosed by routine testing (3). Therefore, most (85%) cases are diagnosed in the chronic phase. Some patients may have a history of radiation exposure or previous chemotherapy, but the cause of CML in most patients is unknown.

The chronic phase is manifested by an indolent clinical course. The symptoms are usually nonspecific, including fatigue, malaise, headache, weight loss, and anorexia. About 50% of patients have splenomegaly caused by extramedullary hematopoiesis (3,13). The high leukocyte number may cause leukostasis. If the patient has a high basophil count, he or she may have flushing secondary to hyperhistaminemia (14). However, the initial diagnosis is usually not based on clinical symptoms, but is due to a high leukocyte count with a wide spectrum of immature myeloid cells and increased numbers of basophils and eosinophils.

The chronic phase may persist for 3 to 5 years and progress to accelerated and blastic phases (2). The accelerated phase may last for 1 year (18). When the patient reaches the blast phase, the median survival is about 18 weeks. The life expectancy of CML patients is about 4 years. However, about 10% of patients may survive for more than 8 years.

A form of atypical CML has been identified (6,7,20,21). Patients with this form have granulocytosis, sometimes monocytosis, but no Ph’ and BCR/ABL rearrangement. However, nonrecurrent cytogenetic abnormalities are present in most cases. Its characteristic laboratory findings include marked myeloid dysplasia and erythroid hypoplasia in the bone marrow. Its prognosis is significantly worse than CML. Therefore, atypical CML is considered a separate entity and is classified under myelodysplastic/myeloproliferative disease in the WHO classification (5).

Pediatric patients may have the adult form of CML or juvenile myelomonocytic leukemia (JMML). JMML is Ph’ negative, but some cases may show other nonspecific cytogenetic abnormalities (6,22,23). These patients have leukocytosis, monocytosis, thrombocytopenia, and hepatosplenomegaly. The distinguishing features of JMML include frequent skin infiltration and elevation of fetal hemoglobin. The in vitro colony-forming assays, showing abundant spontaneous colony growth, 95% inhibition of colony by antibodies to granulocyte macrophage colony-stimulating factor, and hypersensitivity to granulocyte macrophage colony-stimulating factor, are relatively specific for the diagnosis of JMML. JMML is classified under myelodysplastic/myeloproliferative disease in the WHO classification (5).

The adult form of chronic myelomonocytic leukemia is similar to JMML in clinical and laboratory aspects (4,24). The reader is referred to Case 3 for a detailed discussion.

As mentioned before, the initial diagnosis may be based on the examination of the peripheral blood. The LAP score may help to distinguish the chronic phase of CML from a leukemoid reaction. However, in the accelerated and blast phase, the LAP score may become gradually increased. Thus these two entities should be distinguished on multiple morphologic parameters (Table 6.1.2) (6,7,25). A definitive diagnosis, however, depends on the identification of karyotype by conventional cytogenetics or bcr/abl fusion product by molecular cytogenetic techniques (14,15,26).

The Southern blot analysis is able to identify the rearranged BCR gene (Fig. 6.1.11). The Western blot analysis can detect the bcr/abl protein. The FISH technique can detect the fusion gene in interphase and/or metaphase nuclei (Fig. 6.1.12) (27). This technique can be applied to dried smears of peripheral blood and bone marrow, and it is the method of choice for initial diagnosis as it can identify the fusion product in 100% of CML cases (5). The conventional karyotyping can only identify 95% of CML cases because of the existence of cryptic translocation (1,5,16). However, it is able to demonstrate additional cytogenetic aberrations and is thus particularly useful in identifying patients transforming from chronic phase to accelerated or blast phase (5).

The most sensitive technique is the reverse transcriptase-polymerase chain reaction (RT-PCR), which is used to detect BCR/ABL messenger RNA transcript. The nested RT-PCR is even more sensitive than RT-PCR (21). However, the qualitative RT-PCR techniques are
labor-intensive and difficult to standardize. Therefore, they have been gradually replaced by the quantitative real-time PCR techniques, using either the TaqMan or LightCycle system (28,29).


TABLE 6.1.2


Comparison between Chronic Myelogenous Leukemia (CML) and Leukemoid Reaction


CML


Leukemoid Reaction


Leukocyte count


Near 100,000/µL


Below 50,000/µL


% Promyelocytes/myelocytes


Higher


Lower


Blasts


Present


Absent


Basophilia


Present


Absent


Cytotoxic granules


Absent


Present


Myeloid/erythroid ratio


Near 10:1


Below 10:1


Leukocyte alkaline phosphatase (LAP) score


Low


High


Splenomegaly


Frequently present


Usually absent


Philadelphia chromosome


Present


Absent


Breakpoint cluster region-Ableson (BCR-ABL) fusion product


Present


Absent


For therapeutic monitoring, it is recommended that karyotyping or FISH is used in the early phase of treatment. When Ph’ is no longer detectable, serial quantitative PCR studies should be performed at approximately 3-month intervals (29).


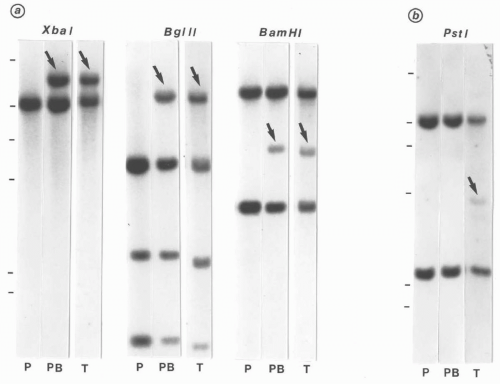
FIGURE 6.1.11 A: Southern blot hybridization analysis of DNA from peripheral blood (PB) and tumor tissue (T) with transprobe-1 (for breakpoint cluster region [BCR] or Philadelphia chromosome) showing identical rearrangement bands (arrows) after digestion with XbaI, BglII, and BamHI. P, placental control. B: Same tissues reacted with T-cell receptor β chain probe showing a faint rearranged band (arrow) in tumor tissue (T) after PstI digestion. (From Sun T, Susin M, Koduru P, et al. Extramedullary blast crisis in chronic myelogenous leukemia. Cancer. 1991;68:605-610, with permission.)

During the chronic phase, cytoreductive therapy is needed to prevent leukostasis. Hydrourea and busulfan may induce hematologic but not cytogenetic remission (2,3,14). High-dose chemotherapy followed by allogeneic bone marrow transplantation used to be the only means to achieve cytogenetic cure. In patients who are not suitable candidates for bone marrow transplant, the alternative therapy was the use of interferon alfa, which can induce both hematologic and cytogenetic remission in chronic
phase. However, the recent use of BCR/ABL tyrosine kinase inhibitors has revolutionized the treatment of CML (15,30). The most commonly used drug is imatinib mesylate with the trade names of Gleevec in the United States and Glivec in Europe. It competitively binds to the adenosine triphosphate (ATP)-binding site of the BCR-ABL, and inhibits protein tyrosine phosphorylation (31). Imatinib mesylate induces complete cytogenetic responses in up to 90% of patients and major molecular responses in most of them (30).


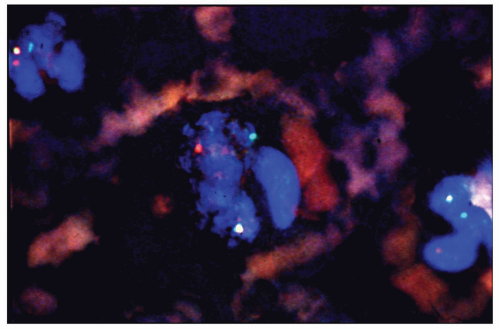
FIGURE 6.1.12 Fluorescence in situ hybridization of peripheral blood from a chronic myelogenous leukemia (CML) patient reacting with breakpoint cluster region (BCR) and Ableson (ABL) probes, showing a green signal (BCR), a red signal (ABL), and a yellow signal, which represents the overlapping of a green and red signal, in all three segmented neutrophils, indicative of BCR-ABL gene fusion product.


REFERENCES

1. Goldman JM, Melo JV. Chronic myeloid leukemia— advances in biology and new approaches to treatment. N Engl J Med. 2003;349:1451-1464.

2. Faderl S, Talpaz M, Estrov Z, et al. The biology of chronic myeloid leukemia. N Engl J Med. 1999;341:164-172.

3. Sawyers C. Chronic myeloid leukemia. N Engl J Med. 1999;340:1330-1340.

4. Anastasi J, Vardiman JW. Chronic myelogenous leukemia and the chronic myeloproliferative diseases. In: Knowles DM, ed. Neoplastic Hematopathology. 2nd ed. Philadelphia: Lippincott Williams & Wilkins; 2001:1745-1790.

5. Vardiman JW, Pierre R, Thiele J, et al. Chronic myelogenous leukemia. In: Jaffe ES, Harris NL, Stein H, Vardiman JW, eds. Tumours of Haematopoietic and Lymphoid Tissues. Lyon, France: IARC Press; 2001:20-26.

6. Bruning RD, McKenna RW. Tumor of the Bone Marrow. Washington, DC: Armed Forces Institute of Pathology; 1994:195-299.

7. Foucar K. Bone Marrow Pathology. Chicago: ASCP Press; 2001:204-213.

8. Sun T, Susin M, Koduru P, et al. Extramedullary blast crisis in chronic myelogenous leukemia. Cancer. 1991;68:605-610.

9. Banavali S, Silvestri F, Hulette B, et al. Expression of hematopoietic progenitor cell associated antigen CD34 in chronic myeloid leukemia. Leuk Res. 1991;15:603-608.

10. Orazi A, Neiman RS, Cualing H, et al. CD34 immunostaining of bone marrow biopsy specimens is a reliable way to classify the phases of chronic myeloid leukemia. Am J Clin Pathol. 1994;101:426-428.

11. Pane F, Frigeri F, Sindona M, et al. Neutrophilic-chronic myeloid leukemia: a distinct disease with a specific molecular marker. Blood. 1996;88:2410-2414.

12. Reilly JT. Chronic neutrophilic leukaemia: a distinct clinical entity? Br J Haematol. 2002;116:10-18.

13. Mauro MJ, Druker BJ. Chronic myelogenous leukemia. Curr Opin Oncol. 2001;13:3-7.

14. Thijsen SFT, Schuurhuis GJ, van Oostveen JW, et al. Chronic myeloid leukemia from basic to bedside. Leukemia. 1999; 13:1646-1674.

15. Deininger MW, Goldman JM, Melo JV. The molecular biology of chronic myeloid leukemia. Blood. 2000;96:3343-3356.

16. Kurzrock R, Kantarjian HM, Druker BJ, et al. Philadelphia chromosome-positive leukemias: from basic mechanism to molecular therapeutics. Ann Intern Med. 2003;138: 819-830.

17. Holyoak TL. Recent advances in the molecular and cellular biology of chronic myeloid leukaemia: lessons to be learned from the laboratory. Br J Haematol. 2001;113:11-23.

18. Kulidas M, Kantarjian H, Talpaz M. Chronic myelogenous leukemia. JAMA. 2001;286:895-898.

19. Calabretta B, Perrotti D. The biology of CML blast crisis. Blood. 2004;103:4010-4022.

20. Hernandez JM, del Canizo MC, Cuneo A, et al. Clinical, hematological and cytogenetic characteristics of atypical chronic myeloid leukemia. Ann Oncol. 2000;11:441-444.

21. Oscier D. Atypical chronic myeloid leukemias. Pathol Biol. 1997;45:587-593.

22. Hess JL, Zutter MM, Castleberry RP, et al. Juvenile chronic myelogenous leukemia. Am J Clin Pathol. 1996;105:238-248.

23. Chomienne C, Cambier N, Baruchel A. Juvenile chronic myelogenous leukemias: molecular and novel therapeutic basis. Pathol Biol. 1997;45:600-604.

24. Vardiman JW. Myelodysplastic/myeloproliferative diseases. In: Jaffe ES, Harris NL, Stein H, Varidman JW, eds. Tumours of Haematopoietic and Lymphoid Tissues. Lyon, France: IARC Press; 2001:47-59.

25. Naeim F. Atlas of Bone Marrow and Blood Pathology. Philadelphia, W. B. Saunders; 2001:53-57.

26. Hochhause A, Weisser A, La Rosee P, et al. Detection and quantification of residual disease in chronic myelogenous leukemia. Leukemia. 2000;14:998-1005.

27. Sinclair PB, Green AR, Grave C, et al. Improved sensitivity of BCR-ABL detection: a triple-probe three-color fluorescence in situ hybridization system. Blood. 1997;90: 1395-1402.

28. Elmaagacli AH, Beelen DW, Opalka B, et al. The amount of BCR-ABL fusion transcripts detected by the real-time quantitative polymerase chain reaction method in patients with Philadelphia chromosome positive chronic myeloid leukemia correlated with the disease stage. Ann Hematol. 2000;79:424-431.

29. Goldman J. Monitoring minimal residual disease in BCR-ABL-positive chronic myeloid leukemia in the imatinib era. Curr Opin Hematol. 2004;12:33-39.

30. Cortes J, Kantarjian H. New targeted approaches in chronic myeloid leukemia. J Clin Oncol. 2005;23:6316-6324.

31. Tsao AS, Kantarjian H, Talpaz M. STI-571 in chronic myelogenous leukaemia. Br J Haematol. 2002;119:15-24.


CASE 2 Myelodysplastic Syndromes


CASE HISTORY

An 81-year-old man was admitted because of abdominal pain and diarrhea for 4 days. The patient claimed that he had had anemia for about 20 years, but he had been asymptomatic until several months prior to admission when he developed shortness of breath, fatigue, and palpitations. He was then found to have pancytopenia, and a bone marrow examination revealed hypocellular bone marrow that was consistent with aplastic anemia. Initial workups, including vitamin B12, folate, and antinuclear antibody screening, were all within normal limits. The patient was a sheet-metal worker with frequent exposure to paint sprays.

Physical examination showed lower abdominal pain localized in the suprapubic area with hyperactive bowel sounds. There was no hepatosplenomegaly, and no peripheral lymph node was palpable. The skin demonstrated no petechiae, ecchymoses, or purpura.

Hematologic workup showed a total leukocyte count of 1,200/µL with 29.9% neutrophils, 60.4% lymphocytes, 5.7% monocytes, 3.2% eosinophils, and 0.8% basophils. The hematocrit was 28%, hemoglobin 9.8 g/dL, mean cell volume (MCV) 103.1 fL, and platelets 40,000/µL. The bone marrow aspirate revealed erythroid and megakaryocytic dysplasia with the presence of 12% myeloblasts.

The patient was treated with intravenous fluids with prompt improvement of abdominal symptoms. He responded well with subsequent administration of erythropoietin and granulocyte-colony-stimulating factor (G-CSF; Neupogen). His peripheral blood cell count before discharge showed a total leukocyte count of 7,600/µL with an absolute neutrophil count of 6,400/µL. His hematocrit was 34.2% and platelets 65,000/µL.


FLOW CYTOMETRY FINDINGS

In the bone marrow aspirate, the following results were obtained: T-cell marker: CD7, 0%. B-cell marker: CD19, 0%. Myeloid markers: CD13-CD33, 84%; CD14, 4%; myeloperoxidase, 30%. Major histocompatibility complex (MHC)-II antigen: human leukocyte antigen-(HLA-DR), 76%. Stem cell markers: CD34, 50%; CD117, 55% (Fig. 6.2.1).


CYTOGENIC FINDING

Cytogenetic analysis of unstimulated cultures revealed an apparently normal GTG banding pattern: 46, XY.


DISCUSSION

Myelodysplastic syndromes (MDS) are a heterogenous group of disorders with ineffective hematopoiesis and myeloid dysplastic changes in the bone marrow and peripheral blood. As a result, the bone marrow is usually hypercellular and the peripheral blood is cytopenic in one or more cell lineages.

MDS are usually seen in elderly persons, who may have normal hematopoiesis under normal condition but may have latent age-associated defects that may lead to the development of MDS when under stress (1). The pathogenesis of MDS may be multifactorial, but apoptosis of myeloid cells before their maturation and release from the bone marrow may play an important role (1,2). Other factors include deficiency in humoral promoters, damage of the microenvironment, loss of the ability of progenitors to respond to stimuli, and replacement of the normal marrow with abnormal clones of hematopoietic cells (1).

The French-American-British (FAB) classification of MDS was first established in 1982 and divided MDS into five categories: (i) refractory anemia (RA), (ii) RA with ringed sideroblasts (RARS), (iii) RA with excess blasts (RAEB), (iv) RAEB in transformation (RAEB-T), and (v) chronic myelomonocytic leukemia (CMML) (3).

The World Health Organization (WHO) classification modified the old classification into six categories (4, 5, 6 and 7). First, the blast count for acute myelogenous leukemia (AML) in the FAB classification was 30%, but recent studies have found that patients with 20% to 30% blasts have the same prognosis as those patients with >30% blasts. In addition, 50% to 60% of patients with RAEB-T evolve to AML within 6 months after initial diagnosis (7). Therefore, the subtype of RAEB-T is now classified as AML. Second, CMML has features of both myelodysplastic syndromes and myeloproliferative disorders, so that it is now classified under myelodysplastic/myeloproliferative diseases. Third, on the basis of the blast count, RAEB is further divided into RAEB-1 and RAEB-2 categories. Finally, three new categories were added: Refractory cytopenia with multilineage dysplasia (RCMD), 5q- syndrome, and MDS, unclassifiable (MDS-U).


Morphology

The criteria for classification are based on both quantitative and qualitative changes (Table 6.2.1) (4, 5, 6, 7, 8, 9, 10, 11 and 12). Quantitatively, the major parameters are the percentages of blasts and monocytes in the bone marrow and the peripheral blood and the percentage of ringed sideroblasts among the erythrocyte precursors. Qualitatively, it is the dysplastic changes seen in different cell lineages. Dysplasia is mainly
manifested as the changes of the configuration and lobulation of the nuclei, the size of the nuclei and of the entire cell, and cytoplasmic granularity.


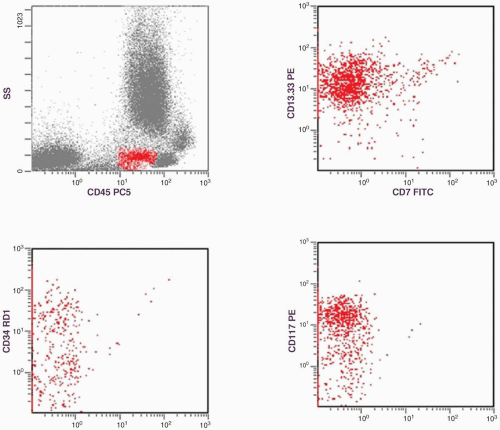
FIGURE 6.2.1 Flow cytometric histograms show the gating of an immature myeloid population with positive reactions to CD13.CD33, CD34, and CD117. This cluster represents the myeloblasts in a case of refractory anemia with excess blasts.


TABLE 6.2.1


Differences in Various Subtypes of MDS


Type


Blasts in Marrow (%)


Blasts in Blood (%)


Ringed Sideroblasts (%)


Dysmyelopoiesis


RA


<5


<1


<15


Erythroid


RARS


<5


<1


>15


Erythroid


RAEB1


5-9


<5


Variable


2-3 lineages


RAEB2


10-19


5-19


Variable


2-3 lineages


RCMD


<5


<1


Variable


Multilineages


MDS, myelodysplastic syndrome; RA, refractory anemia; RARS, RA with ringed sideroblasts; RAEB, RA with excess blasts; RCMD, refractory cytopenia with multilineage dysplasia.


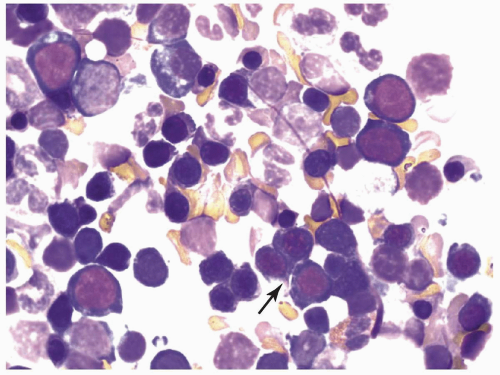
FIGURE 6.2.2 Bone marrow aspirate from a case of refractory anemia shows erythroid hyperplasia with the presence of a cluster of megaloblastoid normoblasts (arrow). Wright-Giemsa stain, 100× magnification.

In the erythroid series, the most common findings are megaloblastoid changes (Fig. 6.2.2) and the presence of ringed sideroblasts (Fig. 6.2.3), which is due to the deposition of iron in the mitochondria of normoblasts. A ringed sideroblast is defined by ≥10 iron granules encircling one third or more of the nuclear circumference in an iron-stained smear. The nuclear configuration can be in a bizarre shape (e.g., budding, internuclear bridging), multilobated, fragmented, or karyorrhetic (Fig. 6.2.4). The cytoplasm may contain inclusions, such as Howell-Jolly bodies and Pappenheimer bodies or vacuoles. The normoblasts may become Periodic acid-Schiff (PAS) positive as contrast to the negative staining in normal nucleated red blood cells. Anisocytosis, poikilocytosis, and nucleated red blood cells may be seen on the peripheral blood smears.


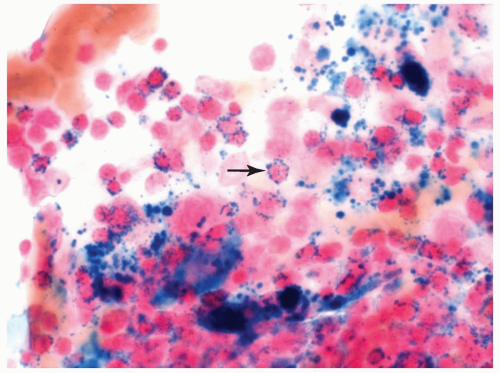
FIGURE 6.2.3 Bone marrow aspirate from a case of refractory anemia with ringed sideroblasts shows many ringed sideroblasts (arrow) in the Prussian blue-stained smear. 100× magnification.


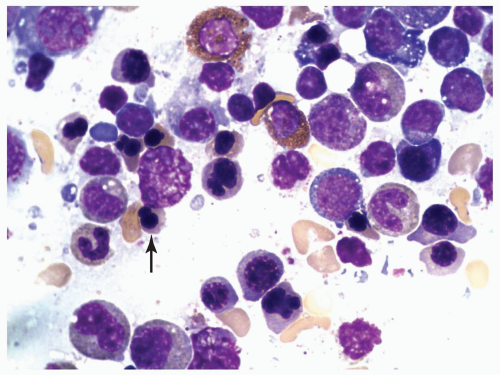
FIGURE 6.2.4 Bone marrow aspirate from a case of refractory anemia with excess blasts shows many dysplastic normoblasts with nuclear budding or bizarre nuclear shapes (arrow). Wright-Giemsa stain, 100× magnification.

In the granulocytic series, the most common findings are hypolobulation and hypogranularity. When a bilobed nucleus is present, those cells are referred to as pseudo-Pelger-Huet cells (Fig. 6.2.5). Hypersegmentation (Fig. 6.2.6), hypergranularity, giant nuclei, or huge cell size are also features of myeloid dysplasia, if vitamin B12 and folate deficiency are excluded. Bizarre nuclear configuration, ringed granulocytic nucleus (Fig. 6.2.7), nuclear fragmentation, and separated nuclear lobes may also occur in some
cases. The presence of pseudo-Chediak-Higashi granules has been reported, but this finding is extremely rare.


FIGURE 6.2.5 Bone marrow aspirate from a case of refractory cytopenia with multilineage dysplasia shows several hypolobated pseudo-Pelger-Huet cells (arrow). Wright-Giemsa stain, 100× magnification.


FIGURE 6.2.6 Bone marrow biopsy from a case of myelodysplastic syndrome, unclassifiable, shows a hypersegmented neutrophil (arrow) and two apoptotic cells (arrow heads). Wright-Giemsa stain, 100× magnification.

In the megakaryocytic series, the most common findings are micromegakaryocytes, hypolobulation, mononucleation, and the presence of naked nuclei (Fig. 6.2.8). The nuclei may be arranged in a bizarre pattern or in widely separated lobes. Hypogranular megakaryocytes can also be demonstrated in some cases.

All of these dysplastic features should be demonstrated in a high-quality and freshly prepared blood or bone marrow smear. If a smear is made >2 hours after specimen collection, the cell morphology can be distorted and it is invalid for estimation of myelodysplasia. Myelodysplastic changes can be seen in many different conditions, such as vitamin B12 or folate deficiency, heavy metal exposure, paroxysmal nocturnal hemoglobinuria, treatment with G-CSF, and congenital hematologic disorders (4). Therefore, a diagnosis of MDS should not be made until other possible causes are excluded. A few dysplastic cells can sometimes be seen in normal persons, thus at least 10% dysplastic cells should be identified in a particular cell lineage before it is called MDS. In some cases of unilineage cytopenia, a diagnosis is difficult to make; those cases should be observed for 6 months before calling it MDS (5).


FIGURE 6.2.7 Bone marrow aspirate from a case of myelodysplastic syndrome, unclassifiable, shows a ringed nucleus in a granulocyte. Wright-Giemsa stain, 100× magnification.


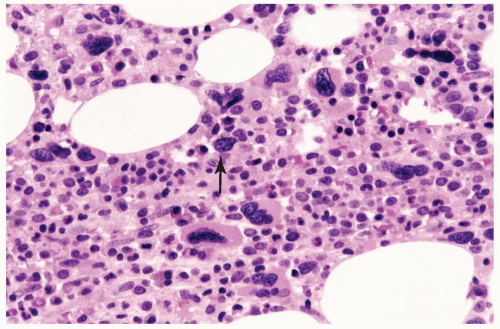
FIGURE 6.2.8 Bone marrow core biopsy from a case of refractory cytopenia with multilineage dysplasia shows many dysplastic megakaryocytes with microcytic and hypolobated morphology. Naked nuclei (arrow) are also present. Hematoxylin and eosin stain, 100× magnification.

Histologic examination of core biopsy is not as helpful as aspirate in providing positive identification of MDS. The most distinguishing feature of MDS in tissue sections is the so-called abnormal localization of immature precursors (ALIP), which is usually presented in high-grade MDS and is associated with a more rapid evolution to acute myeloid leukemia (4,13,14). In normal hematopoiesis, the immature myeloid cells first appear along the paratrabecular zone and gradually move to the intertrabecular area as they become mature. The definition of ALIP is the presence of at least three aggregates of three to more than five myeloblasts and promyelocytes in the intertrabecular area (Fig. 6.2.9). On the contrary, erythroid or megakaryocytic precursors are normally present centrally in the bone marrow. Therefore, the detection of clusters of pronormoblasts and immature megakaryocytes in the intertrabecular areas is called pseudo-ALIP (Fig. 6.2.10). In contrast, it is abnormal to find erythroid precursors and megakaryocytes concentrate in the paratrabecular region, which can be seen in MDS. Although ALIP is characteristic of MDS, it can also be seen in chronic myeloproliferative disorders, posttransplantation bone marrow, or in patients receiving granulocyte growth factors (11).

Cellularity is best evaluated by bone marrow biopsy. Most MDS cases have hypercellularity, and the minority has normocellularity. When the cellularity is <30% in patients <60 years or <20% in patients >60 years, it is classified as
hypocellular MDS, which is highly responsive to immunosuppressive therapy (6).


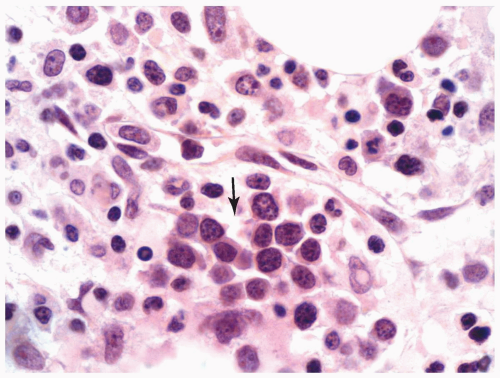
FIGURE 6.2.9 Bone marrow core biopsy from a case of refractory anemia with excess blasts shows a cluster of immature myeloid cells (arrow) in between the bony trabeculae representing abnormal localization of immature precursors (ALIP). Hematoxylin and eosin stain, 100× magnification.

Microscopic examination of the spleen in 13 MDS cases showed four histologic patterns, erythrophagocytosis, extramedullary hematopoiesis, red pulp plasmacytosis, and red pulp monocytosis (15).


FIGURE 6.2.10 Bone marrow core biopsy from a case of refractory anemia with ringed sideroblasts shows a cluster of pronormoblasts (arrow) representing pseudo-abnormal localization of immature precursors (ALIP). The pronormoblasts have regular nuclear contour and erythroid chromatin pattern. The surrounding mature normoblasts also help to identify the erythroid origin of the immature cells. Hematoxylin and eosin stain, 100× magnification.


Refractory Anemia

RA mainly affects the erythroid series. The anemia is usually normochromic and macrocytic but may be normocytic. The granulocytes and platelets are generally normal, but neutropenia and thrombocytopenia may occur in some patients. Blasts are seen in <1% in the peripheral blood and <5% in bone marrow. The bone marrow is usually hypercellular with predominant erythroid precursors. Dyserythropoiesis is inevitably present, but the degree of dysplasia is variable in individual cases. Megaloblastoid changes are frequently seen. The cytoplasm of nucleated erythroid cells is usually PAS positive. Ringed sideroblasts may also be encountered, but they are <15%. Dysplastic changes in granulocytes and megakaryocytes are seldom demonstrated. If the changes are marked, the case should be classified under other categories.

In some cases, the bone marrow may be hypocellular with erythroid hypoplasia resembling aplastic anemia. This condition is more commonly seen in elderly patients. However, the absence of cytopenia in other cell lineage and the increase of immature cells may distinguish hypocellular MDS from aplastic anemia.


Refractory Anemia with Ringed Sideroblasts

RARS is associated with anemia with dimorphic features; hypochromic and normochromic populations are present in the peripheral blood. The red blood cells can be normocytic or macrocytic. Basophilic stippling, Pappenheimer bodies, and nucleated erythrocytes are more frequently demonstrated in the peripheral blood in RARS than in other forms of MDS. The numbers of granulocytes and platelets are normal in most cases, but they may be decreased in some cases. Blasts, if present in peripheral blood, are <1%. The bone marrow is usually hypercellular with predominance of erythroid series. Dyserythropoiesis with megaloblastoid change is present in variable degrees. The major distinction between RARS and RA is the presence of >15% ringed sideroblasts in the bone marrow. Hemosiderin-laden macrophages may be abundant in some cases. Dysplastic changes are absent or mild in myeloid and megakaryocytic series. The number of blasts in the bone marrow is <5%. As in RA, normocellular or hypocellular bone marrow can be demonstrated in rare cases of RARS.


Refractory Anemia with Excess Blasts

RAEB is defined by the presence of 5% to 19% of blasts in the bone marrow and <20% of blasts in the peripheral blood. Because the percentages of blasts in the bone marrow and peripheral blood affects the prognosis of patients (16), RAEB is further classified as RAEB-1 when there are 5% to 10% blasts in the bone marrow and <10% in the blood (4,12). When the bone marrow and blood show 11% to 19% of blasts or Auer rods are seen in the blasts even when the percentage is <11%, it is classified as RAEB-2. Patients with 5% to 19% blasts in the blood and <10% blasts in the bone marrow are also classified as RAEB-2 (4).

RAEB patients are inevitably anemic. The anemia is normochromic and normocytic or macrocytic. Anisopoikilocytosis
is frequently present together with nucleated red blood cells in the peripheral blood. Most patients are pancytopenic with neutropenia and thrombocytopenia. Dysplastic granulocytes and atypical platelets are also present in the peripheral blood.

The bone marrow is hypercellular with panmyeloid hyperplasia. The increase in blasts is usually accompanied by an increase in promyelocytes. Dysplasia can be demonstrated in all cell lineages: Myeloid, erythroid, and megakaryocytes. ALIP is frequently present in this category of MDS. Ringed sideroblasts may be demonstrated in bone marrow, and in some cases may exceed 15% of the nucleated erythrocytes. Cases that show hypocellular bone marrow with erythroid hypoplasia should be distinguished from aplastic anemia. The presence of dysplastic changes in granulocytes and megakaryocytes and the increase in immature cells as demonstrated by CD34 and CD117 should help to distinguish RAEB from aplastic anemia.


Refractory Cytopenia with Multilineage Dysplasia

RCMD shows bicytopenia or pancytopenia and evidence of multilineage dysplasia, but no increases in blasts or monocytes, and no Auer rods are demonstrated. This type of MDS does not fit into any categories of the FAB classification and is designated by the WHO classification as a new entity. The type and degree of dysplastic changes may vary from patient to patient, and no unifying morphologic feature has been established for this category. The ringed sideroblasts are usually <15% of nucleated erythrocytes. If ringed sideroblasts are ≥15%, the case should be classified as RCMD and ringed sideroblasts (RCMD-RS). The bone marrow is hypercellular with bilineage or trilineage hyperplasia, resembling RAEB without an increase in blasts. If blasts are present, they are <5%.


Myelodysplastic Syndrome, Unclassifiable

MDS-U is used for cases that do not satisfy the definition of the above categories. Some patients may have cytopenia but no morphologic evidence of dysplasia. Other patients may have dysplasia in either granulocytic or megakaryocytic cell lines. In those cases, clonal cytogenetic abnormalities associated with MDS may link them to MDS-U. When there is marked erythroid hyperplasia with marked dyserythropoiesis but no abnormalities are demonstrated in the myeloid and megakaryocytic lineage, those cases may be difficult to distinguish from M6b.


MDS Associated with 5q- Syndrome

When cases of MDS are associated with an isolated del(5q) chromosome abnormality, it is classified as a distinct entity by WHO (4). The clinical significance of identifying this particular karyotype is its association with long survival. Cases in which additional karyotypic abnormalities are found should not be included in this entity. The peripheral blood findings include macrocytic anemia, normal to high platelet count, and normal to slightly elevated leukocyte count. The most characteristic finding is dysmegakaryopoiesis in the bone marrow (17). Megakaryocytes are increased with the presence of micromegakaryocytes or hypolobulated or mononucleated megakaryocytes. Dysplastic granulocytes and increased myeloblasts may be encountered. Erythroid series, in contrast, are hypoplastic. Patients with 5q- syndrome have low frequency of leukemic transformation and relatively long survival.


Immunophenotype

Many flow cytometric studies on MDS have been reported, and most studies claimed that a high percentage of MDS cases showed immunophenotypic abnormalities (18, 19, 20, 21 and 22). Other studies claimed that immunophenotype is a good prognosticator correlating well with the International Prognostic Scoring System (IPSS) (23,24). However, these abnormalities are variable from case to case, and characteristic immunophenotypes have not yet been established. Furthermore, a large panel of antibodies is usually required, and many of those antibodies are not commonly used. Many abnormalities are based on the intensity of certain markers or on the abnormal location or distribution of a cell cluster as determined by a pair of antibodies. Therefore, further standardization is necessary before reliable immunophenotypes are established. So far, there are no reliable markers to evaluate erythroid and megakaryocytic series. Thus only selected myelomonocytic markers are discussed in this case.

The immunophenotypes of MDS are usually based on quantitative changes of surface antigens by comparing MDS cases with normal controls. In general, the antigens expressed on normal myeloid precursors (such as CD34, CD117, and HLA-DR) and those on immature granulocytes (such as CD13 and CD33) are increased in MDS (18, 19, 20 and 21). In contrast, antigens that are expressed on mature granulocytes (such as CD10, CD11b, CD11c, CD16, and CD64) are decreased in MDS (18, 19, 20 and 21, 25, 26).

Among all the quantitative changes, CD34 abnormality is most thoroughly studied (19,21,24,27). The percentage of CD34 cells is usually proportional to the number of blasts. Therefore, its percentage increases progressively from RA and RARS to RAEB and leukemic transformation (19). However, not all blasts express CD34, yet immature myeloid cells may show CD34. One study also found that CD34 expression in nonblast myeloid cells was significantly higher in therapy-related MDS than de novo MDS (21). In the study by Xu et al. (21), the percentage of CD34-positive nonblast myeloid cells was 12±15% in MDS cases with normal karyotype, but it was 23±17% in those with cytogenetic abnormalities (21). Qualitative changes are mainly manifested as aberrant expression of nonmyeloid markers, namely, T-cell, B-cell, and natural killer cell markers. CD7 and CD19 can be detected on maturing myeloid cells or monocytes (23). CD56 may be found on myeloblasts (22) and maturing myeloid cells and monocytes (23). Abnormal patterns of CD11b versus CD16 expression or CD13 versus CD16 expression (20,23,28) and abnormal clustering of various cell markers (24) have also been identified in MDS cases. Finally, the low side-scatter property in the nonblastic myeloid cells in MDS cases represents the presence of hypogranular granulocytes (21).


Immunohistochemical staining may help to determine the cell lineage in core biopsy not only in terms of quantity but also in distribution of different cell types. For instance, it may help to distinguish ALIP from pseudo-ALIP.

Myeloid makers that can be used for immunohistochemical stains include myeloperoxidase, lysozyme, elastase, CD15, and CD68 (11,29). Erythrocytes can be identified by hemoglobin A or glycophorins A and C. Megakaryocytes are positive for CD41, CD42b, CD61, and Factor VIII. CD34 and proliferating cell nuclear antigen can be used to identify hematopoietic precursors with a strong myeloid commitment, which is particularly useful to identify true ALIP (29). The demonstration of CD34-positive aggregates, particularly large aggregates, is a predictor for poor prognosis regarding both leukemic transformation and survival. CD117 staining may serve the same function as CD34.

In the current case, the patient had pancytopenia with macrocytic anemia. The bone marrow was hypercellular showing dysplastic changes in erythroid and megakaryocytic cell lines and 12% myeloblasts. The flow cytometry revealed high percentages of CD13, CD33, CD34, and CD117. The constellation of the clinicopathology findings is characteristic of RA with excess blasts. The patient responded well with erythropoietin and G-CSF and was discharged from the hospital promptly. However, the presence of high percentages of CD34 and CD117 in this patient is associated with an unfavorable prognosis.


Comparison of Flow Cytometry and Immunohistochemistry

Flow cytometry may identify quantitative and qualitative abnormalities in MDS cases, even though they are nonspecific and cannot be depended upon for a definitive diagnosis. Immunohistochemistry, in contrast, is used to demonstrate the distribution of various cell types and is helpful to identify ALIP.


Molecular Genetics

The basic phenomenon in MDS is ineffective hematopoiesis. Therefore, it is important to find out the mechanisms that induce such a phenomenon. The most popular hypothesis is an increase of apoptosis in the early phase of MDS, as supported by histochemical, flow cytometric, and biochemical studies (2,30, 31, 32 and 33). A flow cytometric study, using Annexin V to enumerate apoptotic CD34 cells and Ki-67 to enumerate proliferative cells, found that apoptosis was significantly increased in RA, RARS, and RAEB cases (34). However, in RA and RARS, apoptosis always exceeded proliferation, whereas in RAEB, apoptosis was equalized with proliferation. The same study also found that the pro-apoptotic (Bax/Bad) versus antiapoptotic (Bcl-2/Bcl-x) protein ratio was increased in RA/RARS, whereas disease progression was associated with significantly reduced ratio.

Apoptosis may be induced by cytokines such as tumor necrosis factor-α and interferon-γ (30,31). Cell culture studies showed that these cytokines can suppress the growth of hematopoietic progenitors and induce Fas expression on CD34 cells (31). The increase of these cytokines and Fas expression has been demonstrated in some MDS patients. These studies implicate the potential role of the Fas/Fas ligand system in the induction of apoptosis. In clinical practice, the inhibition of apoptosis with hematopoietic growth factors and erythropoietin may benefit in improving the blood counts.

MDS has proved to be a clonal disease by molecular genetic techniques. Cytogenetic abnormalities are frequently demonstrated in MDS patients, approximately 30% to 50% in primary MDS cases and in >80% of therapy-related MDS cases (35). Most of the abnormalities are numerical, such as chromosome 5 and 7 monosomy and deletion of the long arm of chromosomes 5 and 7 (32,35,36). Structural aberrations, such as inversion of chromosome 3 and translocations also occur. Translocations include translocation-Ets-leukemia (TEL) fusion, mixed-lineage leukemia (MLL) fusion, nucleoporin abnormality, ecotropic viral integration/ site (EVI-1) family expression, and others (32).

The International MDS Risk Analysis Workshop divided MDS cases into three prognostic cytogenetic groups (16). Good outcomes were those with normal chromosomes, -Y alone, del(5q) alone, and del(20q) alone. Poor outcomes were associated with complex abnormalities (more than three abnormalities) or chromosome 7 anomalies. Intermediate outcomes were associated with cytogenetic aberrations besides those mentioned above. There are a few chromosome abnormalities that are associated with relatively well-defined morphologic clinical syndromes (12,22).


5q- Syndrome

As mentioned above, 5q- syndrome is designated as a separate entity in the WHO classification of MDS. However, 5q-, either isolated or associated with other cytogenetic abnormalities, is seen in a large variety of hematologic disorders, especially myeloid diseases (17). As a sole abnormality, 5q-syndrome is most frequently seen in MDS and AML, particularly in therapy-induced cases. It is predominantly (68% to 74%) seen in female patients. In MDS cases, 5q- syndrome may be seen in RA, RAEB, and RCMD.


Monosomy 7 Syndrome of Childhood

This syndrome is seen in children ages 6 months to 8 years. It is male predominant. The peripheral blood may show anemia, thrombocytopenia, monocytosis, and leukoerythroblastosis. The bone marrow may present with dysplastic changes in erythroid, granulocytic, and monocytic series. Megakaryocytes are usually normal morphologically but may be decreased in >50% of patients. Myeloblasts may be present in the peripheral blood, but they are usually <2%. In the bone marrow, the range of blasts is between 3% and 11%. Because neutrophils have defective chemotaxis, patients may have recurrent infections. The syndrome shares many clinical and hematologic features with juvenile myelomonocytic leukemia, and their distinction may not be possible in some cases. This syndrome is usually associated with a poor prognosis.


TABLE 6.2.2


Salient Features for Laboratory Diagnosis of MDS


1.


Peripheral cytopenia in 1-3 cell lineages


2.


Dysplasia in 1-3 cell lineages demonstrated in peripheral blood and bone marrow


3.


Usually hypercellular bone marrow


4.


Increased ringed sideroblasts


5.


Increases in myeloid precursor (CD34, CD117, HLA-DR) and immature granulocytic (CD13, CD33) antigens


6.


Decreases in mature granulocytic antigens (CD10, CD11b, CD11c, CD16, CD64)


7.


Aberrant expression of nonmyeloid markers (CD7, CD19, CD56)


8.


Identification of cell lineage and distribution by immunohistochemistry


9.


Cytogenetic abnormalities: numerical changes in chromosomes 3, 5, and 7 most frequent


MDS, myelodysplastic syndrome; CD, cluster of differentiation; HLA-DR, human leukocyte antigen-DR.


del(17p)

This anomaly is associated with a particular type of dysgranulopoiesis characterized by small neutrophils with pseudo-Pelger-Huet nuclei and cytoplasmic vacuoles. Some mature neutrophils show completely nonlobulated nuclei. These patients usually have a high incidence of p53 mutation and an unfavorable prognosis.


inv(3)(q21-26)

Patients with this abnormality usually have normal or increased platelet counts in the peripheral blood and dysmegakaryocytosis in the bone marrow. The megakaryocytes are increased, showing micromegakaryocytes with hypolobated nuclei. This anomaly may be seen in RARS or RAEB, and is generally associated with an unfavorable outcome.


TABLE 6.2.3


International Prognostic Scoring System for MDS


Score


0


0.5


1.0


1.5


2.0


% Blasts


<5


5-10


11-20


20-30*


Karyotype


Good


Intermediate


Poor


Cytopenias


0-1


2-3


MDS, myelodysplastic syndrome.


* Current World Health Organization (WHO) range of acute myeloid leukemia.

See text.

Cytopenias are defined as Hb <10 g/dL, neutrophils <1,500/µL, and platelets <100,000/µL.


Dysregulated Genes in MDS

The pathogenesis of MDS is highly complicated as it involves many dysregulated genes, which include many oncogenes, cell cycle regulatory genes, apoptotic genes, angiogenic genes, genes regulating DNA methylation, genes regulating histone acetylation, receptor tyrosine kinase genes, and immunomodulatory genes. A detailed description of the involvement of these genes in MDS can be found in a review article by Nishino and Chang (33). The salient features for laboratory diagnosis of MDS are summarized in Table 6.2.2.


Clinical Manifestations

Primary MDS is usually seen in patients >50 years (12). The incidence of MDS increases dramatically after 40 years of age and rises to >20 cases per 100,000 people aged 70 years and older (1). However, it may also be seen in children, particularly those with specific cytogenetic abnormalities, such as monosomy 7 syndrome of childhood. Secondary MDS is usually seen in elderly persons with exposure to radiation or chemotherapy. Patients with secondary MDS fare poorer with more rapidly progressive marrow failure than do those with primary MDS.

Clinical symptoms are related to cytopenia. For instance, dyspnea and pallor are due to anemia; fever, oral pain (agranulocytic angina), and recurrent bacterial or fungal infections are associated with neutropenia; and ecchymoses, petechiae, and mucocutaneous bleeding are related to thrombocytopenia (1). At the end stage, the patient may progress to complete bone marrow failure or leukemic transformation. RA and RARS have a low incidence of leukemic transformation, whereas RAEB has a higher incidence of transformation and rapidly progressive marrow failure. The clinical condition of RCMD is intermediate between these two groups (12).

According to the International MDS Risk Analysis Workshop, the prognosis of MDS depends on cytogenetic abnormalities, percentage of myeloblasts in the bone marrow, and the number of cytopenia (Table 6.2.3) (16). Age and gender also affect survival. Patients >60 years and men have shorter survival.


REFERENCES

1. Rothstein G. Disordered hematopoiesis and myelodysplasia in the elderly. J Am Geriatr Soc. 2003;51(suppl): S22-S26.

2. Dansey R. Myelodysplasia. Curr Opin Oncol. 2000;12:13-21.

3. Bennett J, Catovsky D, Daniel MT, et al. Proposals for the classification of the myelodysplastic syndromes. Br J Haematol. 1982;51:189-190.

4. Brunning RD, Bennett JM, Flandrin G, et al. Myelodysplastic syndromes. In: Jaffe ES, Harris NL, Stein H, Vardiman JW, eds. Tumours of Haematopoietic and Lymphoid Tissues. Lyon, France: IARC Press; 2001:61-74.

5. Vardiman JW, Harris NL, Brunning RD. The World Health Organization (WHO) classification of the myeloid neoplasms. Blood. 2002;100:2292-2302.

6. Bowen D, Culligan D, Jowitt S, et al. Guidelines for the diagnosis and therapy of adult myelodysplastic syndromes. Br J Haematol. 2003;120:187-200.

7. List AF, Vardiman J, Issa JP, DeWitte TM. Myelodysplastic syndromes. Hematology Am Soc Hematol Educ Program. 2004:297-317.

8. Goasguen JE, Bennett JM. Classification and morphologic features of the myelodysplastic syndromes. Semin Oncol. 1992;19:4-13.

9. Ho PJ, Gibson J, Vincent P, et al. The myelodysplastic syndromes: diagnostic criteria and laboratory evaluation. Pathology. 1993;25:297-304.

10. Farhi DC. Myelodysplastic syndromes and acute myeloid leukemia: diagnostic criteria and pitfalls. Pathol Annu. 1995;30(pt 1):29-57.

11. Rosati S, Anastasi J, Vardiman J. Recurring diagnostic problems in the pathology of myelodysplastic syndrome. Semin Hematol. 1996;33:111-126.

12. Brunning RD. Myelodysplastic syndromes. In: Knowles DM, ed. Neoplastic Hematopathology. 2nd ed. Philadelphia: Lippincott Williams & Wilkins; 2001:1717-1743.

13. Tricot G, DeWolf-Peeters C, Hendricks B, et al. Bone marrow histology in myelodysplastic syndromes. 1. Histological findings in myelodysplastic syndromes and comparison with bone marrow smears. Br J Haematol. 1984;57: 423-430.

14. Tricot G, DeWolf-Peeters C, Vlietinck R, et al. Bone marrow histology in myelodysplastic syndromes. II. Prognostic value of abnormal localization of immature precursors in MDS. Br J Haematol. 1984;58:217-225.

15. Kraus MD, Bartlett NL, Fleming MD, et al. Splenic pathology in myelodysplasia: a report of 13 cases with clinical correlation. Am J Surg Pathol. 1998;22:1255-1266.

16. Greenberg P, Cox C, LeBeau MM, et al. International Scoring System for evaluating prognosis in myelodysplastic syndromes. Blood. 1997;89:2079-2088.

17. Ven Den Berghe H, Michaux L. 5q-, twenty-five years later. A synopsis. Cancer Genet Cytogenet. 1997;94:1-7.

18. Dunphy CH. Applications of flow cytometry to chronic myeloproliferative disorders and myelodysplastic syndromes. J Clin Ligand Assay. 2004;27:170-179.

19. Orfao A, Ortuno F, de Santiago M, et al. Immunophenotyping of acute leukemias and myelodysplastic syndromes. Cytometry A. 2004;58:62-71.

20. Statler-Stevenson M, Arthur DC, Jabbour N, et al. Diagnostic utility of flow cytometric immunophenotyping in myelodysplastic syndrome. Blood. 2001;98:979-987.

21. Xu D, Schultz C, Akker Y, et al. Evidence for expression of early myeloid antigens in mature, non-blast myeloid cells in myelodysplasia. Am J Hematol. 2003;74:9-16.

22. Kussick SJ, Wood BL. Using 4-color flow cytometry to identify abnormal myeloid populations. Arch Pathol Lab Med. 2003;127:1140-1147.

23. Wells DA, Benesch M, Loken MR, et al. Myeloid and monocytic dyspoiesis as determined by flow cytometric scoring in myelodysplastic syndrome correlates with the IPSS and with outcome after hematopoietic stem cell transplantation. Blood. 2003;102:394-403.

24. Maynadie M, Picard F, Husson B, et al. Immunophenotypic clustering of myelodysplastic syndromes. Blood. 2002;100: 2349-2356.

25. Shao Z, Shang H, Chen G, et al. Expression and function of c-kit receptor in bone marrow mononuclear cells of patients with myelodysplastic syndromes. Chin Med J. 2001;114:481-485.

26. Chang CC, Cleveland RP. Decreased CD10-positive mature granulocytes in bone marrow from patients with myelodysplastic syndrome. Arch Pathol Lab Med. 2000;124: 1152-1156.

27. Sawada K, Sato N, Notoya A, et al. Proliferation and differentiation of myelodysplastic CD34+ cells: phenotypic subpopulations of marrow CD34+ cells. Blood. 1995;85:194-202.

28. Bowen KL, Davis BH. Abnormal patterns of expression of CD16 (FcR-III) and CD11b (CRIII) antigens by developing neutrophils in the bone marrow of patients with myelodysplastic syndrome. Lab Hematol. 1997;3:292-298.

29. Deliliers GL, Annaloro C, Soligo D, et al. The diagnostic and prognostic value of bone marrow immunostaining in myelodysplastic syndromes. Leuk Lymphoma. 1998;28: 231-239.

30. Yoshida Y, Mufti GJ. Apoptosis and its significance in MDS: controversies revisited. Leuk Res. 1999;23:777-785.

31. Rosenfeld C, List A. A hypothesis for the pathogenesis of myelodysplastic syndromes: implications for new therapies. Leukemia. 2000;14:2-8.

32. Hirai H. Molecular mechanisms of myelodysplastic syndrome. Jpn J Clin Oncol. 2003;33:153-160.

33. Nishino HT, Chang CC. Myelodysplastic syndromes: clinicopathologic features, pathobiology, and molecular pathogenesis. Arch Pathol Lab Med. 2005;129:1299-1310.

34. Parker JE, Nulti GJ, Rasool F, et al. The role of apoptosis, proliferation and the Bcl-2 related proteins in the myelodysplastic syndromes and acute myeloid leukemia secondary to MDS. Blood. 2000;96:3932-3938.

35. Willman CL. Molecular genetic features of myelodysplastic syndromes. Leukemia. 1998;12(suppl 1):S2-S6.

36. Crisan D. Molecular mechanisms in myelodysplastic syndromes and implications for evolution to acute leukemias. Clin Lab Med. 2000;20:49-69.


CASE 3 Myelodysplastic/Myeloproliferative Diseases


CASE HISTORY

A 63-year-old man presented with a 2-year history of leukocytosis and a 9-kg weight loss during a period of 4 months prior to admission. He saw a hematologist 2 years previously because of elevated leukocyte count, but no conclusive diagnosis was made. The patient did not have a history of exposure to ionizing irradiation or cytotoxic agents. He also denied any fevers, chills, or night sweats. There were no localized symptoms or somatic complaints. Physical examination revealed no splenomegaly or lymphadenopathy.

Hematologic workup revealed a hematocrit of 44%, as compared with 48% recorded 4 months previously. His total leukocyte count was 15,400/µL with 64% neutrophils, 21.9% lymphocytes, 8.1% monocytes, 6.0% eosinophils, and 0.4% basophils. The platelet count was 338,000/µL.

Examination of bone marrow aspirate showed a marked increase in monocytic series (10.25%), which included monocytes, promonocytes, and monoblasts. The total blast count including myeloblasts and monoblasts was 3.8%. There was bone marrow eosinophilia (7.2%) with various developmental stages, up to myelocytes. Dysplastic changes were present within the granulocytic population, such as hypolobation, pseudo-Pulger-Huet cells, and hypogranularity. Megaloblastoid changes were seen frequently in the normoblast populations. The core biopsy revealed a myeloid-erythroid (M/E) ratio of 6:1 with predominance of myelomonocytic cells. A few clusters of immature myelomonocytic precursors were present in the intertrabecular areas. Eosinophilia was also demonstrated.


FLOW CYTOMETRIC FINDINGS

Results in the bone marrow were as follows: CD13-CD33, 82%; CD14, 34%; CD34, 12%; human leukocyte antigen-DR (HLA-DR), 31%; CD45, 100% (Fig. 6.3.1).


IMMUNOHISTOCHEMISTRY AND CYTOCHEMISTRY

Immunohistochemical stain for CD68 (PG-M1) and α-naphthyl butyrate esterase stain highlighted the large population of monocytic series in bone marrow biopsy and bone marrow aspirate, respectively.


MOLECULAR GENETIC FINDINGS

Cytogenetic study demonstrated a 46,XY karyotype, and fluorescence in situ hybridization study showed no rearrangement of the translocation-Ets-leukemia (TEL) ETS variant gene 6 (or ETV6) locus associated with a translocation t(5;12).


DISCUSSION

As discussed in Cases 1 and 2, chronic myeloproliferative disorder (CMPD) and myelodysplastic syndrome (MDS) can be demonstrated separately in the myeloid series. However, there are cases that present with features of both CMPD and MDS. For instance, a study of >500 MDS patients according to the French-American-British (FAB) scheme revealed that 4.4% of cases had features of both MDS and CMPD (1). This is a dilemma for hematologists in terms of management of these patients. Recently, the World Health Organization (WHO) classification created a new entity: Myelodysplastic/myeloproliferative diseases (MDS/MPD) that include diseases presenting with both MDS and CMD features (2). This new entity allows clinicians to have more flexibility in treating patients according to the predominant feature. For instance, chronic myelomonocytic leukemia was previously classified as MDS in the Revised European-American Classification of Lymphoid Neoplasms (REAL classification) (3), but is now included in this new entity and can be treated as MDS or CMPD according to its major clinical features.

Historically, the FAB was the first group to recognize the existence of such diseases, and in 1994 classified them under the name of chronic myeloid leukemias, including chronic granulocytic leukemia, atypical chronic myeloid leukemia (aCML), and chronic myelomonocytic leukemia (CMML) (4). The WHO scheme separates the Philadelphia chromosome-positive chronic myeloid leukemia (CML) from aCML and CMML. The latter two entities are consistently Philadelphia chromosome-negative, and are designated as MDS/MPD. In addition, the WHO classification includes juvenile myelomonocytic leukemia (JMML) in the MDS/MPD category.


Morphology

The general feature of MDS/MPD is proliferation of one or more of the myeloid lineages in the bone marrow (2,5). This proliferation may produce increased numbers of circulating cells in one or more cell lineages. On the other hand, one or more of the other lineages may be dysplastic, leading to ineffective hematopoiesis in the peripheral blood, such as anemia, leukopenia, or thrombocytopenia. The blast count in the peripheral blood and bone marrow should be <20%. Splenomegaly and hepatomegaly are common.

In this category, CMML is the most common disorder, accounting for 3/100,000 persons annually (2,5,6). It is characterized by a substantial monocytosis in both the
peripheral blood and the bone marrow (Table 6.3.1). The peripheral blood monocyte count should be >1000/µL (Fig. 6.3.2), and the monocyte count in bone marrow should be >10% (Fig. 6.3.3). Immature myeloid cells (myelocytes and metamyelocytes) can be present in the peripheral blood, but they are usually <10%. Unlike CML, CMML shows myelodysplastic changes in one or more myeloid lineages, but the Philadelphia chromosome or breakpoint cluster region/Ableson (BCR/ABL) fusion is not present. If myelodysplasia is absent or minimal, the diagnosis of CMML can still be made when peripheral monocytosis has lasted for >3 months, other causes of monocytosis have been excluded, and clonal cytogenetic abnormality is present in bone marrow cells (2). Unlike acute myeloid leukemia, CMML has <20% blasts in the blood or bone marrow.


FIGURE 6.3.1 Flow cytometric histograms show three populations: the blue and red populations are mature and immature monocytes, and the green population represents immature myelocytes. The monocyte populations are positive for CD13.33, CD14, CD117, and CD34. The myelocytes are positive for CD13.33, CD117, and CD34. Both populations are negative for CD11c. SS, side scatter; PC5, phycoerythrin-cymin 5; FITC, fluorescein isothiocyanate; RD1, rhodamine.

If the blasts in the blood are 5% to 19% or 10% to 19% in the bone marrow, it is classified as CMML-2, whereas cases with <5% blasts in the blood and <10% in the bone marrow
are classified as CMML-1. The M/E ratio in CMML is lower than that in CML and aCML, as there are >15% of erythroid components in the bone marrow (6). Mild basophilia and mild eosinophilia can be seen in some cases. If eosinophilia is striking (>1,500/µL), it becomes the variant of CMML with eosinophilia, which is associated with specific symptoms due to eosinophilic degranulation and may be associated with a specific karyotype, t(5:12) (7,8). The spleen and lymph node can be infiltrated by the myelomonocytic cells. Some patients may have generalized lymphadenopathy. These lymph nodes are characterized by extensive infiltration by plasmacytoid monocytes (9, 10, 11 and 12). The plasmacytoid monocytes have round nuclei, finely dispersed chromatin, inconspicuous nucleoli, and eosinophilic cytoplasm, but their clonal relationship with the neoplastic cells has not been proven.


TABLE 6.3.1


Salient Features for Laboratory Diagnosis of Chronic Myelomonocytic Leukemia


1.


Persistent peripheral monocytosis (>1,000/µL) for >3 mo


2.


Presence of immature myeloid cells (<10%) in peripheral blood


3.


Bone marrow monocytosis (>10%)


4.


Myelodysplasia ≥1 myeloid lineages


5.


No Philadelphia chromosome or breakpoint cluster region/Ableson (BCR/ABL) fusion gene, but cytogenetic abnormality is present in 20% to 30% of cases


6.


Fewer than 20% blasts (myeloblasts, monoblasts, and promonocytes included) in blood and bone marrow


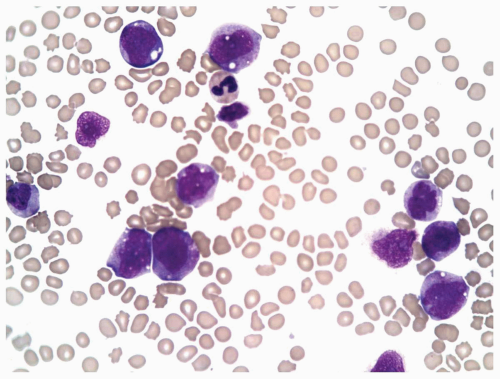
FIGURE 6.3.2 Peripheral blood smear from a case of chronic myelomonocytic leukemia (CMML)-2 shows monocytes of different developmental stages. Wright-Giemsa, 60× magnification.


FIGURE 6.3.3 Bone marrow aspirate from a case of chronic myelomonocytic leukemia (CMML)-2 shows many mature and immature monocytes. Wright-Giemsa, 60× magnification.


TABLE 6.3.2


Salient Features of Laboratory Diagnosis of Atypical Chronic Myeloid Leukemia


1.


Peripheral leukocytosis with >10% immature myeloid cells


2.


Prominent dysplasia in ≥1 myeloid lineages


3.


No or minimal absolute monocytosis (<10% in blood)


4.


<20% blasts in blood and bone marrow


5.


No Philadelphia chromosome or breakpoint cluster region/Ableson leukemia virus (BCR-ABL) fusion gene


aCML has clinical, laboratory, and morphologic features similar to those of CML, but it differs from CML in the absence of the Philadelphia chromosome, BCR/ABL fusion, and the presence of dysplastic changes in one or more myeloid cell lines (Table 6.3.2) (2,5,6,13). aCML can be distinguished from CMML by lower percentage of monocyte count (<10%) and higher percentage of immature myeloid cells (>10%) in the peripheral blood (Fig. 6.3.4). The blast count is usually <5% in the peripheral blood and always <20% in the bone marrow. Because of marked myelopoiesis, the M/E ratio in the bone marrow is frequently >10:1 (Fig. 6.3.5).

As the name indicates, JMML is seen in children <14 years, and 75% of patients are <3 years (2,5,6,14, 15, 16 and 17). It has the lowest incidence in the MDS/MPD group (1.3 per million children per year) (2), but it is most common in pediatric patients with myeloproliferative syndrome (18). Despite the age difference, JMML is similar to CMML, and some authors consider these two diseases to be synonymous.


FIGURE 6.3.4 Peripheral blood smear from a case of atypical chronic myeloid leukemia (aCML) shows marked leukocytosis with several immature forms. Wright-Giemsa, 40× magnification.


FIGURE 6.3.5 Bone marrow core biopsy shows hypercellularity with a high myeloid-erythroid (M/E) ratio. Hematoxylin and eosin, 60× magnification.

The major laboratory features include peripheral leukocytosis (>10,000/µL), and monocytosis is present in the peripheral blood (>1,000/µL) and bone marrow (5% to 10%) (Table 6.3.3). Immature myeloid cells are also present in the peripheral blood. As in other MDS/MPD entities, the Philadelphia chromosome and BCR-ABL fusion are absent. Unlike CMML, myelodysplastic changes usually are not prominent, and the total leukocyte count is usually higher (2,6,18). Blasts, including promonocytes, are <20% in the peripheral blood and bone marrow, distinguishing JMML from acute myelomonocytic leukemia. However, myelomonocytic cells may infiltrate the skin, lung, liver, and spleen, mimicking acute leukemia. In nearly 70% of patients with JMML, the hemoglobin F level is >10% and the hemoglobin A2 level is low. Experimentally, the JMML cells are able to form spontaneous granulocyte-macrophage colonies in vitro and they have marked hypersensitivity to granulocyte-macrophage colony-stimulating factor (GM-CSF) stimulation in vitro (2,14). The differences between CMML, aCML, and JMML are summarized in Table 6.3.4.


TABLE 6.3.3


Salient Features for Laboratory Diagnosis of Juvenile Myelomonocytic Leukemia


1.


Peripheral monocytosis (>1,000/µL)


2.


Bone marrow monocytosis (10% to 20%)


3.


<20% blasts (monoblasts and promonocytes) in blood and bone marrow


4.


Peripheral leukocytosis of >10,000/µL with <10% immature myeloid cells


5.


No Philadelphia chromosome or breakpoint cluster region/Ableson (BCR/ABL) fusion gene but abnormal karyotype frequently present


6.


Hemoglobin F level >10% and low hemoglobin A2 level


TABLE 6.3.4


Comparison of CMML, aCML, and JMML


Feature


CMML


aCML


JMML


Philadelphia chromosome


Negative


Negative


Negative


BCR-ABL


Negative


Negative


Negative


Peripheral monocytes


>1,000/µL


≥3% to <10%


>1,000/µL


Marrow monocytes


≥10%


≤3%


5% to 10%


Peripheral immature myeloid cells


≤10%


10% to 20%


≤10%


Peripheral basophils


<2%


<2%


<2%


Granulocytic dysplasia


Marked


Very marked


Minimal


Marrow erythroid precursors


>15%


Low percentage


Low percentage


CMML, chronic myelomonocytic leukemia; aCML, atypical chronic myeloid leukemia; JMML, juvenile myelomonocytic leukemia; BCR/ABL, breakpoint cluster region/Ableson.


Immunophenotype and Cytochemistry

In one flow cytometric study of CMML, it was found that the monocytes showed decreased expression of monocyteassociated antigens CD13, CD15, CD36, and HLA-DR and aberrant expression of nonmyelomonocytic antigens CD2 and CD56 (19). Aberrant expression of two or more antigens may help distinguish CMML from reactive monocytosis. CMML cases also showed a significantly higher percentage (>20%) of CD14 (moderate) bone marrow monocytes as compared with cases of reactive monocytosis (19). CD14 (moderate) monocytes are CD45 dim, so they represent immature monocytes, whereas mature monocytes are CD14 (strong). The combination of two or more immunophenotypic aberrations and ≥20% CD14 (moderate) bone marrow monocytes was 67% sensitive and 100% specific for the diagnosis of CMML (19).


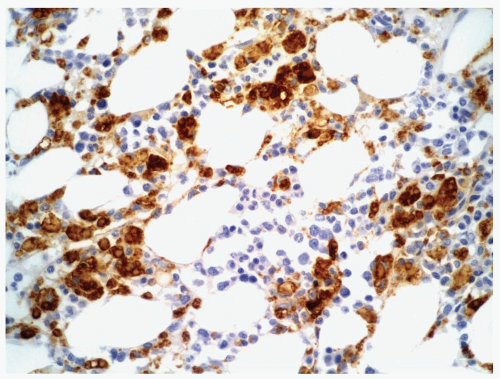
FIGURE 6.3.6 Bone marrow core biopsy from a case of chronic myelomonocytic leukemia (CMML) shows positive CD68 PG-M1 staining in many monocytes. Immunoperoxidase, 40× magnification.

To distinguish CMML from acute myelomonocytic leukemia, the blasts count is the major criteria and 20% of blasts is the cut-off point. Yang et al. (20) suggested using a panel of markers to separate different stages of monocytes. The entire monocyte population can be isolated by dual bright CD33 and CD64 staining. CD64 is positive for all mature and immature monocytes. CD14 has two epitopes: My4 and Mo2. My4 is present in mature monocytes and promonocytes. Mo2 is only expressed by mature monocytes. Therefore, dual staining with these markers can separate mature monocytes from promonocytes and monoblasts. The plasmacytoid monocytes in the lymph nodes of CMML cases also show a specific immunophenotype. These cells are positive for CD4, CD14, CD43, CD56, and CD68 (9, 10, 11 and 12).

There have been no reports of specific immunophenotypes for aCML and JMML. However, the immunophenotype as described in CMML is also applicable to the monocytes in JMML. In aCML the myeloid cells can be identified by CD13 and CD33, and myeloperoxidase and myeloblasts can be estimated by CD34 and CD117. Monoblasts, however, are negative for CD34 and CD117 in many cases.

Immunohistochemical stains, such as CD33, CD68 (Fig. 6.3.6), and myeloperoxidase, are helpful in demonstrating the myelomonocytic components. However, cytochemical stains with myeloperoxidase, lysozyme, α-naphthyl acetate esterase and α-naphthyl butyrate esterase (Fig. 6.3.7) on peripheral blood or bone marrow smears are most useful in distinguishing myelocytes from monocytes. Leukocyte alkaline phosphatase scores are decreased in 50% of JMML cases, but are variable in aCML cases (2).


Comparison between Flow Cytometry and Immunohistochemistry

Morphologic identification of various abnormal monocytes is difficult and subject to significant variations between observers. Therefore, immunophenotype and cytochemical stains are of utmost importance to facilitate an accurate count of monocytes. With a large panel of myelomonocytic markers, flow cytometry can isolate monocytes from myelocytes and identify different developmental stages, so that it is most helpful in substantiating the diagnosis of CMML and JMML. Cytochemical staining with esterases has the advantage of correlating the markers with morphology, but some immature monocytic cells may not show nonspecific esterase staining thus underestimating the monocyte count.


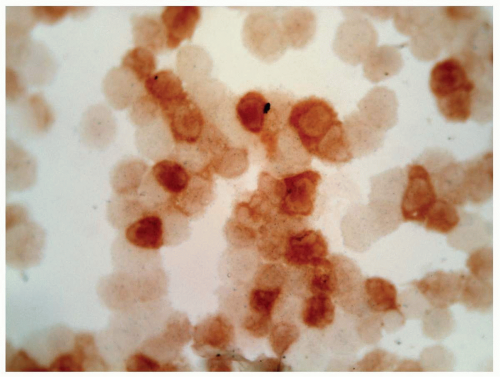
FIGURE 6.3.7 Cytospin smear of bone marrow aspirate from a patient of juvenile myelomonocytic leukemia (JMML) shows positive staining of α-naphthyl butyrate esterase in many monocytes. Cytochemical stain, 60× magnification.

Immunohistochemical staining is not helpful in distinguishing myelocytes and monocytes, because most markers stain both populations. CD68 (KP1) stains both myelocytes and monocytes, but CD68 (PG-M1) stains only monocytes, so the latter marker is more helpful in the differential diagnosis.


Molecular Genetics

Approximately 20% to 30% of CMML cases have aberrant karyotypes, including trisomy 8, del(20q), monosomy 7, and del(11q), but these abnormalities can also be seen in other myeloproliferative or myelodysplastic disorders (2,6). However, a subset of CMML, CMML with blood and marrow eosinophilia, is associated with t(5:12)(q33;p13), which is specific (7,8). Molecular characterization has revealed that this translocation involves the TEL gene on chromosome 12 and the platelet-derived growth factor receptor (PDGFR) gene on chromosome 5 (21). The resultant TEL-PDGFR fusion transcript may play an important role in the proliferative process, probably through the deregulation of an oncogene derived from rat sarcoma virus (RAS) (6). Point mutation of RAS genes has been found in as many as 40% of CMML patients (2). Translocations of the PDFGR gene to other partner genes have also been reported (22). A recent report demonstrated recurrent somatic activating
mutation in the Janus kinase 2 (JAK2) tyrosine kinase in 9 of 116 CMML/aCML cases (23). CCAAT/enhancer binding protein α (CEBPα) gene mutation is involved in CMML cases transforming into acute myeloid leukemia (24).

As many as 80% of patients with aCML have cytogenetic abnormalities, including +8, +13, +14, del(20q), i(17q), and del(12q), but none of them are specific (2,6). As mentioned above, JAK2 mutation has also been found in aCML patients (23). t(9;15;12) translocation involving the ETV6 gene at 12q13 and the JAK2 gene at 9q24 has been reported in a case of aCML in transformation (25).

Cytogenetic abnormalities occur in 30% to 40% of JMML patients, but none of them are specific (2). Monosomy 7 is frequently associated with JMML, but the relationship of JMML and childhood monosomy 7 syndrome is uncertain (14). The most important genetic finding in JMML is point mutation of the RAS gene, which is present in 20% to 30% of patients (2,6). These point mutations may induce the increase of intracellular levels of RAS-guanosine 5″-triphosphate (GTP), which may alter the RAS signaling pathway. In JMML patients with neurofibromatosis type 1 (NF1), loss of the normal NF1 allele is a common finding in the leukemic cells. The normal NF1 protein, nerofibromin, down-regulates RAS-GTP. Inactivation of NF1 may deregulate the RAS pathway. In addition, somatic mutations of PTRN11 have been reported in 35% of JMML patients (26).

The current case showed both myeloproliferative and myelodysplastic features with peripheral and bone marrow monocytosis, so it was consistent with CMML morphologically. The positive α-naphthyl butyrate esterase staining in the bone marrow aspirate smear and positive CD68 (PGM1) staining in the core biopsy further confirmed this diagnosis. In addition, the patient also had eosinophilia in the peripheral blood and bone marrow. CMML with eosinophilia is associated with t(5:12), but it occurs in only 1% to 2% of such cases (2).


Clinical Manifestations

Patients with CMML may have fatigue, weight loss, fever, and night sweats (2). In addition, they may have recurrent infections due to dysfunctional leukocytes and hemorrhages due to thrombocytopenia. Many patients have splenomegaly and/or hepatomegaly (2,6). The survival time of these patients may vary from 1 month to >100 months with a median survival of 20 to 40 months in most studies (2). The most important prognostic predictor is the number of blasts.

There are no specific clinical symptoms reported in aCML cases. Those presenting symptoms may be related to anemia, thrombocytopenia, or splenomegaly. The median survival times reported are <20 months (2). About 25% to 40% of aCML cases evolve into acute leukemia.

Clinical symptoms in JMML patients include malaise, pallor, fever, or other evidence of infection (2,6). Other symptoms may be related to bleeding or pulmonary involvement. A maculopapular skin rash may be present in ≤50% of patients. Splenomegaly is virtually always present. Hepatomegaly and lymphadenopathy are found in more than one half of patients (6). Patients with JMML and those with childhood monosomy 7 syndrome have similar clinical symptoms. JMML without monosomy 7 syndrome tend to have higher hemoglobin F levels, more prominent lymphadenopathy, and more severe skin rashes than do patients with monosomy 7 syndrome, whereas the latter have a tendency to develop leukopenia and bacterial infections (14). The median survival times vary from 5 months to >4 years, depending on the treatment the patients received (2). If untreated, 30% of patients die within 1 year of diagnosis.


REFERENCES

1. Neuwirtova R, Mocikova K, Musilova J, et al. Mixed myelodysplastic and myeloproliferative syndromes. Leuk Res. 1996;20:717-726.

2. Vardiman JW. Myelodysplastic/myeloproliferative diseases. In: Jaffe ES, Harris NL, Stein H, Vardiman JW, eds. Tumours of Haematopoietic and Lymphoid Tissues. Lyon, France: IARC Press; 2001:47-59.

3. Harris NL, Jaffe ES, Stein H, et al. A revised European-American classification of lymphoid neoplasms. A proposal from the International Lymphoma Study Group. Blood. 1994;84:1361-1392.

4. Bennett JM, Catovsky D, Daniel MT, et al. The chronic myeloid leukaemias: guidelines for distinguishing chronic granulocytic, atypical chronic myeloid, and chronic myelomonocytic leukaemia. Proposals by the French-American-British Cooperative Leukaemia Group. Br J Haematol. 1994; 87:746-754.

5. Vardiman JW, Harris NL, Brunning RD. The World Health Organization (WHO) classification of the myeloid neoplasms. Blood. 2002;100:2292-2302.

6. Anastasi J, Vardiman JW. Chronic myelogenous leukemia and the chronic myeloproliferative diseases. In: Knowles DM, ed. Neoplastic Hematopathology. 2nd ed. Philadelphia, PA: Lippincott Williams & Wilkins; 2001:1745-1790.

7. Baranger L, Szapiro N, Gardais J, et al. Translocation t(5;12)(q31-q33;p12-p13): a non-random translocation associated with a myeloid disorder with eosinophilia. Br J Haematol. 1994;88:343-347.

8. Hyde J, Sun T. Chronic myelomonocytic leukemia with abnormal bone marrow eosinophils. Arch Pathol Lab Med. 2003;127:1214-1216.

9. Facchetti F, De Wolf-Peeters C, Kennes C, et al. Leukemiaassociated lymph node infiltrates of plasmacytoid monocytes (so-called plasmacytoid T-cells). Evidence for two distinct histological and immunophenotypical patterns. Am J Surg Pathol. 1990;14:101-112.

10. Harris NL, Demirjian Z. Plasmacytoid T-zone cell proliferation in a patient with chronic myelomonocytic leukemia. Histologic and immunohistologic characterization. Am J Surg Pathol. 1991;15:87-95.

11. Baddoura FK, Hanson C, Chan WC. Plasmacytoid monocyte proliferation associated with myeloproliferative disorders. Cancer. 1992;69:1457-1467.

12. Horny HP, Kaiserling E, Handgretinger R, et al. Evidence for a lymphotropic nature of circulating plasmacytoid monocytes: finding from a case of CD56+ chronic myelomonocytic leukemia. Eur J Haematol. 1995;54:209-216.

13. Hernandez JM, del Canizo MC, Cunco A, et al. Clinical, hematological and cytogenetic characteristics of atypical chronic myeloid leukemia. Ann Oncol. 2000;11:441-444.

14. Arico M, Biondi A, Pui CH. Juvenile myelomonocytic leukemia. Blood. 1997;90:479-488.


15. Niemeyer CM, Arico M, Basso G, et al. Chronic myelomonocytic leukemia in childhood: a retrospective analysis of 110 cases. Blood. 1997;89:3534-3543.

16. Niemeyer CM, Fenu S, Hasle H, et al. Response: differentiating juvenile myelomonocytic leukemia from infectious disease. Blood. 1998;91:365-366.

17. Chang YH, Jou ST, Lin DT, et al. Differentiating juvenile myelomonocytic leukemia from chronic myeloid leukemia in childhood. J Pediatr Hematol Oncol. 2004;26:236-242.

18. Gassas A, Doyle JJ, Weitzman S, et al. A basic classification and a comprehensive examination of pediatric myeloproliferative syndromes. J Pediatr Hematol Oncol. 2005;27: 192-196.

19. Xu Y, McKenna RW, Karandikar NJ, et al. Flow cytometric analysis of monocytes as a tool for distinguishing chronic myelomonocytic leukemia from reactive monocytosis. Am J Clin Pathol. 2005;124:799-806.

20. Yang DT, Greenwood JH, Hartung L, et al. Flow cytometric analysis of different CD14 epitopes can help identify immature monocytic populations. Am J Clin Pathol. 2005;124: 930-936.

21. Golub RR, Barker GF, Lovett M, et al. Fusion of PDGF receptor beta to a novel ets-like gene, tel, in chronic myelomonocytic leukemia with t(5;12) chromosomal translocation. Cell. 1994;77:307-316.

22. Wlodarska I, Mecucci C, Marynen P, et al. TEL gene is involved in myelodysplastic syndromes with either the typical t(5;12)(q33:p13) translocation or its variant t(10;12)(q24;p13). Blood. 1995;85:2848-2852.

23. Levine RL, Loriaux M, Huntly BJP, et al. The JAK2V617F activating mutation occurs in chronic myelomonocytic leukemia and acute myeloid leukemia, but not in acute lymphoblastic leukemia or chronic lymphocytic leukemia. Blood. 2005;106:3377-3379.

24. Shih LY, Huang CF, Lin TL, et al. Heterogeneous patterns of CEBPα mutation status in the progression of myelodysplastic syndrome and chronic myelomonocytic leukemia to acute myelogenous leukemia. Clin Cancer Res. 2005;11:1821-1826.

25. Peeters P, Raynaud SD, Cools J, et al. Fusion of TEL, the ETS-variant gene 6 (ETV6), to the receptor-associated kinase JAK2 as a result of t(9;12) in a lymphoid and t(9;15;12) in a myeloid leukemia. Blood. 1997;90:2535-2540.

26. Kratz CP, Niemeyer CM, Castleberry RP, et al. The mutational spectrum of PTPN11 in juvenile myelomonocytic leukemia and Noonan syndrome/myeloproliferative disease. Blood. 2005;106:2183-2185.


CASE 4 Acute Myeloid Leukemia with t(8;21)(q22;q22)


CASE HISTORY

A 19-year-old man presented with a 4-week history of sore throat, fever to 103°F, lethargy, chest congestion, and flu-like symptoms. The day before admission, he noticed the onset of widespread petechiae. He had been seen in the clinic 1 week before, and was given erythromycin for a presumed upper respiratory infection. Physical examination showed pallor, petechiae, diffuse lymphadenopathy with 4+ tonsillar hypertrophy, and mild hepatosplenomegaly. Hematology workup revealed a total leukocyte count of 128,000/µL with 97% blasts, 2% segmented neutrophils, and 1% lymphocytes. The hematocrit was 36% and platelet count, 23,000/µL. Lactate dehydrogenase was 555 U/L. A bone marrow biopsy and aspirate were performed.


FLOW CYTOMETRY FINDINGS

Blood: Myeloid markers: myeloperoxidase 87%, CD13-CD33 97%. Monocyte marker: CD14 0%. Activation antigen: HLA-DR 0%. T-cell marker: CD7 0%. Stem cell marker: CD34 20%.

Bone marrow: Myeloid markers: myeloperoxidase 100%, CD13-CD33 93%. Monocyte marker: CD14 59%. Activation antigen: HLA-DR 86%. T-cell marker: CD7 0%. B-cell marker: CD19 0%. Stem cell marker: CD34 60% (Fig. 6.4.1).


CYTOCHEMICAL FINDINGS

The blasts were positive for myeloperoxidase and chloroacetate esterase, but negative for α-naphthyl butyrate esterase.


MOLECULAR GENETIC STUDIES

Fluorescence in situ hybridization (FISH) for t(15;17) was negative. Karyotyping showed t(8;21)(q22;q22) (Fig. 6.4.2).


DISCUSSION

In the current case, the peripheral blood showed many blasts containing multiple Auer rods, and the bone marrow revealed 92% blasts with >10% of type 3 blasts (blasts that contain >20 cytoplasmic granules) (Figs. 6.4.3 and 6.4.4). The presence of hypergranular myeloid cells with multiple Auer rods and an immunophenotype of negative HLA-DR misled us to consider acute promyelocytic leukemia and triggered the order of FISH for t(15;17), the results of which were negative. The karyotype of t(8;21) together with the above described morphology finally provided a definitive diagnosis of acute myeloid leukemia with maturation (AML-M2). The immunophenotyping of the bone marrow showed a normal percentage of HLA-DR,
indicating that the absence of HLA-DR in the immunophenotype of the peripheral blood specimen was probably a technical error. The identification of this particular karyotype is clinically important because it confirms the diagnosis of AML even when the blast count in the bone marrow is <20% (1). It also confers a favorable prognosis. The presence of type 3 blasts defines the leukemia as AML-M2 irrespective of whether the mature myeloid cell count is below or above 10% (2).


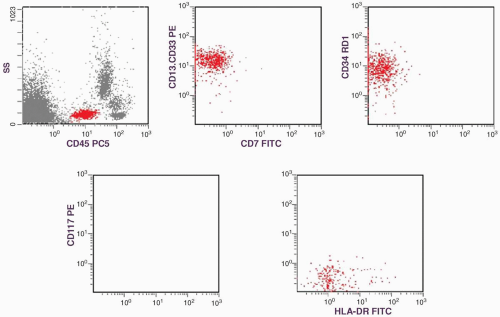
FIGURE 6.4.1 Flow cytometric analysis of bone marrow shows positive CD13.CD33, CD34, and HLA-DR, but negative CD7 and CD117. Note that a large population of mature myeloid cells is present above the gated acute myeloid leukemia (AML) population. ss, side scatter; pc, phycoerythrin-cyanin 5; PE, phycoerythrin; RD1, rhodamine; FITC, fluorescein isothiocyanate.


Morphology

The hematologic features in this particular genotype are characterized by abundant Auer rods (Fig. 6.4.5) or Auer rods with a single long and sharp rod with tapered ends, strong myeloperoxidase activity, salmon-colored cytoplasmic granules, and a rim of basophilic cytoplasm in maturing leukemic cells, large cytoplasmic vacuoles, and bone marrow eosinophilia (3). The eosinophils may show periodic acid-Schiff (PAS)-positive granules. Nucifora et al. (4) added two more parameters: the French-American-British (FAB) M2 subtype and cells containing pink, waxy inclusions approximately 2 to 3 µm in diameter, as the seven predictive criteria for a t(8;21) or AML/ETO (eight twentyone) translocation.

Andrieu et al. (5) developed a weighted score system including FAB-M2 subtype, Auer rods, pseudo-Chediak-Higashi anomaly (Fig. 6.4.6), marrow eosinophilia, large blasts with prominent Golgi (Fig. 6.4.7), and abnormal cytoplasmic granules. The sensitivity of this system is claimed to be 100%, but the false-positive rate is 7%.

In addition, >10% type 3 blasts may be present in AML-M2 including this special subtype (2). Auer rods can be demonstrated in mature granulocytes as well as eosinophils (1). Myelodysplastic changes, such as pseudo-Pelger-Huet cells and hypogranular neutrophils, may be demonstrated in the myeloid series. The special morphologic features are summarized in Table 6.4.1.

The cytochemical characteristics are similar to other myeloid leukemia showing the presence of positive reaction to myeloperoxidase and chloroacetate esterase, but absence of α-naphthyl butyrate esterase.

AML cases with t(8;21) have a high frequency of developing into myeloid sarcoma (6). In a study of 84 patients with t(8;21), 8 had extramedullary myeloid leukemia, mainly involving the spinal cord (7).


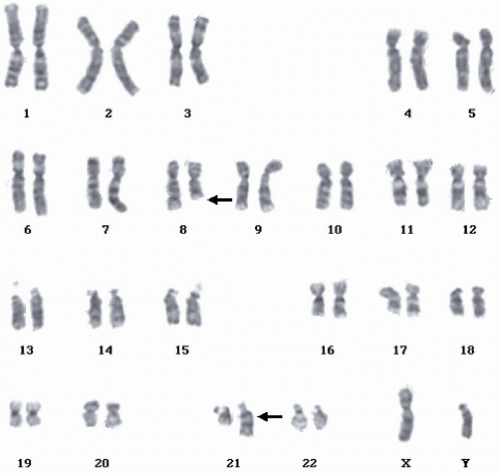
FIGURE 6.4.2 Karyotype of bone marrow reveals t(8;21)(q22;q22) (arrows). (Courtesy of Peter Papenhausen, Ph.D., LabCorp of America Cytogenetic Department, North Carolina.)


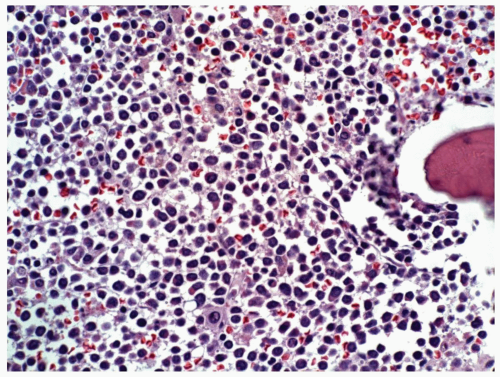
FIGURE 6.4.3 Bone marrow core biopsy shows extensive immature myeloid cell infiltration replacing normal hematopoietic cells. No normoblasts and megakaryocytes are present. Hematoxylin and eosin, 40× magnification.


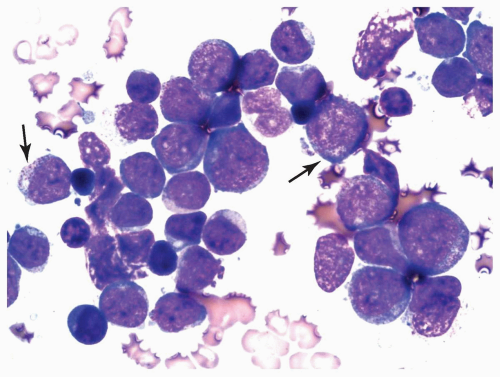
FIGURE 6.4.4 Bone marrow aspirate reveals a cluster of myeloblasts with several showing >20 cytoplasmic granules (type 3 blasts) (arrows). Wright-Giemsa, 100× magnification.


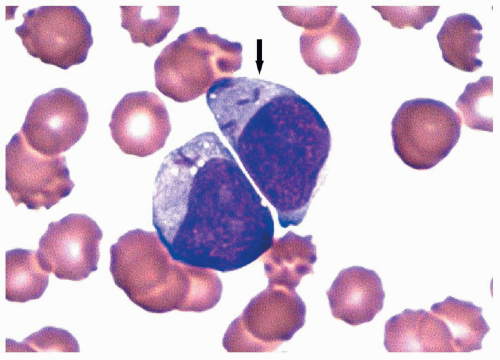
FIGURE 6.4.5 Peripheral blood smear shows two immature myeloid cells with multiple Auer rods (arrow). Wright-Giemsa, 100× magnification.


Immunophenotype

An AML case with t(8;21) expresses the same myeloid antigens (such as CD13, CD15, CD33, and myeloperoxidase) as other AML subtypes (1). However, there are also some specific markers for this special subtype. The most important one is the B-cell antigen, CD19, which is present in a subset of blasts (1,8). Another unusual marker is a natural killer cell marker, CD56, which is not as frequently demonstrated as CD19, but its presence confers an adverse prognosis (9). The stem cell marker CD34 is characteristically present and may help to identify its malignant nature. C-KIT gene mutation and overexpression are found in this special subtype of AML (10), but the expression of its protein, CD117, has not been documented in the literature.


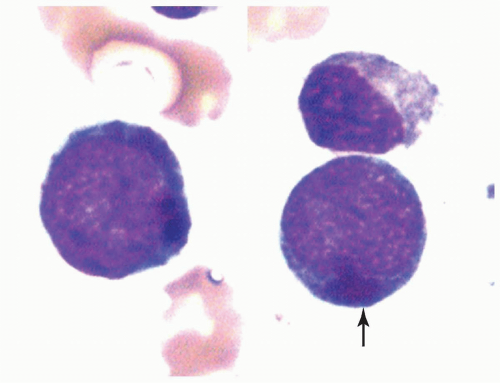
FIGURE 6.4.6 Bone marrow aspirate shows two myeloblasts containing large cytoplasmic lysosomes (pseudo-Chediak-Higashi anomaly) (arrow). Wright-Giemsa, 100× magnification.


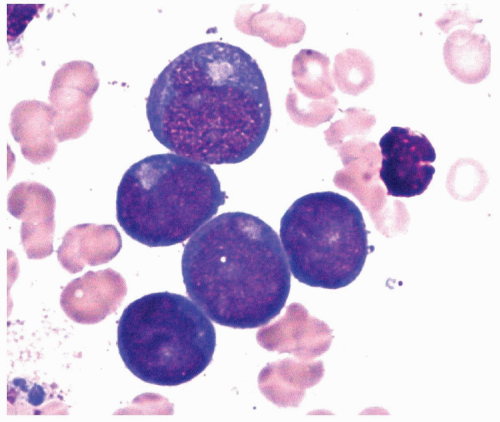
FIGURE 6.4.7 Bone marrow aspirate shows five myeloblasts with prominent Golgi. Wright-Giemsa, 200× magnification.

In a study of 93 cases of AML with t(8;21), it was shown that the cases are characterized by a significantly higher expression of CD19, CD34, CD56, and CD54 than are other AML subtypes with normal or other abnormal karyotypes (11). Conversely, CD45 RO, CD33, CD36, CD11b, and CD14 were significantly lower in t(8;21) cases than in controls. In other studies, however, CD33 was often expressed in low intensity (5,12,13). T-cell markers, such as CD2 and CD7, are rarely expressed.

One study found that the combination of CD19 and CD34 is most reliable in predicting t(8;21) (8). Using the cutoff of 10% for CD19 and 35% for CD34, this combination correctly classified 92 of 93 AML with t(8;21).

By using immunohistochemistry, the most exciting recent finding is the presence of the PAX5 protein (B-cell-specific activator protein [BSAP]) only in AML cases with
t(8;21), but it was positive in only one third of the cases studied (14). In some t(8;21) cases without a positive immunohistochemical staining for PAX5, up-regulation of PAX5 transcript was identified by real-time reverse transcription-polymerase chain reaction (RT-PCR) studies (14). PAX5 is the master regulator of B-lymphopoiesis through activation of B-cell-specific genes, including CD19 and CD79a (15,16). Therefore, it is not unexpected that CD19 and CD79a are also expressed, though in lower frequency, in PAX5-positive cases. As there is no CD19 monoclonal antibody for immunohistochemistry, the identification of these two B-cell markers, PAX5 and CD79a, is most useful in surgical pathology.


TABLE 6.4.1


Special Morphologic Features in Acute Myeloid Leukemia (AML) with t(8;21)(q22;q22)


1.


French-American-British (FAB) AML with maturation (AML-M2) morphology, including type 3 blasts in some cases


2.


Abundant Auer rods in mature and immature myeloid cells


3.


Salmon-colored granules and a rim of basophilic cytoplasm in myeloid cells


4.


Pseudo-Chediak-Higashi anomaly


5.


Cells with pink, waxy cytoplasmic globules


6.


Large blasts with prominent Golgi area


7.


Cytoplasmic vacuoles


8.


Bone marrow eosinophilia (>5%)


Comparison of Flow Cytometry and Immunohistochemistry

Flow cytometry is usually more practical than immunohistochemistry in the study of blood and bone marrow specimens and is capable in identifying this special subtype of AML by showing CD19 and CD34 in addition to myeloid markers. However, immunohistochemistry is most helpful in diagnosing myeloid sarcoma derived from this subtype of AML by using myeloid markers together with PAX5 and CD79a.


Molecular Genetics

Molecular characterization has demonstrated that t(8;21) represents the fusion of the AML1 gene on chromosome 21q22 with the ETO gene on chromosome 8q22. The AML1 gene is also called core binding factor protein α (CBFα), RUNX1, and FEBP2. ETO is also called MTG8.

The AML1 gene encodes the CBFα protein, which forms a heterodimer with CBFβ that plays an important role in normal hematopoietic differentiation (8,17,18). CBF also cooperates with other basic transcription factors in activating a set of hematopoietic specific genes. The ETO gene is the mammalian homolog of the Drosophila gene nervy, a transcriptional regulator with yet unknown biological function (8).

AML1/ETO encodes a fusion transcript with a primary inhibitory role in normal hematopoietic differentiation. It regulates the expression of both AML1 target and non-AML1 target genes via its interaction with various transcription regulators (17). However, t(8;21) alone cannot induce leukemia. Additional mutations are necessary for the development of AML (17).

Translocation (8;21) is one of the most common AML cytogenetic abnormalities, occurring in 7% to 8% of adult cases and 11.7% of pediatric cases (8). As mentioned before, most cases present with M2 morphology. The incidence ranges from one third to 46% for M2 cases with an abnormal karyotype (19,20). A study of childhood leukemia in a single institute showed that 82% of AML cases with t(8;21) were M2 cases and that 23% had granulocytic sarcoma (21). A German study revealed that, among AML cases with t(8;21), 12.5% were M2, 1.7% M1, 0.09% M3 to M7, and 0% M0 (22). Other studies reported t(8;21) in cases of M1, M4, M4Eo, chronic myeloid leukemia, and myelodysplastic syndrome (4,5,23, 24, 25, 26 and 27). However, in the light of the World Health Organization (WHO) definition, those cases of myelodysplastic syndrome should probably be classified as AML cases (1).


TABLE 6.4.2


Immunophenotypic and Molecular Genetic Features in Acute Myeloid Leukemia (AML) with t(8;21)(q22;q22)


1.


Cluster of differentiation (CD)19 (>10%) and CD34 (>35%) in a myeloid population


2.


Presence of CD56 predicting unfavorable prognosis with potential development of granulocytic sarcoma


3.


Demonstration of PAX5 and CD79a by immunohistochemistry


4.


Karyotype: t(8;21)(q22;q22)


5.


Molecular biology: AML1/ETO (eight twenty-one)


The positive rate for this abnormality is higher when studied with molecular biology techniques (4,5,28). In a study of 64 patients, Andrieu et al. (5) detected 8% cases with t(8;21) by karyotyping, but 16% of cases showed AML1/ ETO by an RT-PCR assay. In a survey from the Cancer and Leukemia Group B (CALGB), AML1/ETO was detected in other abnormal karyotypes, such as t(8;10)(q22;q26) and t(1;10;8)(p22;p13;q22) (28). Other complex translocations such as t(8;12;21) and t(8;17;21) have been reported (29,30). By the FISH method, the presence of AML1/ETO in other karyotypes was found to be the result of cryptic insertion (28,31). The abnormality can be the AML1 gene inserts into 8q22 or ETO into 21q22. In a large number of patients, additional chromosome abnormalities or complex translocation are identified (1,8). The AML1/ETO fusion product can be detected by RT-PCR even when the patient is in remission for as long as 8 years (19). The immunophenotypic and molecular genetic features of AML with t(8;21) are summarized in Table 6.4.2.


Clinical Manifestation

AML-M2 with t(8;21) is frequently seen in patients younger than 60 years, particularly children. The special chromosomal abnormality is not usually seen in elderly AML patients, with a frequency <2% (8). The majority of cases with t(8;21) occur in primary de novo AML cases. However, it is also present occasionally in secondary AML patients.

The clinical symptoms of AML with t(8;21) are similar to those seen in other acute leukemias, namely bone marrow failure. A particular frequent presentation is granulocytic (myeloid) sarcoma, which involves solid organs, and the bone marrow may show <20% of myeloblasts (1). In one study, the complete remission rate in patients with myeloid sarcoma was 50% as compared to 94% in those without myeloid sarcoma (7).These patients also had a significantly shorter survival.

In general, t(8:21) confers a favorable prognosis; adult patients usually have a good response to chemotherapy, with high remission rates and long-term disease-free survival when treated with high dose cytarabine (1). Pediatric patients, however, have a much less favorable response than adult patients do (24).


Besides age and the presence of myeloid sarcoma, immunophenotype also affects the prognosis. The presence of CD56 usually relates to inferior disease-free survival (9). This study also found that myeloid sarcoma was present exclusively in cases with CD56 expression. The association of leukocyte count and prognosis in this entity is inconclusive. However, the so-called white blood cell (WBC) index, calculated as the product of WBC count by the percentage of blasts in the bone marrow, was a more reliable and independent predictor for relapse-free survival (32).


REFERENCES

1. Brunning RD, Matutes E, Flandrin G, et al. Acute myeloid leukemia with recurrent genetic abnormalities. In: Jaffe ES, Harris NL, Stein H, Vardiman JW, eds. Tumours of Haematopoietic and Lymphoid Tissue. Lyon, France: IARC Press; 2001:81-87.

2. Bennett JM, Catovsky D, Daniel MT, et al. Proposed revised criteria for the classification of acute myeloid leukemia: a report of the French-American-British Cooperative Group. Ann Intern Med. 1985;103:620-624.

3. Willman CL. Acute leukemias: a paradigm for the integration of new technologies in diagnosis and classification. Mod Pathol. 1999;12:218-228.

4. Nucifora G, Dickstein JI, Torbenson V, et al. Correlation between cell morphology and expression of the AML1/ETO chimeric transcript in patients with acute myeloid leukemia without the t(8;21). Leukemia. 1994;8:1533-1538.

5. Andrieu V, Radford-Weiss I, Troussard X, et al. Molecular detection of t(8;21)/AML1-ETO in AML M1/M2: correlation with cytogenetics, morphology and immunophenotype. Br J Haematol. 1996;92:855-865.

6. Tallman MS, Hakimian D, Shaw JM, et al. Granulocytic sarcoma is associated with the 8;21 translocation in acute myeloid leukemia. J Clin Oncol. 1993;11:690-697.

7. Byrd JC, Weiss RB, Arthur DC, et al. Extramedullary leukemia adversely affects hematologic complete remission rate and overall survival in patients with t(8;21) (q22;q22): results from Cancer and Leukemia Group B 8461. J Clin Oncol. 1997;15:466-475.

8. Ferrara F, Vecchio LD. Acute myeloid leukemia with t(8;21)/AML1/ETO: a distinct biological and clinical entity. Haematologica. 2002;87:306-319.

9. Baer MR, Stewart CC, Lawrence D, et al. Expression of the neural cell adhesion molecule CD56 is associated with short remission duration and survival in acute myeloid leukemia with t(8;21)(q22;q22). Blood. 1997;90:1643-1648.

10. Wang YY, Zhou GB, Yin T, et al. AML1-ETO and C-KIT mutation/overexpression in t(8;21) leukemia: implication in stepwise leukemogenesis and response to Gleevec. Proc Natl Acad Sci USA. 2005;102:1104-1109.

11. Ferrara F, Di Noto R, Annunuziata M, et al. Immunophenotypic analysis enables the correct prediction of t(8;21) in acute myeloid leukaemia. Br J Haematol. 1998; 102:444-448.

12. Hurwitz CA, Raimondi SC, Head D, et al. Distinctive immunophenotypic features of t(8;21)(q22;q22) acute myeloid leukemia in children. Blood. 1992;80:3182-3188.

13. Basso G, Buldini B, De Zen L, et al. New methodologic approaches for immunophenotyping acute leukemia. Haematologica. 2001;86;675-692.

14. Tiacci E, Pileri S, Orieth A, et al. PAX5 expression in acute leukemias: higher B-lineage specificity than CD79a and selective association with t(8;21)-acute myelogenous leukemia. Cancer Res. 2004;64:7399-7404.

15. Kozmik Z, Wang S, Dorfler P, et al. The promoter of the CD19 gene is a target for the B-cell specific transcription factor BSAP. Mol Cell Biol. 1992;12:2662-2672.

16. Fitzsimmons D, Hodsdon W, Wheat W, et al. Pax-5 (BSAP) recruits Ets protooncogene family proteins to form functional ternary complexes on a B-cell-specific promoter. Genes Dev. 1996;10:2198-2211.

17. Peterson LF, Zhang DE. The 8;21 translocation in leukemogenesis. Oncogene. 2004;23:4255-4262.

18. Roumier C, Fenaux P, Lafage M, et al. New mechanisms of AML1 gene alteration in hematological malignancies. Leukemia. 2003;17:9-16.

19. Nucifora G, Rowley JD. The AML and ETO genes in acute myeloid leukemia with a t(8;21). Leuk Lymphoma. 1994;14: 353-362.

20. Caligiuri MA, Strout MP, Gilliland DG. Molecular biology of acute myeloid leukemia. Semin Oncol. 1997;24:399-408.

21. Rubnitz JE, Raimondi SC, Halbert AR, et al. Characteristics and outcome of t(8;21)-positive childhood acute myeloid leukemia: a single institution’s experience. Leukemia. 2002;16:2072-2077.

22. Klaus M, Haferlach T, Schnittger S, et al. Cytogenetic profile in de novo acute myeloid leukemia with FAB subtypes M0, M1, and M2: a study based on 652 cases analyzed with morphology, cytogenetics, and fluorescence in situ hybridization. Cancer Genet Cytogenet. 2004;155:47-56.

23. Downing JR, Head DR, Curchi-Brent MG, et al. An AML1/ ETO fusion transcript is consistently detected by RNA-based polymerase chain reaction in acute myelogenous leukemia containing the (8;21)(q22;q22) translocation. Blood. 1993;81: 2860-2865.

24. Nucifora G, Rowley JD. AML1 and the 8;21 and 3:21 translocations in acute and chronic myeloid leukemia. Blood. 1995;86:1-14.

25. Kojima K, Omonot E, Hara M, et al. Myelodysplastic syndrome with translocation (8;21): a distinct myelodysplastic syndrome entity or M2-acute myeloid leukemia with extensive myeloid maturation: Ann Hematol. 19981;76:279-282.

26. Mathew S, Shurtleff S, Ribeiro RC, et al. A complex variant t(8;21) involving chromosome 3 in a child with acute myeloblastic leukemia with eosinophilia (AML M4Eo). Leuk Lymphoma. 2003;44:183-187.

27. Yan CC, Medeiros LJ, Glassman AB, et al. t(8;21)(q22;q22) in blast phase of chronic myelogenous leukemia. Am J Clin Pathol. 2004;121:836-842.

28. Mrozek K, Prior TW, Edwards C, et al. Comparison of cytogenetic and molecular genetic detection of t(8;21) and inv(16) in a prospective series of adults with de novo acute myeloid leukemia: a Cancer and Leukemia Group B study. J Clin Oncol. 2001;19:2482-2492.

29. Farra C, Awwad J, Valent A, et al. Complex translocation (8;12;21): a new variant of t(8;21) in acute leukemia. Cancer Genet Cytogenet. 2004;155:138-142.

30. Miyagi J, Kakazu N, Masuda M, et al. Acute myeloid leukemia (FAB-M2) with a masked type of t(8;21) translocation revealed by spectral karyotyping. Int J Hematol. 2002;76:338-343.

31. Urioste M, Martinez-Ramirez A, Cigudosa JC, et al. Identification of ins(8;21) with AML1/ETO fusion in acute myelogenous leukemia M2 by molecular cytogenetics. Cancer Genet Cytogenet. 2002;133:83-86.

32. Dombret H, N’Guyen S, Leblanc T. Prognostic factors in t(8;21) acute myeloid leukemia (AML): an overview from the French AML Intergroup (LAME, GOELAM, BGMT, ALFA, SFGM) [abstract]. Hematol J. 2001;1(Suppl 1):196a(abst).


CASE 5 Acute Myeloid Leukemia with inv(16)(p13q22) or t(16;16)(p13;q22)


CASE HISTORY

A 52-year-old man presented with shortness of breath, fatigue, and hypersomnolence for 5 months. He was transferred from another hospital for evaluation of likely leukemia. Physical examination on admission was unremarkable except for pale conjunctivae, ecchymosis on the right hand, and a palpable cervical lymph node. There was no hepatosplenomegaly. Hematology workup showed a total leukocyte count of 38,400/µL with 57% blasts, 3% neutrophils, 32% monocytes, and 8% lymphocytes. A bone marrow biopsy revealed 51% myeloblasts, 24% monoblasts, 13% myeloid cells of various stages, 7% eosinophils, 8% monocytes, and 1.5% erythroid elements. He was then treated with cytarabine and daunorubicin. The clinical course was complicated with neutropenic fever, Clostridium difficile colitis, and possible candidiasis in the liver and spleen, as demonstrated by computed tomography (CT) imaging. All the complications were gradually gotten under control by antibiotic therapy and transfusion. The second bone marrow biopsy demonstrated no leukemic cells. The patient was discharged 1 month after admission.


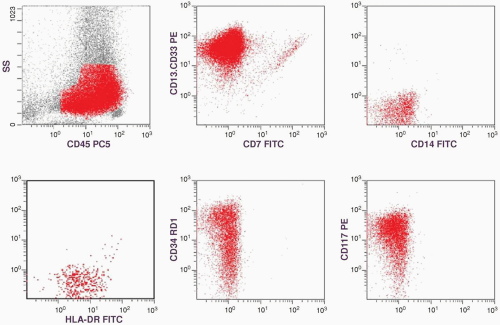
FIGURE 6.5.1 Flow cytometric analysis of bone marrow shows positive reactions with cluster of differentiation (CD)13.CD33, CD7, CD14, human leukocyte antigen-DR (HLA-DR), CD34, and CD117. ss, side scatter; PE, phycoerythrin, RD1, rhodamine; FITC, fluorescence in situ hybridization.


FLOW CYTOMETRIC FINDINGS

Bone marrow: Myeloid cells: Myeloperoxidase 97%, CD13-CD33 96%, CD14 34%, CD13-CD33/CD7 0%, and human leukocyte antigen-DR (HLA-DR) 88%. Stem cell markers: CD34 85%, CD117 96% (Fig. 6.5.1).


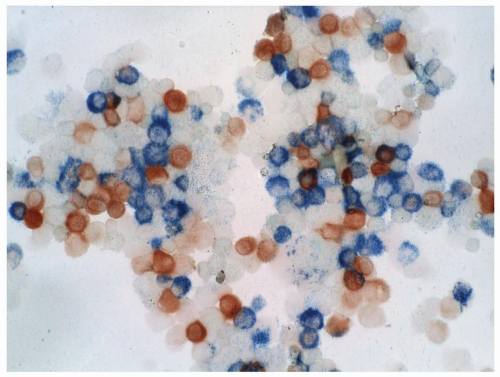
FIGURE 6.5.2 Combined esterase stain of the bone marrow cytospin shows chloroacetate esterase stain (blue) of the myeloid cells and α-naphthyl butyrate esterase stain (brown) of the monocytoid cells. 40x magnification.


CYTOCHEMICAL FINDINGS

In the bone marrow, the myeloperoxidase stain was positive in both myeloblasts and monoblasts as well as the maturing myelomonocytic cells. The chloroacetate esterase stain identified about 70% myeloid cells, and the α-naphthyl butyrate esterase stain identified 30% monocytic cells (Fig. 6.5.2).


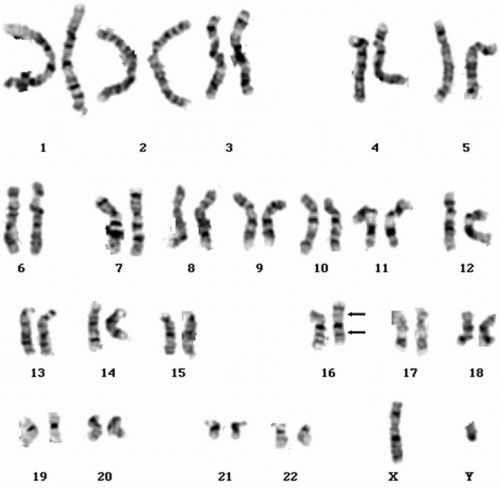
FIGURE 6.5.3 Karyotype of the bone marrow reveals inversion of chromosome 16 (arrows). (Courtesy of Peter Papenhausen, Ph.D., LabCorp of America Cytogenetics Department.)


CYTOGENETIC FINDING

The bone marrow showed a karyotype as following: 46,XY, del(7)(q22q34), inv(16)(p13q22) [8]/48,idem, +9, +22 [3]/46, XY [9] (Fig. 6.5.3 shows only inv(16)(p13q22)).


DISCUSSION

Acute myeloid leukemia (AML) with inv(16)(p13q22) or t(16;16)(p13;q22) is seen predominantly in cases of acute myelomonocytic leukemia with eosinophilia (AML M4Eo). It accounts for approximately 5% of all patients with AML and 20% of AML-M4 cases (1). However, this karyotype has also been encountered in other subtypes of AML, chronic myeloid leukemia and myelodysplastic syndromes (2,3). In the study by Mitelman and Heim (4), 206 of the total 241 inv(16) cases were diagnosed as M4 subtype. However, this aberration was also demonstrated in 17 M2 cases, 10 M5 cases, and 1 to 3 cases each of M1, M6, and M7. M0, M1, M2, M4, and M5 have been reported in other studies (2,5,6). In one study, approximately 10% of M4 cases without
eosinophilia showed this karyotype (7). Inv(16) has also been reported in several cases of chronic myeloid leukemia with blast crisis, in which bone marrow eosinophilia was also observed (2).

In the current case, the bone marrow showed approximately 70% myeloid cells and 30% monocytic cells, as identified by cytochemical stain, a ratio that is roughly equivalent to the morphologic differential count. Flow cytometric analysis also showed positive myelomonocytic markers with high percentages of CD34 and CD117, which is consistent with acute myelomonocytic leukemia. Bone marrow eosinophil count is >5%; therefore, it fulfills the definition of M4Eo. Cytogenetic study of the bone marrow shows a complex karyotype including inv(16)(p13q22); thus, it is considered to be AML with inv(16).


Morphology and Cytochemistry

The French-American-British (FAB) definition of M4 is that the myeloid or monocytic component, whichever is the majority, should not be >80% of the nonerythroid population in the bone marrow (8) (Figs. 6.5.4 and 6.5.5). In addition, the percentage of the blast, which is composed of myeloblasts and monoblasts, should be >30%. The cell lineage identification is based on cytochemical stains: myeloperoxidase, specific esterases, and nonspecific esterases (see Case 7). The World Health Organization (WHO) system lowers the cutoff of the blast count to 20%. However, in AML with inv(16) or t(16;16), the blast count can be <20% and it is still acceptable for AML (9). The peripheral blood may show monocytosis but usually no eosinophilia (Fig. 6.5.6).

The eosinophils in these cases usually show all stages of maturation (9). Abnormal eosinophilic granules are often seen in the myelocyte and promyelocyte stages. In those eosinophils, there are mixed eosinophilic and basophilic, or purple-violet granules (Fig. 6.5.7). These granules are larger than those in normal eosinophils of the same stage, and sometimes the granules are so numerous that they obscure the nucleus.


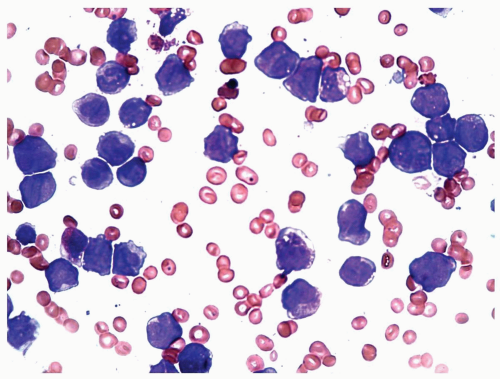
FIGURE 6.5.4 Bone marrow aspirate shows various developmental stages of myelomonocytic cells. Wright-Giemsa, 60x magnification.


FIGURE 6.5.5 Bone marrow core biopsy reveals hypercellular marrow composed of immature myelomonocytic cells. Eosinophilia is evident. Hematoxylin and eosin, 40x magnification.

Cytochemical stains of these abnormal eosinophils also differ from those of normal eosinophils. Unlike their normal counterparts, these eosinophils react with chloroacetate esterase and periodic acid-Schiff (10). The basophilic granules are positive for myeloperoxidase and negative for toluidine blue; these reactions are opposite of the reactions seen in normal basophils (10). Ultrastructurally, the abnormal eosinophils are characterized by the absence of well-formed central crystalloids in the cytoplasmic granules (10). Eosinophils contain high levels of lysozyme, so that an elevated serum lysozyme value cannot be used as a criterion for monocytic differentiation when eosinophilia is present in an AML case (11). For instance, M2 with eosinophilia may have a high lysozyme concentration in the blood.


FIGURE 6.5.6 Peripheral blood smear shows monocytosis. Wright-Giemsa, 60x magnification.


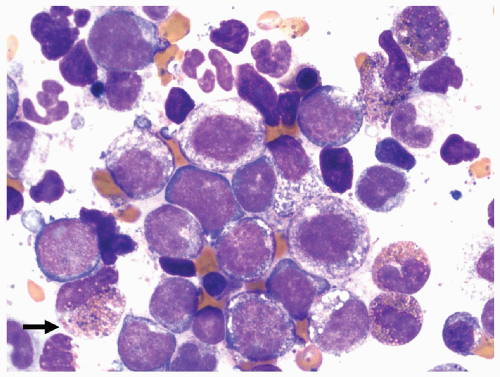
FIGURE 6.5.7 Bone marrow aspirate reveals immature myelomonocytic cells with the presence of basophilic granules in a few immature eosinophils (arrow). 100x magnification.

Whether the eosinophils are leukemic cells in M4Eo cases is controversial. There was one report showing inv(16) in the eosinophils of an M4Eo case (12), but this result has not been confirmed by other studies. Eosinophilia can sometimes behave as a preleukemic syndrome leading to M4 (13,14).

A study of 21 cases showed that dysplasia is a prominent feature in AML with inv(16), which is associated with a significantly higher proliferation rate, as demonstrated by immunohistochemical staining with Mib-1 (Ki-67) (15). However, apoptotic rate in M4Eo is similar to that in other AML subtypes.


Immunophenotype

As in other types of AML, the blasts of M4Eo express CD13, CD33, myeloperoxidase, and HLA-DR. In addition, monocytic component is represented by one or more of the monocytic markers, such as CD4, CD11b, CD11c, CD14, CD36, CD64, and lysozyme (9,16). The malignant nature of the leukemic cells is identified by the presence of CD34 and CD117 (17). These markers, however, can be demonstrated in acute myelomonocytic leukemia with or without eosinophils. The only specific marker for this type of AML is CD2, which is coexpressed with myeloid markers (16). In cell culture of two M4Eo cases, the addition of CD2 antibodies caused reduced cell proliferation. It is therefore assumed that the CD2 molecule may stimulate the proliferation of the leukemic cells and cause a high leukocyte count in M4Eo (16).

Terminal deoxynucleotidyl transferase (TdT) expression has been reported in two studies (16,18). The TdT-positive cells were seen exclusively in the CD34+ CD14-subpopulation (16).


Comparison of Flow Cytometry and Immunohistochemistry

Immunohistochemical staining may demonstrate myeloperoxidase, lysozyme, CD68, CD34, and CD117. In comparison, flow cytometry is preferred to immunohistochemistry, because the histogram of flow cytometry may demonstrate the heterogeneous cell populations with more markers.


Molecular Genetics

In M4Eo cases, three abnormal karyotypes involving chromosome 16 can be demonstrated: inv(16)(p13q22), t(16;16)(p13;q22), and del(16)(q22). Most cases carry the inv(16) karyotype, and del(16q) is least frequently seen. One study showed marked differences in survival and remission duration between the inv(16) or t(16;16) patients and those with del(16q) (3).

Cloning of the 16p and 16q breakpoints identified the core binding factor (CBF)β and smooth muscle myosin heavy chain (MYH)11 genes located at 16q22 and 16p13, respectively (2). The MYH11 gene codes for a smooth muscle myosin heavy-chain gene. The CBFβ gene, also known as polyoma enhancer binding protein (PEBP)2β, codes for the β subunit of CBF, a heterodimeric transcription factor. The α subunit of CBF is identical to the AML1 gene, which is involved in t(8;21) translocation (see Case 4). In vitro analysis showed that the murine CBFβ gene formed a heterodimeric complex with CBFα thus stabilizing its interaction with DNA (7). As both t(8;21) and inv(16) or t(16;16) are characterized by the disruption and transcriptional deregulation of genes encoding subunits of the CBF, which is involved in the regulation of normal hematopoiesis, these two types of AML are called CBF AML (19). However, the fusion gene CBFβ-MYH11 may not be sufficient for leukemogenesis; additional genes may be involved in the pathogenesis (20).

The CBFβ-MYH11 fusion gene can be detected by reverse transcriptase-polymerase chain reaction (RT-PCR). RT-PCR studies demonstrated the existence of marked molecular heterogeneity in terms of breakpoint location, and eight types of fusion transcripts have been reported, with the A type being most common (88%) (2). A J type has been reported recently (21).

Cytogenetic detection of inversions and small deletions of chromosome 16 by standard karyotyping can be difficult (7). The detection of such cytogenetic abnormalities is affected by the ability to obtain adequate metaphases and the coexistence of normal metaphases (7). Several studies have demonstrated the higher sensitivities with fluorescence in situ hybridization (22, 23 and 24) and RT-PCR (2,7) techniques than with the conventional karyotyping. One report showed no cytogenetic abnormality by conventional karyotyping and FISH in a case of M4Eo, but CBFβ-MYH11 was identified by RT-PCR (25).

Cases with inv(16) are often accompanied by additional abnormalities with a frequency as high as 50% in one study (3). However, the presence of additional changes does not affect the response to therapy or the survival (26,27). Only one report suggested that coexistence of inv(16) and partial deletion of the CBFβ gene could be associated with unfavorable prognosis (24). The salient features for laboratory diagnosis of AML with inv(16) or t(16;16) are summarized in Table 6.5.1.


TABLE 6.5.1


Salient Features for Laboratory Diagnosis of AML with inv(16)(p13q22) or t(16;16)(p13:q22)


1.


Karyotype: inv(16)(p13q22), t(16;16)(p13;q22), or del(16)(q22)


2.


Molecular characterization by FISH or RT-PCR: CBFβ-MYH11 fusion gene


3.


Presence of >20% myeloblasts and monoblasts in the bone marrow; <20% blasts is acceptable when typical karyotype or molecular pattern is identified


4.


Bone marrow contains myeloid and monocytoid cells with the minor cell component >20%


5.


Bone marrow contains >5% eosinophils. Absence of eosinophilia is acceptable. Eosinophils are abnormal in cytoplasmic granules and cytochemical stains.


6.


Immunophenotype: Flow cytometry may demonstrate myelomonocytic markers (CD13, CD33, myeloperoxidase, CD14, CD11b, CD11c) and immature cell markers (CD34 and CD117). One special marker is CD2, a T-cell marker that is coexpressed with myeloid markers.


FISH, fluorescence in situ hybridization; RT-PCR, reverse transcription-polymerase chain reaction; CBF, core binding factor; MYH, smooth muscle myosin heavy chain gene; CD, cluster of differentiation.


Clinical Manifestations

AML with inv(16) or t(16;16) has been reported in all age groups, but it is predominantly seen in young patients. CBF AML accounts for up to 20% of young adult cases of de novo AML (25). In a study of 43 pediatric cases of AML in Hong Kong, 5 patients were found to have this abnormality (28).

AML with inv(16) or t(16;16) is usually associated with a favorable prognosis in terms of complete remission and the duration of remission and survival when compared with other AML M4 cases with similar treatment (7). There is no clinical difference between patients with inv(16) and those with t(16;16) (2,3,29). However, patients with del(16q) are different; the outcome of those patients was not better than that of other AML M4 patients in one study (3). In addition, del(16q) cases lack relapse in the central nervous system (CNS) and have lower incidence of eosinophilia and M4 subtype (3).

Clinical symptoms are similar to those seen in other M4 cases. Specific features of AML with inv(16) include a high leukocyte count, hepatosplenomegaly, and high incidence of CNS leukemia, manifested as leptomeningeal disease and intracerebral myeloblastomas (16). Myeloid sarcoma may be present at initial diagnosis or at relapse (9).


REFERENCES

1. Larson RA, Williams SF, Le Beau MM, et al. Acute myelomonocytic leukemia with abnormal eosinophils and inv(16) and t(16;16) has a favorable prognosis. Blood. 1986;68:1242-1249.

2. Liu PP, Hajra A, Wijmenga C, et al. Molecular pathogenesis of the chromosome 16 inversion in the M4E0 subtype of acute myeloid leukemia. Blood. 1995;85:2289-2302.

3. Marlton P, Keating M, Kantarjian H, et al. Cytogenetic and clinical correlates in AML patients with abnormalities of chromosome 16. Leukemia. 1995;9:965-971.

4. Mitelman F, Heim S. Quantitative acute leukemia cytogenetics. Genes Chrom Cancer. 1992;5:57-66.

5. Mitterbauer M, Laezika K, Novak M, et al. High concordance of karyotype analysis and RT-PCR for CBFβ/MYH11 in unselected patients with acute myeloid leukemia. A single center study. Am J Clin Pathol. 2000;113:406-410.

6. Razzouk BI, Raimondi SC, Srivastava DK, et al. Impact of treatment on the outcome of acute myeloid leukemia with inversion 16: a single institution’s experience. Leukemia. 2001;15:1326-1330.

7. Poirel H, Radford-Weiss I, Rack K, et al. Detection of the chromosome 16 CBFβ-MYH11 fusion transcript in myelomonocytic leukemias. Blood. 1995;85:1313-1322.

8. Bennett JM, Catovsky D, Daniel MT, et al. Proposed revised criteria for the classification of acute myeloid leukemia: a report of the French-American-British Cooperative Group. Ann Intern Med. 1985;103:620-624.

9. Brunning RD, Matutes E, Flandrin G, et al. Acute myeloid leukaemia with recurrent genetic abnormalities. In: Jaffe ES, Harris NL, Stein H, Vardiman JW, eds. Tumours of Haematopoietic and Lymphoid Tissues. Lyon, France: IARC Press; 2001:81-87.

10. Brunning RD. Acute myeloid leukemia. In: Knowles DM, ed. Neoplastic Hematopathology. 2nd ed. Philadelphia: Lippincott Williams & Wilkins; 2001:1667-1715.

11. Moscinski LC, Kasnic G Jr, Saker A Jr, et al. The significance of an elevated serum lysozyme value in acute myelogenous leukemia with eosinophilia. Am J Clin Pathol. 1992;97:195-201.

12. Nakamura H, Sadamori N, Tagawa M, et al. Inversion of chromosome 16 in bone marrow eosinophils of acute myelomonocytic leukemia (M4) with eosinophilia. Cancer Genet Cytogenet. 1987;29:327-330.

13. Abbondanzo SL, Gray RG, Whang-Pang J, et al. A myelodysplastic syndrome with marrow eosinophilia terminating in acute nonlymphocytic leukemia, associated with an abnormal chromosome 16. Arch Pathol Lab Med. 1987;111: 330-332.

14. Brown NJ, Stein RS. Idiopathic hypereosinophilic syndrome progressing to acute myelomonocytic leukemia. South Med J. 1989;821:1303-1305.

15. Sun X, Medeiros LJ, Lu D, et al. Dysplasia and high proliferation rate are common in acute myeloid leukemia with inv(16)(p13q22). Am J Clin Pathol. 2003;120:236-245.

16. Adriaansen HJ, te Broekhorst PAW, Hagemeijer AM, et al. Acute myeloid leukemia M4 with bone marrow eosinophilia (M4Eo) and inv(16)(p13q22) exhibits a specific immunophenotype with CD2 expression. Blood. 1993;81:3043-3051.

17. Hans CP, Finn WG, Singleton TP, et al. Usefulness of anti-CD117 in the flow cytometric analysis of acute leukemia. Am J Clin Pathol. 2002;117:301-305.

18. Paietta E, Papenhausen P, Azar C, et al. Inv(16) occurring in a case of acute biphenotypic leukemia lacking monocytic markers: multiple but short remissions. Cancer Genet Cytogenet. 1987;25:367-368.

19. Ferrara F, Vecchio LD. Acute myeloid leukemia with t(8;21)/AML1/ETO: a distinct biological and clinical entity. Haematologica. 2002;87:306-319.

20. Castilla LH, Perrat P, Martinez NJ, et al. Identification of genes that synergize with Cbfb-MYH11 in the pathogenesis of acute myeloid leukemia. Proc Natl Acad Sci U S A. 2004;101:4924-4929.


21. Trnknova Z, Pekova S, Bedrlikova R, et al. Type J CBFbeta/MYH11 transcript in the M4Eo subtype of acute myeloid leukemia. Hematology. 2003;8:115-117.

22. Dierlamm J, Stul M, Vranckx H, et al. FISH identifies inv(16)(p13q22) masked by translocations in three cases of acute myeloid leukemia. Genes Chrom Cancer. 1998; 22:87-94.

23. Hernandez JM, Gonzalez MB, Granada I, et al. Detection of inv(16) and t(16;16) by fluorescence in situ hybridization in acute myeloid leukemia M4Eo. Haematologica. 2002; 85:481-485.

24. Egan N, O’Reilly J, Chipper L, et al. Deletion of CBFβ in a patient with acute myelomonocytic leukemia (AML M4Eo) and inversion 16. Cancer Genet Cytogenet. 2004;154:60-62.

25. Ravandi F, Kadkol SS, Ridgeway J, et al. Molecular identification of CBFβ-MYH11 fusion transcripts in an AML M4Eo patient in the absence of inv16 or other abnormality by cytogenetic and FISH analyses-a rare occurrence. Leukemia. 2003;17:1907-1910.

26. Grinwade D, Walker H, Oliver F, et al. The importance of diagnostic cytogenetics on outcome in AML: analysis of 1612 patients entered into the MRC AML 10 trial. The Medical Research Council Adult and Children’s Leukaemia Working Parties. Blood. 1998;92:2322-2333.

27. Schoch C, Buchner T, Freund M, et al. Fifty-nine cases of acute leukemia with inversion inv(16)(p13q22): do additional chromosomal aberrations influence prognosis? In: Buchner T, et al., eds. Acute Leukemias VI. Prognostic Factors and Treatment Strategies. Berlin-Heidelberg: Springer-Verlag; 1997:11-16.

28. Chan NPH, Wong WS, Ng MHL, et al. Childhood acute myeloid leukemia with CBFβ-MYH11 rearrangement: study of incidence, morphology, cytogenetics, and clinical outcomes of Chinese in Hong Kong. Am J Hematol. 2004; 76:300-303.

29. Martinet D, Muhiematter D, Leeman M, et al. Detection of 16 p deletions by FISH in patients with inv(16) or t(16;16) and acute myeloid leukemia (AML). Leukemia. 1997;11:964-970.


CASE 6 Acute Promyelocytic Leukemia with t(15;17)


CASE HISTORY

A 53-year-old man was admitted to the hospital because of continuous nosebleeds and gum bleeding after tooth brushing over 5 days prior to admission. The patient was in his usual state of health until 2 weeks ago when he developed fatigue, night sweats, fevers, and chills after visiting his dying mother in another state. He also claimed to have lost 5 pounds since then. However, it was his nosebleeds that brought him to the hospital.


FIGURE 6.6.1 Bone marrow core biopsy shows total replacement of normal hematopoietic cells by the leukemic promyelocytes. Note many bilobed cells (arrow) are present. The abundant eosinophilic cytoplasm represents hypergranularity. Hematoxylin and eosin, 100x magnification.

His physical examination on admission showed no bruises or petechiae on the skin and no hepatosplenomegaly. His total leukocyte count was 1,900/µL, hematocrit 24%, hemoglobin 8.5 g/dL, and platelets 19,000/µL. His absolute neutrophil count was 100/µL, lymphocytes 1,600/µL, and monocytes 100/µL. Coagulation studies revealed fibrinogen 257 mg/dL, prothrombin time 15 seconds, and absence of D-dimer. Because of the presence of atypical bilobed cells in the peripheral blood, a bone marrow biopsy was performed (Fig. 6.6.1), which demonstrated features of acute promyelocytic leukemia (APL). Cytogenetic study of the bone marrow revealed t(15;17).

The patient was treated with all-trans-retinoic acid (ATRA) leading to complete remission. However, despite consolidation therapy, the patient had a relapse of leukemia 18 months after initial treatment. The patient has since switched to arsenic trioxide (ATO) treatment and is now in complete remission.


FLOW CYTOMETRY FINDINGS

Bone marrow: B-cell markers: CD19 0%, κ 0%, λ 0%; T-cell markers: CD3 0%, CD7 0%; myeloid markers: CD13-CD33 99%, myeloperoxidase (MPO) 75%, CD14 1%, human leukocyte antigen-DR (HLA-DR) 2%. Stem cell markers: CD34 52% (Fig. 6.6.2).


FIGURE 6.6.2 Flow cytometric histograms show strongly positive CD33 and weakly positive CD34 but negative human leukocyte antigen-DR (HLA-DR). ss, side scatter; PE, phycoerythrin; FITC, fluorescence in situ hybridization; RD1, rhodamine; PC5, phycoerythrin cyanin 5.


CYTOCHEMICAL FINDINGS

Leukemic cells from both the peripheral blood and bone marrow were positive for MPO and chloroacetate esterase (CAE) stains, but were negative for α-naphthyl butyrate esterase (NBE) stain. CAE stain also demonstrated single and multiple Auer rods in leukemic cells (Fig. 6.6.3).


DISCUSSION

APL accounts for only 5% to 13% of all cases of acute myeloid leukemia (AML), but it is the most well-defined subtype of AML (1). Cytologically, it differs from other AML in that the leukemic cells are not at the blastic stage but are atypical promyelocytes. Clinically, it is characterized by the presence of leukopenia in most cases rather than leukocytosis as seen in other leukemia and by the frequent existence of a hemorrhagic syndrome at the acute stage. Molecular genetically, it shows a nonrandom karyotype of t(15;17)(q22;q12) with the molecular characteristic of promyelocytic leukemia retinoic acid receptor α (PML/RARα) fusion transcript in the majority of cases. It is one of the rare examples of leukemia for which an effective treatment has been established by understanding its molecular genetic abnormality. The therapeutic mechanism of ATRA is to induce differentiation of the leukemic cells by reversing the transcriptional repression of PML/RARα.


FIGURE 6.6.3 Combined esterase stain of the bone marrow aspirate shows multiple Auer rods demonstrated by chloroacetate esterase (blue) stain in a few leukemic cells (arrow). 100x magnification.


Morphology and Cytochemistry

The leukemic cells in most cases of APL assume the morphology of hypergranular promyelocytes and are considered the typical cells in AML-M3 (French-American-British [FAB] classification). These leukemic cells are generally larger (14 to 25 µm) than normal promyelocytes and are devoid of a prominent paranuclear clear Golgi region, as is frequently seen in normal promyelocytes (2). The most characteristic feature is the abundance of cytoplasmic granules that cover the entire cytoplasm and mask the nucleus of the leukemic cells (Figs. 6.6.4 and 6.6.5). The nuclei of the APL cells show a great variation both in size and in shape, but many of them are kidney-shaped or bilobed. The cytoplasmic granules are believed to contain MPO, procoagulant substances, and bactericidal enzymes (3).


FIGURE 6.6.4 Peripheral blood smear shows several hypergranular promyelocytes with the nuclei being masked by the cytoplasmic granules. Note one promyelocyte contains multiple Auer rods (arrow). Wright-Giemsa, 100x magnification.


FIGURE 6.6.5 Bone marrow aspirate shows many leukemic promyelocytes, and two reveal multiple Auer rods (arrows). Wright-Giemsa, 100x magnification.

However, the above features are not diagnostic for APL unless multiple Auer rods in bundles are demonstrated in the cytoplasm of the leukemic cells. These cells are commonly referred to as faggot cells. The Auer rods in APL cells show an internal, hexagonal tubular structure with a periodicity of 22 to 25 nm in contrast to the 8 to 12 nm periodicity of the Auer rods observed in other types of AML (4).

In approximately 15% to 20% of APL cases, the leukemic cell contains only a few cytoplasmic granules or the granules are so small (<250 µm resolution of light microscopy) that they can only be demonstrated by electron microscopy (5, 6 and 7). These cases are coined hypogranular or microgranular APL, respectively, and are designated AML-M3v in the FAB classification. In M3v cases, the nuclei of the leukemic cells are usually folded or bilobed, mimicking those of monocytes (Fig. 6.6.6).

A rare type of hyperbasophilic microgranular variant is characterized by cells with a high nuclear cytoplasmic ratio, strongly basophilic cytoplasm with sparse or no
granules, and conspicuous cytoplasmic budding mimicking micromegakaryocytes (8,9). A hand-mirror variant of M3v has also been described (10).


FIGURE 6.6.6 Peripheral blood smear shows several hypogranular promyelocytes with bilobed or folded nuclei, mimicking monocytes. Wright-Giemsa, 100x magnification.

APL cases usually are positive for both MPO and CAE stains. MPO and Sudan black B stains are usually strongly positive (4,9). CAE is particularly helpful in demonstrating the multiple Auer rods. MPO may also serve the same function, but false-positive results may occur due to precipitation of reagents. Among nonspecific esterase, NBE is generally negative in APL cases, but NBE reaction can be seen in certain subgroups of APL cases (11).


Immunophenotype

Because APL may mimic acute monocytic leukemia, flow cytometry is particularly helpful in demonstrating positive myelomonocytic antigens (CD13, CD15, and CD33) but negative monocytic antigens (CD14 including My4, Leu M3, and Mo2) (3,12, 13, 14, 15, 16 and 17). However, the most important diagnostic feature is the absence or low percentage of HLA-DR. HLA-DR is present in myeloblasts and monoblasts but not promyelocytes; therefore, the absence of HLA-DR distinguishes APL from other subtypes of AML. Nevertheless, HLA-DR is also absent in normal promyelocytes, thus APL has to be distinguished from reactive promyelocytosis. Postchemotherapy specimens from other AML subtypes sometimes show synchronous regeneration of promyelocytes that may also mimic APL (Fig. 6.6.7).

The stem cell marker, CD34, is frequently absent in APL cases and is also used to separate APL from other AML cases (13,16, 17 and 18). However, CD34 positivity was demonstrated in 41% of APL cases in one study (19). Those CD34-positive cells harbored the t(15;17) translocation as identified by the fluorescence in situ hybridization (FISH) technique. Another study claimed that the presence of a heterogenous expression of CD13 and dual staining of CD34 and CD15 were highly characteristic of APL with a sensitivity of 100% and specificity of 99% for predicting PML/RARα gene rearrangement (20).


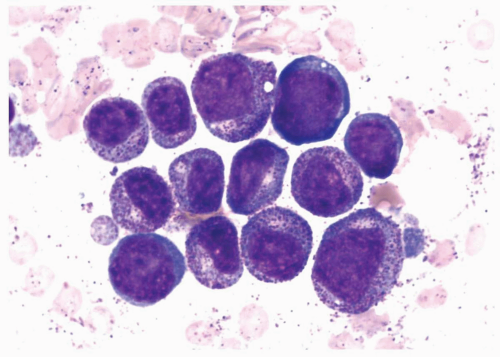
FIGURE 6.6.7 Bone marrow aspirate shows a cluster of hypergranular promyelocytes due to synchronous proliferation of promyelocytes after chemotherapy of M2 leukemia. Wright-Giemsa, 100x magnification.

The recent addition of CD117 (c-kit) to the immunophenotypic panel is very helpful in distinguishing APL from reactive promyelocytosis (21). CD11b will further separate these two entities (21). In a recent study, 77% of APL cases were CD117+ CD11b−, whereas all cases recovered from agranulocytosis were CD117− CD11b+ (21). A panel composed of leukocyte integrin-associated antibodies, including CD11a, CD11b, and CD18 is useful to distinguish between APL and other AML subtypes (22). PML-RARα-positive APL cells typically lack leukocyte integrins and show low percentages of the above markers.

Another useful marker is CD2 (a T-cell marker), which is frequently demonstrated in M3v but rarely in hypergranular M3 (12,13). A recent study showed that expression of CD2 in M3 correlates with the short type of PML-RARα transcript and with poor prognosis (23). CD7, another T-cell marker, may be demonstrated in other subtypes of AML, but is consistently absent in APL (24,25).

Antibodies to the PML gene product are now available for immunohistochemical and immunofluorescent stains (26, 27 and 28). PML protein is present in the nucleus of normal cells and is characterized by a speckled pattern, which is the presence of 5 to 20 nuclear particles (nuclear bodies) per nucleus. The APL cells, in contrast, show a microspeckled or microgranular pattern, which is composed of >50 granules. This phenomenon is the result of disruption of the nuclear bodies and redistribution of the protein in the APL cells. It is a reliable and simple technique and can be used for therapeutic monitoring. After treatment, the PML nuclear pattern may return to being speckled.


Comparison of Flow Cytometry and Immunohistochemistry

Flow cytometry can be used to make the initial diagnosis of APL and for therapeutic monitoring. CD2 may help to predict the prognosis. Immunohistochemical staining for PML protein is considered a reliable technique, but it is not yet commonly used in histology laboratories.


Molecular Genetics

Approximately 99% of APL cases including M3 and M3v show t(15;17)(q22;q21) translocation, which produces a PML RARα or, to a lesser extent, RARα/PML fusion transcript (3,18,29, 30 and 31). The remaining APL cases involve three partner genes translocating with RARα: promyelocytic leukemia zinc finger (PLZF) in t(11;17)(q23;q21), nucleophosmin (NPM) gene in t(5;17)(q23;q12), and nuclear matrix-associated gene (NuMA) in t(11;17)(q13;q21) (1,16,26,31). Leukemic cells with the PLZF/RARα fusion product are resistant to ATRA therapy. In addition, reverse transcriptase-polymerase chain reaction (RT-PCR) demonstrates three isoforms in PML/RARα transcripts: L (long) type, V (variable) type, and S (short) type containing bcr1, bcr-2, and bcr-3, respectively (26). The bcr-3 transcript is associated with higher white blood cell counts, M3v morphology, additional karyotypic abnormalities, and the expression of CD34 and CD2 (26). Interestingly, Latin American patients have a high frequency of bcr-1 subtype, which was also demonstrated in a small cohort of Chinese APL patients and in a Japanese group (32). It was proposed
that this phenomenon might be related to a non-European genetic factor.

RARα regulates transcription of ATRA target genes and recruits the nuclear corepressor (N-CoR)/histone-deacetylase (HD) complex, which lead to a repressive chromatin conformation (26). As a result there is a developmental arrest at the promyelocytic stage. High doses of ATRA release HD activity from PML-RARα but not from PLZF-RARα, because the latter contains a second N-Cor/HD binding site in the PLZF moiety (26). This explains why ATRA is not effective in treating cases with PLZF-RARα. The action of ATRA is to induce the leukemic promyelocyte to differentiate terminally. However, ATRA alone may not be sufficient; therefore, the current protocol is the combination of ATRA and anthracycline-containing chemotherapy (16,26). After treatment, the bone marrow is replenished with terminally differentiated granulocytes, in contrast to the hypocellular bone marrow seen in other leukemia immediately after chemotherapy (29).

Recently, ATO has been used to treat APL patients resistant to ATRA. ATO may be similar to ATRA in inducing APL cell differentiation through disruption of the PML-RARα function (33).

A study of gene expression profiling identified two major clusters in APL cases, corresponding to the two morphologic subtypes (7). The first cluster was represented by cases with M3v morphology, high leukocyte count, bcr3 PML-RARα isoform, and Flt3-ITDs (Fms-like tyrosine kinase 3-internal tandem duplications). The second cluster was composed of cases with typical M3 morphology, bcr1 PML-RARα isoform, leucopenia, and Flt3-WT (Flt3-wild-type).

As PML-RARα transgenic mice only develop a nonfatal myeloproliferative disorder, additional mutations are probably required to produce overt leukemia. A candidate gene to play such a role is Flt3 (7). For instance, Flt3-ITDs upregulate the hyperleukocytosis gene and blood coagulation gene clusters. It also down-regulates genes that encode for proteins present in granulocytic granules leading to the hypogranular variant form (7).

Whereas molecular genetic confirmation is mandatory in the diagnosis of APL, treatment should be started as soon as possible even before genetic evidence is available, because the patient may die in the early stage of the disease due to acute hemorrhage. Molecular genetic techniques are useful not only for the diagnosis but also for follow-up of the patients for minimal residual disease (MRD). However, molecular evaluation is reliable only at the end of consolidation and not immediately after induction therapy (28).

Conventional karyotyping may help to diagnose 80% to 90% of APL cases. Its major advantage is its capability to detect additional chromosomal abnormalities besides t(15;17) and to identify other APL variants (26). However, it is a time-consuming procedure, a good quality bone marrow metaphase is not always obtainable for karyotyping, and it is an insensitive technique for the detection of MRD (18,28).

FISH is a rapid and sensitive technique (26,28). It does not require dividing cells, so fresh specimens and culture technique are not needed. FISH is practically applicable to all kinds of specimens: Blood smears, bone marrow, fresh tissues, and paraffin sections (Fig. 6.6.8). However, it cannot detect additional cytogenetic aberrations besides the targeted abnormality [i.e., t(15;17)].


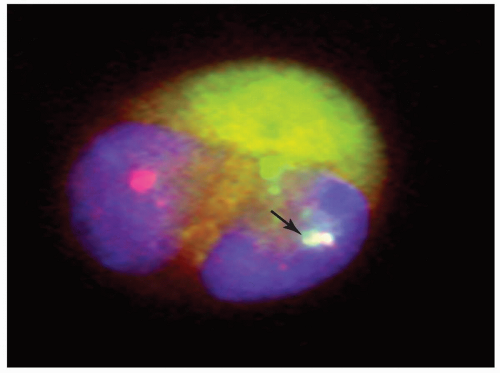
FIGURE 6.6.8 Fluorescence in situ hybridization of bone marrow aspirate with promyelocytic leukemia-retinoic acid receptor α (PML-RARα) probes demonstrated one orange signal, one green signal, and the PML-RARα fusion product (arrow) in a leukemic promyelocyte with a bilobed nucleus. 100x original magnification.

Southern blot is highly specific, but it is time-consuming and laborious (28,30). Additional probes are needed to detect different breakpoints or to rule out a variant translocation.

RT-PCR is the only technique that defines the PML breakpoint type and is suitable for monitoring MRD (16,26,28). After successful treatment, PML-RARα disappears from the leukocytes, and the reappearance of this fusion transcript predicts a relapse. This phenomenon is in marked contrast to t(9;22) in chronic myeloid leukemia and to t(8;21) in AML. In those cases, the transcript may persist for a long time and no relapse occurs (18). However, RT-PCR is prone to contamination and artifacts, and interlaboratory discordance has been reported (26,28). Therefore, real-time PCR is advocated to provide standardization (26).

In the current case, the diagnosis of APL is confirmed by karyotyping. Although the patient had symptoms of hemorrhages, his fibrinogen was normal and D-dimer was negative, so disseminated intravascular coagulation (DIC) was probably not present. The morphology of the leukemic cells is consistent with M3v. The cytochemical staining is most helpful in demonstrating the presence of multiple Auer rods, because treatment can be started with this finding and multiple Auer rods are not easily detected without special staining. The only atypical clinical feature in this case is leukopenia instead of leukocytosis that is commonly seen in M3v cases.

The salient features for laboratory diagnosis of APL are summarized in Table 6.6.1.


TABLE 6.6.1


Salient Features for Laboratory Diagnosis of AML-M4


1.


Presence of >20% hypergranular (or microgranular) promyelocytes in the bone marrow


2.


Presence of multiple Auer rods in the cytoplasm of leukemic cells


3.


Cytochemical staining: strongly positive for myeloperoxidase and chloroacetate esterase, but negative for α-naphthyl butyrate esterase


4.


General immunophenotype: positive for myelomonocytic antigens (CD13, CD15, CD33) but negative for monocytic antigens (CD14)


5.


Specific immunophenotype: low level or absence of HLA-DR, low level or absence of integrin-associated antibodies (CD11a/CD11b/CD11c/CD18), negative CD34 but positive CD117


6.


Abnormal karyotype: t(15;17) detected by cytogenetic technique [rarely t(5;17) or t(11;17)]


7.


Identification of PML-RARα by RT-PCR or FISH (rarely PLZF-RARα, NPM-RARa, or NuMA-RARα)


8.


PML antibody staining for abnormal PML protein pattern


AML, acute myeloid leukemia; CD, cluster of differentiation; HLA-DR, human leukocyte antigen-DR; FISH, fluorescence in situ hybridization; NuMA, nuclear matrix-associated gene; NPM, nucleophosmin; PLZF, promyelocytic leukemia zinc finger; PML, promyelocytic leukemia; RARα, retinoic acid receptor α; RT-PCR, reverse transcriptase-polymerase chain reaction.


Clinical Manifestations

The early clinical presentation is leukopenia in typical M3 but marked leukocytosis in M3v, which may reach 200,000/µL. The leukocyte count is an important predictor for the prognosis (7,34). In a study of 239 cases, patients with a leukocyte count <10,000/µL had a higher complete remission rate (85% vs. 62%), reduced relapse risk (13% vs. 35%), and superior survival (80% vs. 57%) than those with a leukocyte count >10,000/µL.

Morbidity and mortality are mainly related to coagulopathy. Many patients die of early fatal hemorrhage, especially intracranial or intrapulmonary hemorrhage. The incidence of early hemorrhage varies from 8% to 47% (29), and the mortality rate due to hemorrhages is still as high as 10% even in patients receiving modern treatment (26). Malignant promyelocytes release procoagulant substances that activate the coagulation cascade and generate thrombin, and deplete fibrinogen, clotting factors, and platelets, so that patients with APL may have DIC, fibrinolysis, and proteolysis (29,35). Clinically, the resolution of coagulopathy is the first sign of response to ATRA (29). Because M3v has higher leukocyte counts and more severe coagulopathy than the typical APL, its prognosis is generally worse than that of the latter (14).

After ATRA treatment, approximately 50% of patients may develop the retinoic acid syndrome, which includes fluid retention, hectic fever, pulmonary infiltrates, and pleural effusions (36). This potentially fatal syndrome should be promptly treated with high-dose corticosteroids. ATO can also induce the same syndrome in about one third of patients (36).


REFERENCES

1. Brunning RD, Matutes E, Flandrin G, et al. Acute myeloid leukaemia with recurrent genetic abnormalities. In: Jaffe ES, Harris NL, Stein H, Vardiman JW, eds. Tumour of Haematopoietic and Lymphoid Tissues. Lyon, France: IARC Press; 2001:81-87.

2. Innes DJ Jr, Hess CE, Bertholf MF, et al. Promyelocyte morphology differentiation of acute promyelocytic leukemia from benign myeloid proliferations. Am J Clin Pathol. 1987;88:725-729.

3. Stone RM, Mayer RJ. The unique aspects of acute promyelocytic leukemia. J Clin Oncol. 1990;8:1913-1921.

4. Litz CE, Brunning RD. Acute myeloid leukemias. In: Knowles DM, ed. Neoplastic Hematopathology. Baltimore: Williams & Wilkins; 1992:1315-1349.

5. Bennett JM, Catovsky D, Daniel MT, et al. A variant form of hypergranular promyelocytic leukemia (M3). Br J Haematol. 1980;44:169-170.

6. Golomb HM, Rowley JD, Vardiman JW, et al. “Microgranular” acute promyelocytic leukemia: a distinct clinical, ultrastructural and cytogenetic entity. Blood. 1980;55:253-259.

7. Marasca R, Maffei R, Zucchini P, et al. Gene expression profiling of acute promyelocytic leukaemia identifies two subtypes mainly associated with Flt3 mutational status. Leukemia. 2006;20:103-114.

8. McKenna RW, Parkin J, Bloomfield CD, et al. Acute promyelocytic leukemia. A study of 39 cases with identification of a hyperbasophilic microgranular variant. Br J Haematol. 1982;50:201-214.

9. Castoldi GL, Liso V, Specchia G, et al. Acute promyelocytic leukemia: morphological aspects. Leukemia. 1994;8: 1441-1446.

10. Sun T, Weiss R. Hand-mirror variant of microgranular acute promyelocytic leukemia. Leukemia. 1991;5:266-269.

11. Davey FR, Davis RB, McCallum JM, et al. Morphologic and cytochemical characteristics of acute promyelocytic leukemia. Am J Hematol. 1989;30:221-227.

12. Neame PB, Soamboonsrup P, Browman GP, et al. Classifying acute leukemia by immunophenotyping. A combined FAB-immunologic classification of AML. Blood. 1986;68:1355-1362.

13. Second MIC Cooperative Study Group. Morphologic, immunologic and cytologic (MIC) working classification of the acute myeloid leukemias. Br J Haematol. 1988;68: 487-494.

14. Rovelli A, Biondi A, Rajnodi AC, et al. Microgranular variant of acute promyelocytic leukemia in children. J Clin Oncol. 1992;10:1413-1418.

15. Traweek ST. Immunophenotypic analysis of acute leukemia. Am J Clin Pathol. 1993;99:504-512.

16. Fenauz P, Chomienne C, Degos L. Acute promyelocytic leukemia. Biology and treatment. Semin Oncol. 1997;124; 92-102.


17. Dunphy CH. Comprehensive review of adult acute myelogenous leukemia. Cytomorphological, enzyme cytochemical, flow cytometric, immunophenotypic, and cytogenetic findings. J Clin Lab Anal. 1999;13:19-26.

18. Grignani F, Fagioli M, Alcalay M, et al. Acute promyelocytic leukemia. From genetics to treatment. Blood. 1994;83:10-25.

19. Edwards RH, Wasik MA, Finan J, et al. Evidence for early hematopoietic progenitor cell involvement in acute promyelocytic leukemia. Am J Clin Pathol. 1999;112:819-827.

20. Orfao A, Chillon MC, Bortoluci AM, et al. The flow cytometric pattern of CD34, CD15, and CD13 expression in acute myeloblasts leukemia is highly characteristic of the presence of PML-RARalpha gene rearrangements. Haematologica. 1999; 84:405-412.

21. Rizzatti EG, Garcia AB, Pothan H, et al. Expression of CD117 and CD11b in bone marrow can differentiate acute promyelocytic leukemia from recovering myeloid proliferations. Am J Clin Pathol. 2002;118:31-37.

22. Paietta E, Goloubeva O, Neuberg D, et al. Eastern Cooperative Oncology Group. A surrogate marker profile for PML/RAR alpha expressing acute promyelocytic leukemia and the association of immunophenotypic markers with morphologic and molecular subtypes. Cytometry B Clin Cytom. 2004;59:1-9.

23. Lin P, Hao S, Medeiros LJ, et al. Expression of CD2 in acute promyelocytic leukemia correlates with short form of PMLRARα transcripts and poor prognosis. Am J Clin Pathol. 2004;121:402-407.

24. Kita K, Miwa H, Nakase K, et al. Clinical importance of CD7 expression in acute myelocytic leukemia. Blood. 1993;81: 2399-2405.

25. Del Poeta G, Stasi R, Venditti A, et al. CD7 expression in acute myeloid leukemia. Blood. 1993;82:2929-2930.

26. Lo Coco F, Diverio D, Falini B, et al. Genetic diagnosis and molecular monitoring in the management of acute promyelocytic leukemia. Blood. 1999;94:417-428.

27. Falini B, Flenghi L, Fagioli M, et al. Immunocytochemical diagnosis of acute promyelocytic leukemia (M3) with the monoclonal antibody PG-M3 (anti-PML). Blood. 1997;90: 4046-4053.

28. Sanz MA, Tallman MS, Lo Coco F. Tricks of the trade for the appropriate management of newly diagnosed acute promyelocytic leukemia. Blood. 2005;105:3019-3025.

29. Warrell RP Jr, de Thé H, Wang ZY, et al. Acute promyelocytic leukemia. N Engl J Med. 1993;329:177-189.

30. Brunning RD. Acute myeloid leukemia. In: Knowles DM, ed. Neoplastic Hematopathology. 2nd ed. Philadelphia: Lippincott Williams & Wilkins; 2001:1667-1715.

31. Powell BL. Acute progranulocytic leukemia. Curr Opin Oncol. 2001;13:8-13.

32. Douer D, Santillana S, Ramezani L, et al. Acute promyelocytic leukaemia in patients originating in Latin America is associated with an increased frequency of the bcr1 subtype of the PML/RARα fusion gene. Br J Haematol. 2003; 122:563-570.

33. Chou WC, Dang CV. Acute promyelocytic leukemia: recent advances in therapy and molecular basis of response to arsenic therapies. Curr Opin Hematol. 2005;12:1-6.

34. Burnett AK, Grimwade D, Solomon E, et al. Presenting white blood cell count and kinetics of molecular remission predict prognosis in acute promyelocytic leukemia treated with all-trans retinoic acid: result of the randomized MRC Trial. Blood. 1999;93:4131-4143.

35. Tallman MS. The thrombophilic state in acute promyelocytic leukemia. Semin Thromb Hemost. 1999;25:209-215.

36. Camacho LH, Soignet SL, Chanel S, et al. Leukocytosis and the retinoic acid syndrome in patients with acute promyelocytic leukemia treated with arsenic trioxide. J Clin Oncol. 2000;18:2620-2625.


CASE 7 Acute Myeloblastic Leukemia without Maturation (General Introduction of Acute Myeloid Leukemia)


CASE HISTORY

A 62-year-old man presented with symptoms of unstable angina. He was scheduled to have cardiac catheterization, but the procedure was postponed due to the development of fever of unknown origin for 2 weeks. The fever workup included blood cultures, urine cultures, and computed tomography (CT) scan of the chest and maxilla; all examinations were negative and failed to show any evidence of infection.

Physical examination revealed no hepatosplenomegaly and no lymphadenopathy. The initial peripheral blood examination demonstrated pancytopenia with blasts and several nucleated red blood cells. Further examination showed a total leukocyte count of 24,100/µL with 61% blasts, 11% neutrophils, 24% lymphocytes, and 1% monocytes. The hematocrit was 27.3%, hemoglobin 9.5 g/dL, and platelets 33,500/µL.

A bone marrow biopsy was performed. A 500-cell count showed 85% myeloblasts, 6.4% monoblasts, 1.2% promyelocytes, 0.4% myelocytes, 0.8% metamyelocytes, 1.2% bands, and 1.4% segmented neutrophils. Megakaryocytes were decreased. The core biopsy revealed 80% cellularity with the presence of large sheets of immature myeloid cells. However, small clusters of erythroid cells and mature granulocytes were still visible.

After admission, the patient continued to have cyclical fevers and was started with cefepime. The patient was
informed of the diagnosis of acute myeloid leukemia (AML), the prognosis, and treatment of the disease. He decided to forego chemotherapy and seek possible palliative care at home. The patient was discharged with the instruction to follow up by visiting hematology/oncology, and cardiology clinics.


FIGURE 6.7.1 Flow cytometric histograms of the bone marrow show dual CD13-CD33/CD7 staining, with positive HLA-DR, CD117, and CD34. ss, side scatter; PC5, phycoerythrin cyanin 5; FITC, fluorescein isothiocyanate; RD1, rhodamine; PE, phycoerythrin.


FLOW CYTOMETRY FINDINGS

Bone marrow: Myeloperoxidase (MPO) 4%, CD13-CD33 86%, CD13-CD33/CD7 60%, HLA-DR 86%, CD14 0%, CD34 91%, CD117 47% (Fig. 6.7.1).


CYTOCHEMICAL FINDINGS

MPO and chloroacetate esterase (CAE) stains were positive, whereas α-naphthyl butyrate esterase (NBE) was negative in the bone marrow specimen.


DISCUSSION

The first comprehensive classification scheme for AML was proposed by the French-American-British (FAB) group, which was based on the combination of morphology and cytochemistry (1,2). Subsequently, immunophenotypic and cytogenetic criteria were included for substantiation of the diagnosis (3).

The basic requirement for the diagnosis of AML in the FAB system is that >30% of all nucleated marrow cells are blasts and <50% are erythroid precursors, except for erythroleukemia (3). On rare occasions, bone marrow may show <30% blasts, but >30% blasts are present in the peripheral blood. This condition has been accepted as AML by a National Cancer Institute-sponsored workshop (4). The FAB classification includes several subtypes of AML: acute myeloblastic leukemia without maturation (M1), acute myeloblastic leukemia with maturation (M2), acute promyelocytic leukemia (M3), acute myelomonocytic leukemia (M4), acute monoblastic leukemia (M5a), acute monocytic leukemia (M5b), acute erythroleukemia (M6), and acute megakaryoblastic leukemia (M7).

The distinction between M1 and M2 is based on the percentage of blasts in the bone marrow. M1 is diagnosed when >90% of nonerythroid marrow cells are myeloblasts, whereas M2 shows <90% myeloblasts in the bone marrow. The diagnosis of AML was required to have >3% of blasts positive for MPO. However, in those MPO-negative (or <3%) myeloid leukemia cases, the myeloid lineage can be identified by immunophenotyping or electron microscopic detection of MPO. These cases are now called AML with minimal differentiation (M0) (5,6). The incidence of M0
varies from 2% to 22% in different series (5, 6, 7, 8 and 9). M0 is frequently associated with the presence of terminal deoxynucleotidyl transferase (TdT) (9).


TABLE 6.7.1


World Health Organization Classification of AML


AML with recurrent genetic abnormalities


AML with t(8:21)(q22;q22); (CBFa/ETO)


AML with abnormal bone marrow eosinophils inv(16)(p13q22) or t(16;16)(p12;q32); (CBFβ.MYH11)


Acute promyelocytic leukemia t(15;17)(q22;p22); (PML/RARa) and variants


AML with 11q23 (MLL) abnormalities


AML with multilineage dysplasia


AML and myelodysplastic syndromes, therapy related


AML not otherwise categorized


AML minimally differentiated


AML without maturation


AML with maturation


Acute myelomonocytic leukemia


Acute monoblastic and monocytic leukemia


Acute erythroid leukemias


Acute megakaryoblastic leukemia


Acute basophilic leukemia


Acute panmyelosis with myelofibrosis


Myeloid sarcoma


Acute leukemia of ambiguous lineage


Undifferentiated acute leukemia


Bilineal acute leukemia


Biphenotypic acute leukemia


AML, acute myeloid leukemia; CBF, core binding factor; ETO, eight-twenty-one; MYH, smooth muscle myosin heavy chain; PML, promyelocytic leukemia; RAR, retinoic acid receptor; MLL, mixed lineage leukemia.


The recently proposed World Health Organization (WHO) classification divides AML into four large categories: AML with recurrent cytogenetic translocations; AML with multilineage dysplasia; AML, therapy related; and AML, not otherwise categorized (Table 6.7.1) (10, 11 and 12). The FAB classification is now included in the category of AML, not otherwise categorized. One of the major basic changes in this classification is lowering the diagnostic threshold of blast count from 30% to 20%, because recent studies have indicated that patients with 20% to 30% blasts have a prognosis similar to that of patients with >30% blasts.

The new classification emphasizes the importance of clinical correlation of the AML entities, particularly the correlation of prognosis. Because cytogenetic abnormalities, multilineage dysplasia, and chemotherapy and/or radiation therapy have proved to be intimately related to prognosis in AML patients, they are established as the new categories in the WHO classification.


FIGURE 6.7.2 Myeloperoxidase stain of the bone marrow shows positive staining in several myeloblasts as well as maturing myeloid cells. 100x magnification.


Cytochemistry

Routine cytochemical stains for the study of AML cases include MPO (Fig. 6.7.2), specific esterase (e.g., CAE), and nonspecific esterase (e.g., NBE) (10,13,14). The two esterases can be stained simultaneously (combined esterase stain) (Fig. 6.7.3), so that two blood or bone marrow smears are usually sufficient for a routine cytochemical study.

MPO is usually strongly positive in M2, M3, M4, and M6; weakly positive in M1; and weakly positive or negative in M5, but negative in M7 (Table 6.7.2). The peroxidase in megakaryocytes can be demonstrated only by electron microscopy, and is called platelet peroxidase. The eosinophilic peroxidase is characterized by its resistance to cyanide. The basophils are negative for peroxidase.


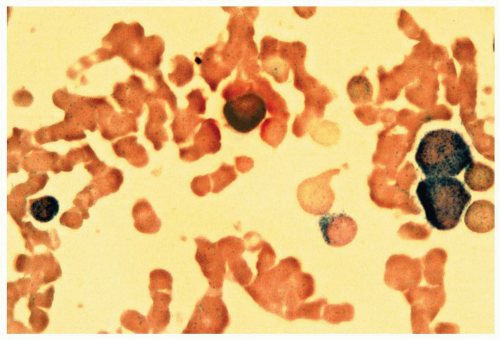
FIGURE 6.7.3 Combined esterase stain reveals chloroacetate esterase staining (blue) in two myeloblasts and one granulocyte, and α-naphthyl butyrate staining (brown) in a monocyte. 100x magnification.


TABLE 6.7.2


Cytochemical Reactions in FAB Subtypes of AML*


FAB Subtype


MPO


CAE


NBE


M0


M1


+ (>3%)


+


M2


+


+ (>80%)


+ (<20%)


M3


+


+


M4


+


+ (>20%)


+ (>20%)


M5


+/−


+ (>20%)


+ (>80%)


M6


+


+


M7


* Result is based on the reaction of myeloblasts and monoblasts except for M3, which is based on the reaction of promyelocytes. AML, acute myeloid leukemia; CAE, chloroacetate esterase; FAB, French-American-British; MPO, myeloperoxidase; NBE, α-naphthyl butyrate esterase.


MPO-deficient neutrophils are found in about 40% of AML cases. These MPO-deficient neutrophils frequently disappear during complete remission and reappear during relapse (15). MPO deficiency and a low level of MPO activity in AML usually mean a poor prognosis (16).

Sudan black B stain has the same reaction as MPO to various leukocytes. In a study of 1,386 cases of AML, the Medical Research Council of England found that increased Sudan black B positivity predicted a high remission rate and long survival and suggested that >50% of blast with Sudan black B positivity should be used to distinguish M2 from M1 (17).

NBE or other nonspecific esterase (e.g., α-naphthyl acetate esterase) is positive for the monocytic series, and CAE or other specific esterase is positive for the myelocytic series (13). However, about 13% to 37% of promyelocytic leukemia cases may show strongly positive nonspecific esterase (18). A subset of myelomonocytic leukemia displays double staining of specific and nonspecific esterases in all blasts. Another study shows that all types of AML may show double staining in some cases (19).

The periodic acid-Schiff (PAS) stain showing a block pattern is seen in most cases of acute lymphoblastic leukemia (ALL). However, negative PAS staining does not rule out ALL, and positive PAS staining can be seen in occasional cases of AML (13). PAS is probably more useful in distinguishing normal erythroblasts from leukemic erythroblasts. In erythroleukemia, the pronormoblasts and other stages of normoblasts can be positive, but normal nucleated erythrocytes are PAS negative. It should be cautioned, however, that nucleated erythrocytes can be PAS positive in myelodysplastic syndrome (MDS). In megakaryoblastic leukemia, a peripheral PAS staining pattern of megakaryoblasts is characteristic.

Acid phosphatase (AP) staining can be seen in all leukocytes, but tartrate-resistant AP positivity is relatively specific for hairy cell leukemia (13). A focal paranuclear AP stain is characteristic of T lymphocytes and T lymphoblasts. However, in myeloid series, the AP staining is stronger and diffuse. Therefore, AP can be used, but is not particularly helpful in differential diagnosis between AML and ALL.


FIGURE 6.7.4 Bone marrow aspirate reveals almost exclusively blasts in the marrow with a high nuclear/cytoplasmic ratio, immature chromatin pattern, and nucleoli. 60x magnification.

With the development of flow cytometry and immunohistochemistry, cytochemical staining is no longer essential in the diagnosis of AML. However, in difficult cases of AML-M4 and AML-M5, the esterase stains are still superior to other techniques in defining the cell lineage with direct morphologic correlation. Unfortunately, cytochemical staining is technically difficult and cannot be done with automated instruments. Furthermore, because of the lack of demand, most commercial or reference laboratories do not offer cytochemical services.


Morphology

In the current case, the bone marrow aspirate showed that >90% of nonerythroid cells were blasts with scanty cytoplasm, immature chromatin pattern, and prominent nucleoli (Fig. 6.7.4). A few of them contained Auer rods in the cytoplasm, and a few cytoplasmic granules were occasionally seen. These features are consistent with myeloblasts. The core biopsy revealed diffuse infiltration of immature myeloid cells replacing the normal hematopoietic cells (Fig. 6.7.5). The same blasts were also found in the peripheral blood smears (Fig. 6.7.6).

The leukemic nature in this case is determined on the basis of extensive infiltration of the bone marrow in the core biopsy and the presence of >20% blasts and <10% nonblastic myeloid cells in the marrow aspirate. Cytochemistry demonstrated positive staining for MPO in about 3% of myeloblasts and CAE in 30% of blasts. The NBE stain was negative for the immature cells. These results confirmed the morphologic impression of myeloblastic leukemia. The flow cytometric result also confirmed the myelocytic lineage by the demonstration of 86% CD13-CD33-positive cells. The percentage of MPO was low and can be considered partial deficiency. In some myeloid leukemia cases, the percentage
of CD13-CD33 is low but that of MPO is high. That is why both of these myeloid markers should be included in flow cytometric studies of AML. The presence of high percentages of CD34- and CD117-positive cells and the dual CD13-CD33/CD7 staining are supportive of a malignant cell population, which will be discussed in the immunophenotype section. With all this information, a diagnosis of AML without maturation (M1) was established.


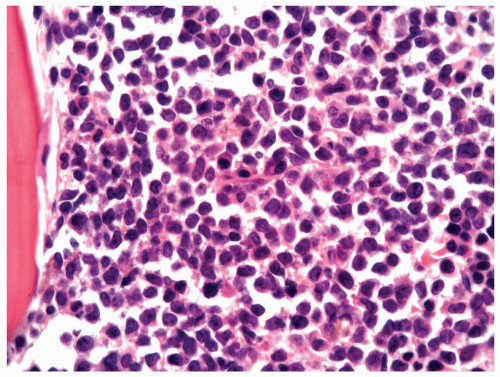
FIGURE 6.7.5 Bone marrow aspirate shows 100% cellularity, and normal hematopoietic cells are almost totally replaced by blastic cells. 60x magnification.

The major differential diagnosis for AML is ALL. Myeloblasts and lymphoblasts can be distinguished by their chromatin pattern, number and prominence of the nucleoli, amount of cytoplasm, and presence or absence of cytoplasmic granules (see Table 6.14.2). Nevertheless, all these morphologic criteria are not absolute: The only reliable morphologic marker is the Auer rod, which, however, is present in the myeloblasts in only 21% of AML cases (20). Therefore, flow cytometry and cytochemistry are needed to help with the diagnosis.


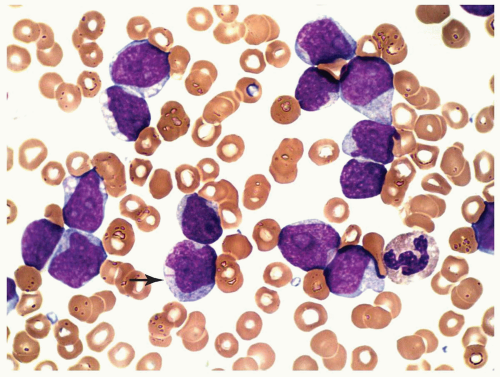
FIGURE 6.7.6 Peripheral blood smear shows multiple myeloblasts with similar features as those seen in the bone marrow. One Auer rod in the cytoplasm of a blast is indicated (arrow). 100x magnification.


Immunophenotype

As mentioned before, cytochemical staining can be totally negative in AML, and sometimes the staining is difficult to interpret or inconclusive. Therefore, immunophenotyping is most useful in substantiating the diagnosis (10,14,21,22). There is also evidence that immunophenotypes are frequently reliable predictors for prognosis and sensitive markers for detecting minimal residual disease (23). In addition, immunophenotyping may identify mixed lineage phenotypes, but the clinical significance of these phenotypes is controversial.

Terstappen et al. (24) found that AML cells may differ from normal cells in several aspects: expression of nonmyeloid antigens (e.g., CD2, CD5, and CD7), asynchronous expression of myeloid-associated antigens (e.g., coexpression of CD34 and CD15), overexpression of myeloid-associated antigens (e.g., CD14 and CD34), and absence of expression of myeloid-associated antigens (e.g., CD33, CD11b, CD15). Because selective loss of certain myeloid antigens is helpful in distinguishing leukemia from benign myelocytosis, the use of mixed antibodies (e.g., CD13-CD33) for screening purposes may mask this phenomenon.

Neame et al. (7) recommended the use of seven monoclonal antibodies (CD33, CD13, CD14, CD15, HLA-DR, AML2.23, and polymorphonuclear neutrophil [PMN]6/29) for immunophenotyping, which can help to distinguish the first five types of AML. In our experience, the first five antibodies should be sufficient for differential diagnosis (Table 6.7.3). Essentially, M1 and M5 are all positive for CD33 and CD13, whereas M4 and M5 are also positive for CD14 (Mo2 or My4), a monocyte marker. While the CD14-positive population is >55% in M5, it is <45% in M4. M3 is characterized by the low percentage or complete absence of HLA-DR, which is positive for the blasts but negative for the promyelocytes. The distinction between M1 and M2 is the fact that there is a negative reaction to CD15 in M1, but a positive reaction to CD15 in M2 through M5. The above-mentioned are typical immunophenotypes present in most cases, but exceptions are seen from time to time. For instance, CD14 can be negative for M4 or M5. In that case, CD64, CD11b and CD11c should be used to supplement the phenotyping panel. CD15 can also be positive in M1 and is now seldom used for differential diagnosis.

Immunophenotyping of M6 depends on a positive reaction to glycophorin A or hemoglobin A. The latter can be demonstrated by immunohistochemistry only. M7 can be identified by positive reactions to CD41 and CD61 but negative reactions to CD42 (see Case 12). The reaction in M6 and M7 cases to other myelomonocytic markers is variable and is not dependable for their identification.

The Morphologic, Immunologic and Cytogenetic (MIC) Cooperative Study Group includes CD34 and CD11 in the phenotyping panel to distinguish M1 from other subtypes of AML (3). As mentioned before, CD11b and CD11c are helpful in identifying monocytes. CD34 is now used as an integral component of the AML panel.

Normally, CD34 is present only on stem and/or progenitor cells, but it is expressed in 40% of AML cases (25). Therefore, CD34 helps to distinguish AML from benign myeloproliferative
disorders. Although CD34 may also be detected in cases of MDS, its percentage is usually lower than that in AML cases. When a high percentage is present in a case of MDS, it predicts leukemic transformation (26). CD34 is found more frequently in M0, M1, and M5a (27,28) but is often absent in M3 (29). It is associated with either good or poor prognosis, depending on the cytogenetic alteration in a particular case and the cell lineage (25). Generally, it predicts poor prognosis in AML but good prognosis in ALL (28). When CD34 is related to poor prognosis, it is usually due to the correlation between CD34 and the multiple drug resistance (MDR) protein (25). CD34 may appear at relapse of CD34-negative AML, supporting its being an unfavorable marker (28).


TABLE 6.7.3


Correlation of Immunophenotyping and FAB Classification


Antigen


M1


M2


M3


M4


M5


M6


M7


CD33


+


+


+


+


+


+/−


+


CD13


+


+


+


+


+


CD14


<45%


>55%


CD15


+


+


+


+


+/−


HLA-DR


+


+


+


+


+/−


+/−


CD41/CD61


+


Glycophorin


+


FAB, French-American-British; CD, cluster of differentiation; HLA-DR, human leukocyte antigen-DR.


A relatively new marker for myeloid lineage is CD117 (c-kit or stem cell factor receptor) (30, 31 and 32). This antigen also marks the immature cells so that it can help to distinguish benign myeloid proliferation and myeloid leukemia. CD117 is better than CD34 as an immature cell marker in two aspects. First, CD117 is highly lineage specific; it has been found in lymphoid leukemia or lymphoma only in occasional cases (30, 31 and 32). Second, it can be demonstrated in M3 cases, which usually show negative CD34. CD117-positive AML cases generally carry a favorable prognosis (14).

Lymphoid markers are not infrequently identified in AML cases. As will be mentioned later, its presence may denote specific subtypes of AML. The important lymphoid marker for AML is CD7, which is included in our routine AML panel. CD7 is not present on normal myelomonocytic cells, but is detected on leukemic cells in 9.4% to 37.5% of 5 AML subtypes (M0, M1, M2, M4, and M5) (33,34). Therefore, the demonstration of dual CD7 and CD13-CD33 staining is consistent with AML. CD7-positive AML cases more frequently express the myeloid progenitor-associated antigens, such as CD34, HLA-DR, and TdT than do CD7-negative AML cases (33). This finding may suggest phenotypic immaturity of CD7+ AML and probably explains why none of the promyelocytic leukemia (M3) cases studied showed positive CD7 (28,33,34). A few studies of CD7+ AML showed that patients with this phenotype were younger, predominantly male, had more frequent involvement with the liver and central nervous system, and responded poorly to standard chemotherapy (33).

Two other special lymphoid markers that are present in AML cases are CD2 and CD19. CD2 is frequently associated with M3, and CD19 with M2 subtype (28). In one study of 170 cases of AML, CD2 and/or CD19 were detected in 33% of cases and were associated with good prognosis (35). In another study, CD19 expression was associated with poor prognosis (36). In a third study, CD20 was found to be the most commonly found lymphoid marker in AML cases, but it often was expressed in only a subpopulation of leukemic cells (37).

Previously, the presence of a lymphoid marker on AML cells was considered biphenotypic or mixed lineage leukemia. However, because lymphoid markers are so frequently encountered on AML cells, the presence of a single lymphoid marker no longer constitutes a diagnosis of mixed lineage or biphenotypic leukemia. There is still not a universal criterion to denote a biphenotypic or bilineage leukemia. Some authors consider two or more markers of another lineage as the criterion (38); others use a scoring system based on different combinations of B lineage, T lineage, and myeloid antigens (39). Antigens can also be generated after in vitro culture, leading to a bilineage phenotype (38). Therefore, the significance of identifying a biphenotypic population is still not conclusive. Some studies suggested, however, that the AML with lymphoid markers responded well to ALL therapy and thus convey a better prognosis (35). In addition, when lymphoid markers are present, immunoglobulin genes or T-cell receptor genes may be rearranged (35,40,41).

TdT is demonstrated in about 18% of AML cases (children 19%, adults 21%) (42,43). The percentage of positive cells is usually lower in AML than in ALL. TdT positivity is more common in the immature subtypes of AML (M0 and M1) and is frequently associated with CD34, another immature marker. Although some early reports considered a direct correlation between TdT positivity and immunoglobulin or T-cell receptor gene rearrangement, this finding is not supported by subsequent studies. Therefore, TdT should be viewed as an immature cell marker, but it is not lineage specific. The prognostic significance of the presence of TdT marker is controversial.

CD45, a panleukocyte antigen, is present in normal and leukemic myeloid cells. However, its low molecular isoform, CD45RO, is expressed in normal cells, whereas its high molecular isoform, CD45RA, is expressed almost exclusively in AML cases with or without coexpression of CD45RO (44).


TABLE 6.7.4


Correlation of Cytogenetic and Molecular Abnormalitites with FAB Classification


Cytogenetic Abnormalities


Genes Involved


FAB Type


Gene activation


inv(3)(q21q26)


Ribophorin 1/EVI1


M0, M1, M2, M4, M5, M6, M7


t(3;3)(q21;q26)


Ronphorin 1/EVI1


M1, M2, M4, M6


Gene fusion


t(1;22)(p13;q13)


N-RAS/C-SIS


M7 (infantile)


t(6;9)(p23;q13)


DEK/CAN


M1, M2, M4


t(7;11)(p15;p15)


HOXA9/NUP98


M2, M4


t(8;16)(p11;q13)


MOZ/CBP


M5b/M4


t(8;21)(q22;q22)


ETO/AML1


M2


t(9;11)(p22;q23)


AF9/MLL


M4, M5


t(10;11)(p12;q23)


AF10/MLL


M4, M5


+11


ALL1/MLL


M1, M2


t(11;17)(q23;q21)


MLL1/AF17


M5


t(11;19)(q23;p13.1)


MLL1/ELL


M4, M5


t(11;19)(q23;p13.3)


MLL1/ENL


M4, M5


t(15;17)(q22;q11-12)


PML/RARα


M3


inv(16)(p13q22)


MYH11/CBFβ


M4Eo


t(16;16)(p13;q22)


MYH11/CBFβ


M4Eo


t(16;21)(p11;q22)


FUS/ERG


M1, M2, M4, M5


FAB, French-American-British; EVI 1, ecotropic viral integration site 1; N-RAS, an oncogene derived from rat sarcoma virus; C-SIS, simian sarcoma oncogene; HOXA, hemeobox A; MOZ, monocytic leukemia zinc finger; CBP, CREB-binding protein; ETO, eight-twenty-one; AML, acute myeloid leukemia; MLL, mixed lineage leukemia; ALL, acute lymphoblastic leukemia; PML, promyelocytic leukemia; RAR, retinoic acid receptor; MYH, smooth muscle myosin heavy chain; CBF, core binding factor.


CD56, a natural killer cell marker, is present in various subtypes of AML. In a study of 80 bone marrow specimens, CD56 was found in 15% M0, 22% M2, 17% M3, 67% M4, and 100% M5 cases (29). There is a unique subtype of CD56+ AML with a phenotype of CD56+, CD33+, CD13+/−, CD34−, HLA-DR−, CD16−. This subtype is characterized by a high white blood cell count and marked nuclear folding with variable cytoplasmic granularity resembling microgranular M3 (M3v) (45). The authors designated these cases as myeloid/natural killer cell acute leukemia.


Comparison of Flow Cytometry and Immunohistochemistry

In general, flow cytometry is preferred to immunohistochemistry mainly because more monoclonal antibodies are available for the former technique. It is difficult to subclassify AML, particularly for M4 and M5, with the latter technique (46). In addition, the sensitivity of detecting CD34 in leukemic cells in AML cases is lower by immunohistochemistry than by flow cytometry, so that it is hard to distinguish leukemic cells from normal hematopoietic cells in tissue sections (46). CD117 can be detected by both techniques, but flow cytometry is quantitative and is more useful in patient following-up.


Molecular Genetics

In recent years, most progress in AML has been made on the molecular genetic front. With the improvement of cytogenetic techniques, clonal chromosome abnormalities can be detected in 55% to 78% of cases of adult AML and in 79% to 85% of childhood AML (47). In these cases, >30 different structural abnormalities, including translocations, deletions, and inversions, have been repeatedly implicated as primary nonrandom chromosome rearrangements (Table 6.7.4) (47, 48 and 49). In contrast to lymphomas, which frequently show complex karyotypes with multiple aberrations, AML often reveals only one chromosome abnormality. Most of these aberrations are leukemia specific because they are not found in nonhematologic neoplasms. Therefore, these abnormalities are considered to represent primary chromosome changes. Additional cytogenetic abnormalities may appear during the clinical course, frequently at the time of relapse. These additional aberrations are called secondary chromosome abnormalities, which are believed
to contribute to disease progression. Primary aberrations often involve structural changes (e.g., reciprocal translocations and inversions), whereas the secondary aberrations usually involve genomic imbalances (trisomies, monosomies, deletions, and unbalanced translocations).

Some of these cytogenetic abnormalities are so specific that they define distinct subtypes of AML, regardless of the blast count (10). These abnormal karyotypes correlate well with the FAB classification. The most striking examples are the association of t(15;17) with M3, inv(16) or t(16;16) with M4Eo, t(8;21) with M2, t(1;22) with infantile M7, and t(8;16) with M4 or M5b with erythrophagocytosis by leukemic cells.

Cytogenetic abnormalities also are accurate predictors for prognosis in AML. For instance, t(15;17), t(8;21), and inv(16) are associated with favorable prognosis. In contrast, t(6:9), 5q-, and 7q- predict poor prognosis (50).

Some karyotypes are associated with certain lymphoid or other surface markers (27,29). The expression of CD2 is associated with M4Eo/inv(16), CD19 is associated with M2/t(8;21), and absence of CD34 and HLA-DR is associated with M3/t(15;17).

Many genes are now known to be converted into leukemia genes by the mechanism of either gene activation or gene fusion (48). Gene activation occurs when a translocated gene is under the control of a new promoter and/or enhancer. This activated or deregulated gene then becomes an oncogene, leading to leukemogenesis. Gene fusion occurs when segments from two different genes are fused together to give rise to a chimeric transcript. The transcript is then translated into chimeric proteins that lead to leukemogenesis through the transduction system. In AML, most karyotypic changes result in gene fusion with only a few abnormalities resulting in gene activation.

Despite the advances in cytogenetic techniques, a proportion of submicroscopic alterations of genetic material can only be detected by molecular techniques. These conditions are called cryptic abnormalities (51). The major examples are fms-like tyrosine kinase 3 (FLT3) mutations, mixed lineage leukemia (MLL) partial tandem duplications, and (WT1) overexpression. The FLT3 mutation is the most commonly mutated gene in AML, accounting for 30% of AML patients (52).

There are also conditions that the cytogenetic results are false-negative due to technical problems. In two large study series, reverse transcription-polymerase chain reaction (RT-PCR) detected chimeric CBFα2/ETO (core-binding factor/eight twenty one) and CBFβ/MYH11 (core-binding factor/smooth muscle myosin heavy chain) transcripts in one third of patients with no detectable cytogenetic abnormalities (53,54). Even in acute promyelocytic leukemia, 15% of cases were found to be cytogenetically negative and molecularly positive in one study (55).

In about 40% of AML cases, no cytogenetic or molecular abnormalities are detected (50). However, the newly used gene expressing profiling (GEP) technique may gradually fill this gap. GEP may help distinguish AML from ALL (56,57). It may also demonstrate specific profiles in various cytogenetic subtypes of AML, such as t(8;21), inv(16), t(15;17), and MLL chimeric fusion genes (58, 59 and 60). In limited studies, GEP has been shown to be able to stratify AML cases with or without cytogenetic abnormalities and to predict the prognosis in these subsets; these are examples of some very attractive applications of this new technology (50).


TABLE 6.7.5


Salient Features for Laboratory Diagnosis of AML-M1


1.


>90% myeloblasts in the bone marrow or peripheral blood


2.


>3% MPO-positive blasts in the bone marrow


3.


Blasts positive for CAE but negative for NBE


4.


Blasts positive for CD33/CD13, HLA-DR


5.


Blasts in most cases positive for CD117 or CD34


6.


Blasts negative for CD14, CD15, CD41/CD61, glycophorin A


7.


Immunoglobulin or TCR gene rearrangement in mixed lineage leukemia


Possible cytogenetic aberrations: inv(3)(q21q26), t(3;3)(q21;q26), t(6;9)(p23;q34), +11, t(16;21)(p11;q22)


AML, acute myeloid leukemia; CAE, chloroacetate esterase; MPO, myeloperoxidase; NBE, α-naphthyl butyrate esterase; TCR, T-cell receptor; CD, cluster of differentiation; HLA-DR, human leukocyte antigen-DR.


The salient features for laboratory diagnosis of AML-M1 are summarized in Table 6.7.5.


Clinical Manifestations

Clinical symptoms are mainly due to the failure of the leukemic cells to mature and to the inhibition of normal hematopoiesis. Most patients may have anemia and/or thrombocytopenia. As a result, these patients have symptoms of fatigue, malaise, weakness, or hemorrhages. When the mature granulocytes are markedly decreased, superimposed infections are a common phenomenon. A fungal infection can be fatal to the patient.

AML has a bimodal age distribution. The first group, de novo AML, is usually seen in children and young adults with chromosomal abnormalities (mostly translocation) (49). The second group (secondary AML) is seen in elderly persons, associated with MDS, alkylating agent chemotherapy, or Fanconi anemia. It can also be seen in a subset of young patients.

The true de novo AML is characterized by a younger age group, absence of multistep progression, similar cytogenetic abnormalities, and, frequently, good response to chemotherapy. The second group, also called MDS-related AML, is characterized by resistant leukemia, poor marrow reserve with prolonged cytopenia after chemotherapy, early relapse, common cytogenetic abnormalities shared with MDS, and frequent multilineage dysplastic morphology in residual hematopoietic cells. Therefore, these two groups are different not only in age, but also in cytogenetic make-up, therapeutic response, and prognosis.

Adverse prognostic factors in patients with AML include unfavorable karyotype, age >60 years, secondary AML, poor performance score, features of multidrug resistance, leukocyte count >20,000/µL, unfavorable immunophenotype,
CD34 positivity, and elevated lactate dehydrogenase levels (3,61). The identification of FLT3 mutations and overexpression of ecotropic viral integration site 1 (EVI 1) have been included recently as independent indicators for an unfavorable prognosis (14). In general, AML carries a worse prognosis than ALL. In adult AML cases, the cure rates are approximately 40% to 50%, as compared to the 75% to 80% cure rates in pediatric ALL cases (62).


REFERENCES

1. Bennett JM, Catovsky D, Daniel MT, et al. Proposals for the classification of the acute leukemias. Br J Haematol. 1976;33:451-458.

2. Bennett JM, Catovsky D, Daniel MT, et al. Proposed revised criteria for the classification of acute myeloid leukemia: a report of the French-American-British Cooperative Group. Ann Intern Med. 1985;103:620-629.

3. Second MIC Cooperative Study Group. Morphologic, immunologic and cytogenetic (MIC) working classification of the acute myeloid leukemias. Br J Haematol. 1988;68: 487-494.

4. Cheson BD, Cassileth PA, Head DR, et al. Report of the National Cancer Institute sponsored workshop on definitions of diagnosis and response in acute myeloid leukemia. J Clin Oncol. 1990;8:813-819.

5. Goasguen JE, Bennett JM. Classification of acute myeloid leukemia. Clin Lab Med. 1990;10:661-681.

6. Bennett JM, Catovsky D, Daniel MT. Proposal for the recognition of minimally differentiated acute myeloid leukemia (AML-M0). Br J Haematol. 1991;78:325-329.

7. Neame PH, Soamboonsrup P, Browman GP, et al. Classifying acute leukemia by immunophenotyping. A combined FAB-immunologic classification of AML. Blood. 1986;68:1355-1362.

8. Lee EJ, Pollack A, Leavitt RD, et al. Minimally differentiated acute nonlymphocytic leukemia. A distinct entity. Blood. 1987;70:1400-1406.

9. Parreita A, Pombo de Oliverira MS, Matutes E, et al. Terminal deoxynucleotidyl transferase positive acute myeloid leukemia. An association with immature myeloblastic leukemia. Br J Haematol. 1988;69:219-224.

10. Brunning RD, Matutes E, Harris NL, et al. Acute myeloid leukaemia. In: Jaffe ES, Harris NL, Stein H, Vardiman JW, eds. Pathology and Genetics of Tumours of Haematopoietic and Lymphoid Tissues. Lyon, France: IARC Press; 2001: 75-107.

11. Vardiman JW, Harris NL, Brunning RD. The World Health Organization (WHO) classification of the myeloid neoplasms. Blood. 2002;100:2292-2302.

12. Brunning RD. Acute myeloid leukemia. In: Knowles DM, ed. Neoplastic Hematopathology. 2nd ed. Philadelphia: Lippincott Williams & Wilkins; 2001:1667-1715.

13. Li CY, Yam LT, Sun T. Modern Modalities for the Diagnosis of Hematologic Neoplasms. New York: Igaku-Shoin; 1996: 7-19.

14. Smith M, Barnett M, Bassan R, et al. Adult acute myeloid leukaemia. Crit Rev Oncol Hematol. 2004;50:197-222.

15. Bendex-Hansen K, Nielsen HK. Myeloperoxidase-deficient polymorphonuclear leukocytes. 2. Longitudinal study in acute myeloid leukemia, untreated, in remission and in relapse. Scand J Haematol. 1983;31:5-8.

16. Bennett JM, Begg CB. ECOG study of cytochemistry of acute myeloid leukemia by correlation of subtypes with response and survival. Cancer Res. 1981;41:4833-4837.

17. Hoyle CF, Gray RG, Wheatley K, et al. Prognostic importance of Sudan black positivity. A study of bone marrow slides from 1386 patients with de novo acute myeloid leukemia. Br J Haematol. 1991;70:398-407.

18. Gupta AM, Sapre RS, Shah AS, et al. Cytochemical and immunophenotypic heterogeneity in acute promyelocytic leukemia. Acta Haematol. 1989;81:5-8.

19. Scott CS, Cahill A, Morgan M, et al. Double esterase positive cells. Br J Haematol. 1984;58:762-794.

20. Jain NC, Cox C, Bennett JM. Auer rods in the acute myeloid leukemias. Frequency and methods of demonstration. Hematol Oncol. 1987;5:197-202.

21. Sun T. Comparison of immunohistochemistry and flow cytometry in immunophenotyping of hematologic neoplasms. J Histotechnol. 2004;27:101-109.

22. Sun T. Immunophenotyping of hematologic neoplasms by combined flow cytometry and immunohistochemistry. J Clin Ligand Assay. 2004;27:180-189.

23. Campana D. Determination of minimal residual disease in leukaemia patients. Br J Haematol. 2003;121:823-838.

24. Terstappen LWMM, Safford M, Konemann S, et al. Flow cytometric characterization of acute myeloid leukemia. 2. Phenotypic heterogeneity at diagnosis. Leukemia. 1992;6:70-80.

25. Krause DS, Fackler MJ, Civin CI, et al. CD34: structure, biology, and clinical utility. Blood. 1996;87:1-3.

26. Sawada K, Sato N, Notoya A, et al. Proliferation and differentiation of myelodysplastic CD34+ cells. Phenotypic subpopulations of marrow CD34+ cells. Blood. 1995;85:194-202.

27. Robertson MJ, Ritz J. Prognostic significance of the surface antigens expressed by leukemic cells. Leuk Lymphoma. 1994;13:15-22.

28. Traweek ST. Immunophenotypic analysis of acute leukemia. Am J Clin Pathol. 1993;99:504-512.

29. Dunphy CH. Comprehensive review of adult acute myelogenous leukemia. Cytomorphological, enzyme cytochemical, flow cytometric immunophenotypic, and cytogenetic findings. J Clin Lab Anal. 1999;13:19-26.

30. Hans CP, Finn WG, Singleton TP, et al. Usefulness of anti-CD117 in the flow cytometric analysis of acute leukemia. Am J Clin Pathol. 2002;117:301-305.

31. Rizzatti EG, Garcia AB, Portieres FL, et al. Expression of CD117 and CD11b in bone marrow can differentiate acute promyelocytic leukemia from recovering myeloid proliferations. Am J Clin Pathol. 2002;118:31-37.

32. Zimpfer A, Went P, Tzankov A, et al. Rare expression of KIT (CD117) in lymphomas: a tissue microarray study of 1166 cases. Histopathology. 2004;45:398-404.

33. Kita K, Miwa H, Nakase K, et al. Clinical importance of CD7 expression in acute myelocytic leukemia. Blood. 1993;81: 2399-2405.

34. Del Poeta G, Stasi R, Venditti A, et al. Clinical importance of CD7 expression in acute myeloid leukemia. Blood. 1993;82: 2929-2930.

35. Ball ED, Davis RB, Greffin JD, et al. Prognostic value of lymphocyte surface markers in acute myeloid leukemia. Blood. 1991;77:2242-2250.

36. Solary E, Casasnovas RO, Campos L, et al. Surface markers in adult acute myeloblastic leukemia. Correlation of CD19+, CD34+, and CD14+/DR− phenotypes with shorter survival. Leukemia. 1992;6:393-399.

37. Khalidi HS, Medeiro J, Chang KL, et al. The immunophenotype of adult acute myeloid leukemia. High frequency of lymphoid antigen expression and comparison of immunophenotype, French-American-British classification, and karyotypic abnormalities. Am J Clin Pathol. 1998;109:211-220.

38. Pui CH, Campana D, Crist WM. Toward a clinically useful classification of the acute leukemias. Leukemia. 1995;9: 2154-2157.


39. Bene MC, Castoldi G, Knapp W, et al. Proposals for the immunological classification of acute leukemias. Leukemia. 1995;9:1783-1786.

40. Mirror J, Zipf TFD, Pui CH, et al. Acute mixed lineage leukemia. Clinicopathologic correlations and prognostic significance. Blood. 1985;66:1115-1123.

41. Cross AH, Goorha RM, Nuss R, et al. Acute myeloid leukemia with T-lymphoid features: a distinct biologic and clinical entity. Blood. 1988;72:579-587.

42. Drexler HG, Sperling C, Ludwig WD. Terminal deoxynucleotidyl transferase (TdT) expression in acute myeloid leukemia. Leukemia. 1993;7:1142-1150.

43. Lee EJ, Yang J, Leavitt RD, et al. The significance of CD34 and TdT determinations in patients with untreated de novo acute myeloid leukemia. Leukemia. 1992;6:1203-1209.

44. Calwell CW, Patterson WP, Toalson BD, et al. Surface and cytoplasmic expression of CD45 antigen isoforms in normal and malignant myeloid cell differentiation. Am J Clin Pathol. 1991;95:180-187.

45. Scott AA, Head DR, Kopecky KU, et al. HLA-DR−, CD33+, CD56+, CD16− myeloid/natural killer cell acute leukemia. A previously unrecognized form of acute leukemia potentially misdiagnosed as French-American-British acute myeloid leukemia-M3. Blood. 1994;84:244-255.

46. Arber DA, Jenkins KA. Paraffin section immunophenotyping of acute leukemias in bone marrow specimens. Am J Clin Pathol. 1996;106:462-468.

47. Mrozek K, Heinonen K, de la Chapelle A, et al. Clinical significance of cytogenetics in acute myeloid leukemia. Semin Oncol. 1997;24:17-31.

48. Caligiuri MA, Strout MP, Gilliland DG. Molecular biology of acute myeloid leukemia. Semin Oncol. 1997;24:32-44.

49. Head DR. Revised classification of acute myeloid leukemia. Leukemia. 1996;10:1826-1831.

50. Valk PJ, Delwel R, Löwenberg B. Gene expression profiling in acute myeloid leukemia. Curr Opin Hematol. 2005;12:76-81.

51. Bagg A. Clinical applications of molecular genetic testing in hematologic malignancies: advantages and limitations. Hum Pathol. 2003;34:352-358.

52. Gilliland DG, Griffin JD. The role of FLT3 in hematopoiesis and leukemia. Blood. 2002;100:1532-1542.

53. Langabeer SE, Walker H, Gale RE, et al. Frequency of CBF beta/MYH11 fusion transcripts in patients entered into the U.K. MRC AML trials. The MRC Adult Leukaemia Working Party. Br J Haematol. 1997;96:736-739.

54. Langabeer SE, Walker H, Rogers JR, et al. Incidence of AML1/ETO fusion transcripts in patients entered into the MRC AML trials. MRC Adult Leukaemia Working Party. Br J Haematol. 1997;99:925-928.

55. Grimwade D, Biondi A, Mozziconacci MJ, et al. Characterization of acute promyelocytic leukemia cases lacking the classic t(15;17): results of the European Working Party. Groupe Francais de Cytogenetique Hematologique. Groupe de Francais d’Hematologie Cellulaire, U.K. Cancer Cytogenetics Group and BIOMED 1 European Community-Concerted Action “Molecular Cytogenetic Diagnosis in Haematological Malignancies.” Blood. 2000;96:1207-1308.

56. Armstrong SA, Staunton JE, Silverman LB, et al. MLL translocations specify a distinct gene expression profile that distinguishes a unique leukemia. Nat Genet. 2002;30:41-47.

57. Golub TR, Slonim DK, Tamayo P, et al. Molecular classification of cancer: class discovery and class prediction by gene expression monitoring. Science. 1999; 286:531-537.

58. Kohlmann A, Schoch C, Schnittger S, et al. Molecular characterization of acute leukemias by use of microarray technology. Genes Chromosomes Cancer. 2003;37:396-405.

59. Schoch C, Hohlmann A, Schnittger S, et al. Acute myeloid leukemias with reciprocal rearrangements can be distinguished by specific gene expression profiles. Proc Natl Acad Sci U S A. 2002;99:10008-10013.

60. Rose NE, Mahfouz R, Onciu M, et al. Gene expression profiling of pediatric acute myelogenous leukemia. Blood. 2004; 104:3670-3687.

61. Lowenberg B, Downing JR, Burnett A. Acute myeloid leukemia. N Engl J Med. 1999;341:1051-1062.

62. Ravindranath Y. Recent advances in pediatric acute lymphoblastic and myeloid leukemia. Curr Opin Oncol. 2003; 15:23-35.


CASE 8 Acute Myeloblastic Leukemia with Maturation


CASE HISTORY

A 52-year-old man had the chief complaint of shortness of breath and fatigue. He was admitted to another hospital and was found to have anemia. A gastrointestinal workup showed nothing remarkable. A bone marrow biopsy was performed; the diagnosis was myelodysplastic syndrome: Refractory anemia with excess blasts. He was treated with Gleevac and prednisone to no avail. The patient had become transfusion-dependent.

When the patient was transferred to our hospital 1 year later, physical examination showed no hepatosplenomegaly or lymphadenopathy. His total leukocyte count was 56,000/µL with 44% blasts and 38% myeloid cells of various developmental stages, but only 1% of monocytes were demonstrated. Bone marrow examination revealed 68% myeloblasts and 23% other myeloid cells. The monocytes were <1%. No basophils were identified.


FLOW CYTOMETRIC FINDINGS

Bone marrow: Myeloid markers: myeloperoxidase (MPO) 20%, CD13-CD33 97%, CD14 0%, HLA-DR 85%. T-cell
marker: CD7 0%. Immature cell markers: CD34 51%, CD117 74% (Fig. 6.8.1).


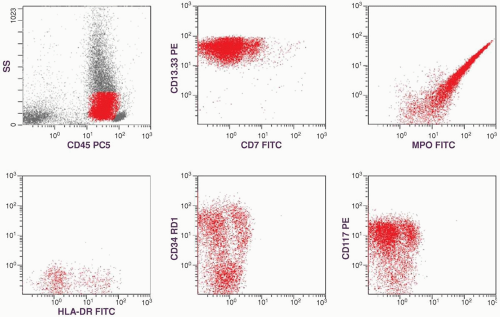
FIGURE 6.8.1 Flow cytometric analysis of bone marrow shows a tight cluster of leukemic cells in the cluster of differentiation (CD)45/side-scatter gating and a large population of maturing granulocytes with high side scatter. The population of leukemic cells is characterized by myeloid markers CD13-CD33, myeloperoxidase (MPO), and by stem cell markers CD34 and CD117. Human leukocyte antigen-DR (HLA-DR) is weekly positive. ss, side scatter; PC5, phycoerythrin cyanin 5; PE, phycoerythrin; FITC, fluorescein isothiocyanate; RD1, rhodamine.


MOLECULAR GENETICS

The karyotype was 46, XY, t(6;9)(p23;q34). A (CAN/DEK) fusion gene was detected by reverse transcriptase-polymerase chain reaction.


DISCUSSION

The definition of acute myeloblastic leukemia (AML) with maturation or AML M2 by French-American-British (FAB) classification includes the following criteria (1, 2, 3, 4, 5 and 6): (a) The myeloblast count should be ≥30% in the bone marrow or peripheral blood. The World Health Organization (WHO) system changes the threshold to 20% based on clinical trials. (b) The mature myeloid population from the segmented neutrophil to promyelocyte should be >10% in the bone marrow to distinguish from AML-M2 AML without maturation (AML-M1). (c) Monocytic components should be <20% in the bone marrow and <5 × 10⁹/L in the peripheral blood to exclude acute myelomonocytic leukemia.

In addition, the blast count should include blast type 1 (no cytoplasmic granules), blast type 2 (<20 cytoplasmic granules), and blast type 3 (>20 cytoplasmic granules). However, when blast type 3 is >10%, the leukemic case should be classified as AML with maturation, even though the mature granulocytes are <10% (1). Blast types 2 and 3 can be distinguished from promyelocytes by the centrally located nucleus, absence of a prominent Golgi zone, and presence of a fine chromatin pattern. AML with maturation is the most common subtype of AML, accounting for 25% to 45% of AML cases (4,7).


Morphology

In addition to what was described in the definition, this subtype frequently shows dysplastic changes in myeloid cells, including abnormal nuclear segmentation and hypogranulation (4). Eosinophilia may also be present in the bone marrow, but it does not show the cytological or cytochemical abnormalities characteristic of acute myelomonocytic leukemia with eosinophilia (4).

In the current case, the myeloblast count was 44% in the peripheral blood (Fig. 6.8.2) and 68.7% in the bone
marrow (Figs. 6.8.3 and 6.8.4). No monoblasts were demonstrated in the bone marrow, and <1% of monocytes were present. Therefore, morphologically, it fulfils the definition of AML with maturation. However, if monoblasts are present and the distinction between the myeloblast and monoblast populations is not certain, cytochemical staining is required to distinguish M2 from M4.


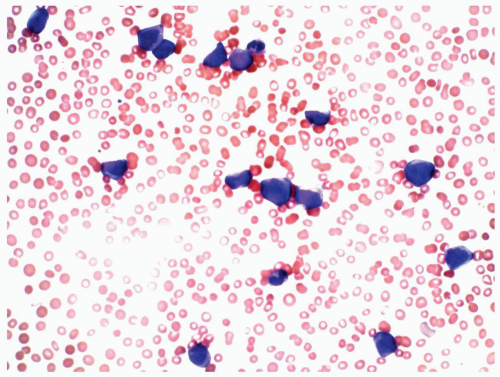
FIGURE 6.8.2 Peripheral blood smear shows myeloblasts and a few mature granulocytes. Wright-Giemsa, 40x magnification.

AML M2 cases with t(6;9)(p23;q34), such as our case, are frequently associated with myelodysplastic syndrome and basophilia in the bone marrow (2). The current case had a history of myelodysplastic syndrome, but basophilia was not demonstrated in the bone marrow.


Cytochemistry

The FAB system requires three cytochemical stains as the basis for AML classification. In M2, the MPO should be positive for >3% of blasts. The specific esterase or chloroacetate esterase (CAE) should be positive, and the nonspecific esterase or α-naphthyl butyrate esterase (NBE) should be negative for the blasts (Fig. 6.8.5). However, in some M2 cases, NBE was negative and yet focal staining of α-naphthyl acetate esterase (another monocyte marker) was demonstrated in most myeloblasts (8).


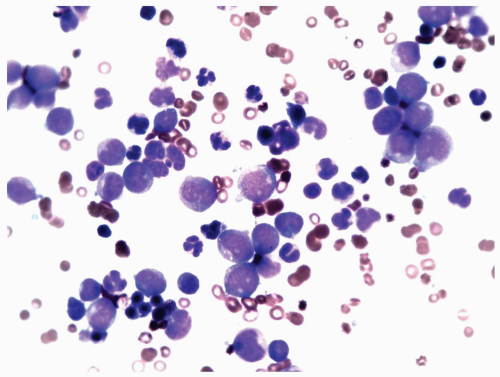
FIGURE 6.8.3 Bone marrow aspirate reveals a high percentage of myeloblasts intermingled with mature granulocytes. Wright-Giemsa, 60x magnification.


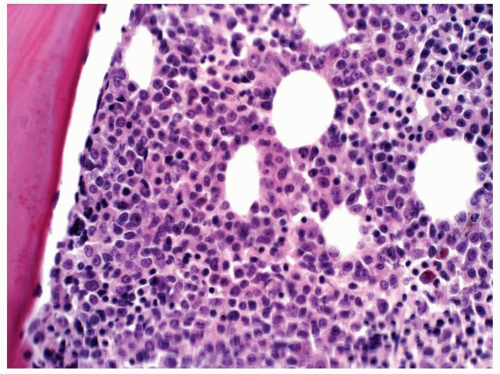
FIGURE 6.8.4 Bone marrow core biopsy demonstrates hypercellularity with mature and immature myeloid cells. No erythroid elements are demonstrated. Hematoxylin and eosin, 40x magnification.

A British group proposed using >50% of blasts with Sudan black B positivity as a cutoff to distinguish M2 from M1; the latter usually had <50% Sudan black B-positive blasts in the bone marrow (9). MPO is frequently stronger in M2 than in M1. When very strong MPO activity and abundant Auer rods are present in neutrophils and eosinophils in an M2 case, t(8;21) should be suspected (10,11) (see Case 4).


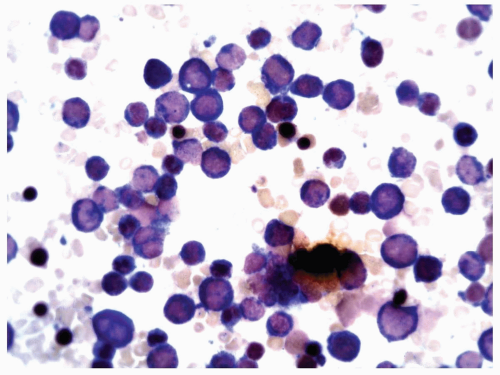
FIGURE 6.8.5 Bone marrow aspirate stained with combined esterases. All myeloblasts and different developmental stages of myeloid cells stained with chloroacetate esterase (blue). Only one monocyte is stained by α-naphthyl butyrate esterase (brown). Combined esterase stain, 60x magnification.


Immunophenotype

The FAB system uses morphology and cytochemical staining to classify AML. However, because immunophenotyping is now commonly applied to AML classification, cytochemical staining is no longer essential. For instance, in cases of minimally differentiated AML in which myeloperoxidase stain is negative, immunophenotyping by flow cytometry is critical to distinguish it from acute lymphoblastic leukemia.

A monoclonal antibody panel including CD13, CD14, CD15, CD33, CD64 and HLA-DR is sufficient to make a preliminary classification of AML subtypes (12). Whereas CD13 and CD33 are screening markers for AML, others help to differentiate the subtypes. CD14 and CD64 are present in monocytic subtypes (M4 and M5). HLA-DR is low or absent in acute promyelocytic leukemia. CD15 is supposed to be negative in M1 and can help to distinguish other subtypes, but it may be present in some M1 cases and is thus not very specific.

The malignant nature of the myeloid population is identified by two markers, CD34 and CD117. CD34 is a hematopoietic progenitor antigen; therefore, a high percentage of CD34-positive cells is suggestive of leukemia or myelodysplasia (13,14). CD34 is preferentially present in the most immature phenotypes (M1, M2, and M5a) (15). Recently, CD117, a stem cell factor receptor also known as c-kit, is used to supplement CD34 in identifying myeloblasts. CD117 is negative in cases of acute lymphoblastic leukemia, but it is positive in cases of AML including acute promyelocytic leukemia (M3) (16).

AML may also express lymphoid markers, such as CD2, CD7, CD10, CD19, and CD20 (6). The demonstration of a single lymphoid marker in a myeloid population does not indicate a biphenotypic leukemia; rather this aberrant immunophenotype supports the diagnosis of malignancy. CD7 is the most commonly expressed marker, found in 19% to 32% of AML cases depending on the subtypes (6,17). Therefore, CD7 has been included in the diagnostic panel for AML in many laboratories.

Immunohistochemistry may demonstrate myeloid markers, such as myeloperoxidase, lysozyme, and CAE (Leder stain). CD34 and CD117 may also be demonstrated by immunohistochemical stains, which, however, are usually less sensitive than flow cytometry; only partial or negative staining is present in most cases (Fig. 6.8.6). The salient features for laboratory diagnosis of acute myeloblastic leukemia with maturation are summarized in Table 6.8.1.


Molecular Genetics

The most frequent cytogenetic abnormality seen in about 46% of M2 cases is t(8;21)(q22;q22) (18). This is classified as a separate subtype in the WHO system and is described in Case 4.

Another group of M2 is associated with basophilia in the bone marrow. At least two abnormal karyotypes have been found in this group of M2: t/del(12)(p11-13) and t(6;9)(p23;q34) (2). In these cases, the blasts are agranular, but other cells show evidence of maturation toward basophils (19). Basophilic granules can also be detected in a few blasts by electron microscopy. The t(6;9)(p23;q34) results in the formation of a chimeric fusion gene: DEK/CAN (4).


FIGURE 6.8.6 Bone marrow biopsy shows scattered CD34-positive myeloblasts. Immunoperoxidase, 40x magnification.

There are several rare abnormal karyotypes reported in M2 cases. These include inv(3)(q21;q26), t(3;3)(q21;q26), t(7;11)(p15;p15), t(6;21)(p11;q22), +11(2.23), and double minute chromosomes (2,20,21). A rare karyotype of t(8;16)(p21;p13) is associated with hemophagocytosis, particularly erythrophagocytosis (22).


Clinical Manifestations

AML with maturation occurs in all age groups with 40% seen in patients older than 60 years and 25% in patients younger than 25 years (4). The clinical symptoms are not
different from other subtypes of AML. The major mechanisms are failure of the leukemic cells to mature and inhibition of normal hematopoiesis. As a result, the patients may have anemia, neutropenia, and/or thrombocytopenia. This subtype of AML usually responds well to chemotherapy, but the prognosis is frequently associated with the abnormal karyotype of the leukemic cells.


TABLE 6.8.1


Salient Features for Laboratory Diagnosis of Acute Myeloblastic Leukemia with Maturation


1.


20% to 90% of myeloblasts present in bone marrow or blood


2.


<20% monocytic components in the bone marrow


3.


<5 × 10⁹/L monocytic components in the peripheral blood


4.


Cytochemical stain for blasts: Positive for myeloperoxidase and chloroacetate esterase but negative for α-naphthyl butyrate esterase


5.


Monoclonal antibody panel: Positive for CD13, CD15, CD33, HLA-DR; negative for CD14 and CD64


6.


CD34, CD117, and CD7 can be positive to support the malignant nature.


7.


Immunohistochemistry: Positive for lysozyme, myeloperoxidase, chloroacetate esterase, CD34, or CD117


CD, cluster of differentiation; HLA-DR, human leukocyte antigen-DR.


REFERENCES

1. Bennett JM, Catovsky D, Daniel MT, et al. Proposed revised criteria for the classification of acute myeloid leukemia: a report of the French-American-British Cooperative Group. Ann Intern Med. 1985;103:620-624.

2. Second MIC Cooperative Study Group. Morphologic, immunologic and cytogenetic (MIC) working classification of the acute myeloid leukemias. Br J Haematol. 1988;68: 487-494.

3. Goasguer JE, Bennett JM. Classification of acute myeloid leukemia. Clin Lab Med. 1990;10:661-681.

4. Brunning RD, Matutes E, Flandrin G, et al. Acute myeloid leukaemia not otherwise categorised. In: Jaffe ES, Harris NL, Stein H, Vardiman JW, eds. Tumours of Haematopoietic and Lymphoid Tissues. Lyon, France: IARC Press; 2001: 93-94.

5. Brunning R. Acute myeloid leukemia. In: Knowles DM, ed. Neoplastic Hematopathology. 2nd ed. Philadelphia: Lippincott Williams & Wilkins; 2001:1667-1715.

6. Smith M, Barnett M, Bassan R, et al. Adult acute myeloid leukaemia. Crit Rev Oncol Hematol. 2004;50:197-222.

7. Lowenberg B, Downing JR, Burnett A. Acute myeloid leukemia. N Engl J Med. 1999;341:1051-1062.

8. Elghetany MT, MacCallum JM, Davey FR. The use of cytochemical procedures in the diagnosis and management of acute and chronic myeloid leukemia. Clin Lab Med. 1990;10: 707-720.

9. Hoyle CR, Gray RG, Wheatley K, et al. Prognostic importance of Sudan black positivity: a study of bone marrow slides from 1386 patients with de novo acute myeloid leukemia. Br J Haematol. 1991;79:398-407.

10. Hayhoe FGJ. Cytochemistry of acute leukemias. Histochem J. 1984;16:1051-1059.

11. Yunis JJ, Lobell M, Arnesen MA, et al. Refined chromosome study helps define prognostic subgroups in most patients with primary myelodysplastic syndrome and acute myelogenous leukemia. Br J Haematol. 1988;68:189-194.

12. Neame PB, Soamboonsrup P, Browman GP, et al. Classifying acute leukemia by immunophenotyping: a combined FAB immunologic classification of AML. Blood. 1986;68:1355-1362.

13. Krause DS, Fackler MJ, Givin CI, et al. CD34: structure, biology, and clinical utility. Blood. 1996;87:1-13.

14. Sawada K, Sato N, Notoya A, et al. Proliferation and differentiation of myelodysplastic CD34+ cells: phenotypic subpopulations of marrow CD34+ cells. Blood. 1995;85:194-202.

15. Robertson MJ, Ritz J. Prognostic significance of the surface antigens expressed by leukemic cells. Leuk Lymphoma. 1994;13:15-22.

16. Hans CP, Finn WG, Singleton TP, et al. Usefulness of anti-CD117 in the flow cytometric analysis of acute leukemia. Am J Clin Pathol. 2002;117:301-305.

17. Kita K, Miwa H, Nakase K, et al. Clinical importance of CD7 expression in acute myelocytic leukemia. Blood. 1993;81: 2399-2405.

18. Nucifora G, Rowley JD. The AML and ETO genes in acute myeloid leukemia with a t(8;21). Leuk Lymphoma. 1994;14: 353-362.

19. Daniel MT, Bernheim A, Flandrin G, et al. Leucemic Aigue Myeloblastique (M2) avec atteinte de la lignec basophile et anomalies du bras court du chromosome 12(12p-). C R Acad Sci Paris. 1985;301:299.

20. Fujimura T, Ohyashiki K, Ohyaskiki JH, et al. Two additional cases of acute myeloid leukemia with t(7;11)(p15;p15) having low neutrophil alkaline phosphatase scores. Cancer Genet Cytogenet. 1993;68:143-146.

21. Thomas L, Stamberg J, Gojo I, et al. Double minute chromosomes in monoblastic (M5) and myeloblastic (M2) acute myeloid leukemia: two case reports and a review of the literature. Am J Hematol. 2004;77:55-61.

22. Mrozek K, Heinonen K, de la Chapelle A, et al. Clinical significance of cytogenetics in acute myeloid leukemia. Semin Oncol. 1997;24:17-31.


CASE 9 Acute Myelomonocytic Leukemia


CASE HISTORY

A 60-year-old man presented to the emergency room because of a 1-day history of severe epistaxis. He first noticed small amount of bleeding from his nose a few days before, but it stopped spontaneously. The patient also complained of a 40-pound weight loss in the past several months. On admission, he was found to have a hematocrit of 18% as compared with his previous record of 38% a few months ago. His platelet count was 120,000/µL. His leukocyte count was 6,400/µL with 66% neutrophils, 18% lymphocytes, and 18% monocytes. After blood transfusion and intravenous fluids, the patient’s condition was stabilized and his bleeding stopped. An ear, nose, and throat (ENT) physician was consulted, but he did not find any visible nasal masses. Because of positive occult blood in the stool, a computed tomography (CT) scan of the abdomen, a colonoscopy, and an upper endoscopy were performed. A sigmoid colon polyp was found, but biopsy showed no malignancy. The patient was discharged 1 week after admission.


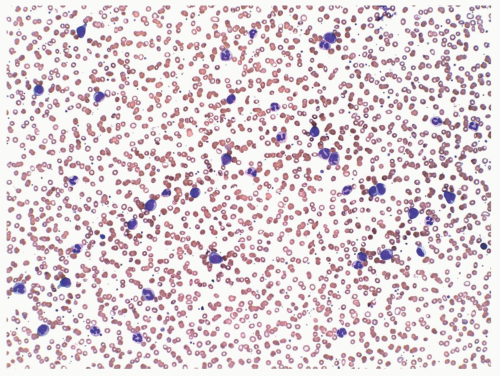
FIGURE 6.9.1 Peripheral blood smear shows leukocytosis consisting of mature and immature myelomonocytic cells. Wright-Giemsa, 20x magnification.

During the subsequent follow-up period, the patient’s platelet count gradually returned to normal, but his hematocrit remained at low level (30%) and hemoglobin, 10 g/dL. Hypersegmented and hypogranular granulocytes, giant platelets, spherocytosis, and polychromasia were seen in the peripheral blood. The patient was considered to have myelodysplastic syndrome. However, his leukocyte count rapidly rose to 30,000/µL and the blasts gradually went up to 21% (Fig. 6.9.1). Monocytosis was also present. Bone marrow examination showed 16% myeloblasts, 15% monoblasts and/or promonocytes, 26% monocytes, 2.5% promyelocytes, 6.7% myelocytes, 7.3% metamyelocytes, 12.3% bands, and 5.25% segmented granulocytes. Only 6% of erythroid series was demonstrated (Figs. 6.9.2 and 6.9.3). A diagnosis of acute myeloid leukemia (AML) was established approximately 2 months after first admission.


FLOW CYTOMETRIC FINDINGS

Bone marrow: Myelomonocytic markers: CD13-CD33 98%, CD13-CD33/CD7 40%, CD14 HLA-DR 94%, CD34 89%, CD117 93% (Fig. 6.9.4).


CYTOCHEMICAL FINDINGS

In the bone marrow aspirate smear, myeloperoxidase (MPO) stain was positive in >5% of blasts. The chloroacetate esterase (CAE) and α-naphthyl butyrate esterase (NBE) stains demonstrated approximately the same percentages of myeloid and monocytoid cells.


DISCUSSION

Acute myelomonocytic leukemia (M4) accounts for 20% to 30% of AML cases (1, 2 and 3). Therefore, it is as common as AML M2 in frequency. The diagnostic criterion as defined by the French-American-British (FAB) group is the presence of 30% of blasts in the bone marrow, including type I and type II myeloblasts, monoblasts, and promonocytes (4). The World Health Organization (WHO) classification, however, lowers the cutoff point of blasts in the bone marrow to 20%. In the differential count, both the granulocytic and monocytic components should exceed 20%; below this threshold, the leukemia is classified as M5 or M2, respectively.


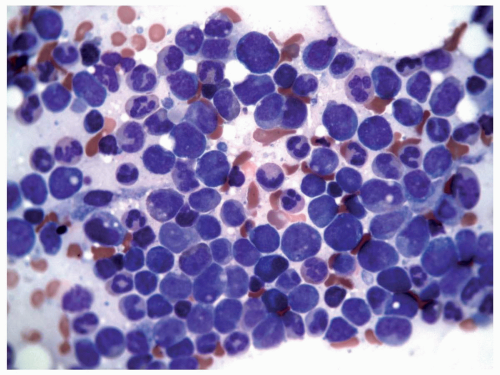
FIGURE 6.9.2 Bone marrow aspirate shows a packed marrow with mostly immature myeloid and monocytoid cells. Wright-Giemsa, 60x magnification.

Cytochemical stains should be used to determine the percentages of myeloid and monocytoid cells. The monocytoid cells can be identified by nonspecific esterase, and the myeloid cells by specific esterase (see Case 7). The identification of monocytoid cells in the bone marrow is
particularly difficult by morphology. However, nonspecific esterase can be weak or absent in monocytoid cells in some cases. If morphologic identification of monocytes is certain, absence of nonspecific esterase does not exclude the diagnosis of M4 (2).


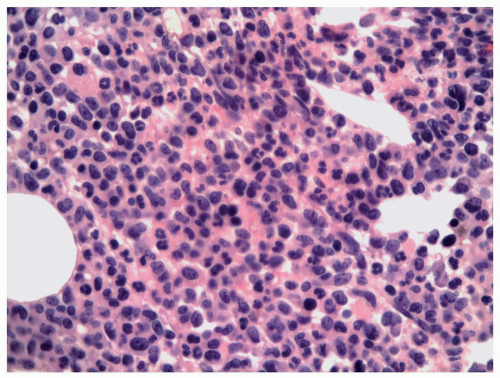
FIGURE 6.9.3 Bone marrow core biopsy reveals hypercellular bone marrow with myelomonocytic leukemic cells replacing the normal hematopoietic components. Hematoxylin and eosin, 20x magnification.


FIGURE 6.9.4 Flow cytometric histograms from a case of acute myelomonocytic leukemia (not the current case) demonstrated two immature cell clusters in the dot plot. Both populations express CD117, CD13-CD33, and (partially) CD7. The red cluster also shows CD14 and human leukocyte antigen-DR (HLA-DR). PC5, phycoerythrin cyanin 5; FITC, fluorescein isothiocyanate; PE, phycoerythrin; SS, side scatter.

When the percentage of monocytoid cells in bone marrow is <20%, the peripheral blood should have >5 × 10⁹/L monocytes to meet the diagnostic criteria (4). When the monocyte count is below that level, a high lysozyme concentration can be used as evidence for a significant monocytosis, thus substantiating the diagnosis of M4 (4). The lysozyme concentrations should exceed three times the normal values in serum or urine to be considered significant. The only exception is the subtype of M2 with eosinophilia that may show a high lysozyme level because eosinophils also contain lysozyme (5).

In the current case, the first presentation in the preleukemic phase was epistaxis, which led to the discovery of anemia and thrombocytopenia in this patient. In the follow-up period, features of myelodysplastic syndrome became apparent, which rapidly evolved into AML that was composed of both myeloid and monocytoid elements. Based on the bone marrow differential count, the cytochemical findings, and flow cytometric results, this case fulfills the diagnostic criteria of M4.


Morphology and Cytochemistry

The leukemic component in M4 includes type I and type II myeloblasts, monoblasts, and promonocytes (4). Type I myeloblasts have no cytoplasmic granules, and type II myeloblasts have <20 azurophilic granules. Monoblast and monocytes may or may not have cytoplasmic granules, but their nuclei differ from those of myeloblasts in a folded or lobulated configuration. However, the very immature monoblast may show round or oval nuclei that are similar to those of myeloblasts, but monoblasts are usually larger than myeloblasts and have abundant cytoplasm with irregular border.

Cytochemical stains are originally required by the FAB system for estimation of the percentages of these two populations, because the distinction between myeloblasts and monoblasts is sometimes difficult. However, with the recent development of flow cytometry and immunohistochemistry, cytochemistry is gradually being replaced.


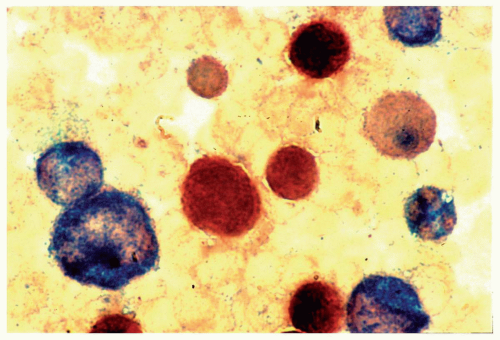
FIGURE 6.9.5 A bone marrow aspirate reveals chloroacetate esterase-positive (blue) and α-naphthyl butyrate esterase-positive (brown) populations. Note that some cells are positive for both esterases. Combined esterase stain, 100x magnification. (From Sun T. Flow cytometric analysis of hematologic neoplasms, 2002.)

The distinction between monoblasts and promonocytes depends on the nuclear configuration, the chromatin pattern, and the prominence of nucleoli. Promonocytes usually have more obvious lobulation of the nuclei, more mature chromatin pattern, and less conspicuous nucleoli than the monoblasts have.

In the leukemic population, the myeloblasts are positive for MPO, Sudan black B, and CAE. The monoblasts and promonocytes are positive for nonspecific esterases, which include NBE and α-naphthyl acetate esterase. Monocytic series react either weakly positive or negative to MPO and Sudan black B stains.

In some cases of M4, the leukemic cells may show both CAE and NBE in the same cells (6,7) (Fig. 6.9.5). This population is considered to be a group of hybrid monocyte-granulocyte. Monocytic components in M4 also show double staining of lactoferrin and lysozyme, characteristic of granulocytes (8). Therefore, the myelocytic and monocytic components in M4 are probably derived from the same precursor cells (8).

A subtype of M4 shows bone marrow eosinophilia. This subtype accounts for 15% to 30% of M4 cases (9) and is designated M4 with eosinophilia (M4Eo). M4Eo is associated with a special cytogenetic karyotype: inv(16) or, less frequently, t(16;16). This entity is described in Case 5.


Immunophenotype

The immunophenotypes of various subtypes of AML were delineated by several groups in the late 1980s (10, 11 and 12). Since then, flow cytometry has become the mainstay for the subclassification. The major myelomonocytic markers are CD13 and CD33, which have been routinely used for screening of myelomonocytic cells. Recently, cytoplasmic staining of MPO also has been included in the panel for AML. The monocytic component, as seen in M4 and M5, is routinely scanned by CD14, which includes several monoclonal antibodies from different manufacturers, such as M02, MY4, and LeuM3. The combined use of MO2, MY4, and CD64 is able to distinguish various maturation stages (13). CD64 is positive for the entire spectrum of monocytes, MY4 for promonocytes and mature monocytes, and MO2 for mature monocytes only.

Other markers, such as CD11b and CD11c, are not as specific for monocytes as CD14, but they are sometimes more sensitive than the latter. CD11b and CD11c are negative for myeloblasts, but can be demonstrated in the more mature forms of myeloid cells. These monocytic markers, however, cannot be relied upon for quantitation; for instance, to distinguish M4 from M5 (11). Other monocyte markers, such as CD32 and CD36, are seldom used for the diagnosis of AML.

In addition to the identification of myeloid and monocytoid lineage, the immunophenotype should include the immature cell markers, such as CD34 and CD117, to identify the malignant nature of the myelomonocytic population (2,14).

HLA-DR is routinely included in the AML panel, because its absence or decrease in percentage is characteristic of acute promyelocytic leukemia (M3). In the microcytic form of M3, the leukemic cells may show monocytoid nuclei; in those cases, M4 and M5 should be included in the differential diagnosis.

A few studies emphasized the prognostic value of some myeloid markers. For instance, My7 (CD13) and My4 (CD14) are predictors for a low rate of complete remission (15,16). A high CD33/CD13 ratio, in contrast, is a favorable prognostic factor (16). A CD17 antigen, which is seldom included in an AML panel, is a predictor for a shorter survival (12).

T-cell antigens have been detected in 44% of M4-M5 cases (CD2 14%, CD4 12%, CD7 36%) in one study (11). In general, CD7 is the most commonly coexpressed lymphoid antigen in AML cases (3); therefore, it becomes a routine component in the AML panel.

Immunohistochemical staining may demonstrate MPO, lysozyme, CAE (Leder stain), CD15, and CD68. There are two clones of CD68: KP-1 is present in both myeloid and monocytoid cells, whereas PG-M1 is specific for monocytes and/or histiocytes (17). Therefore, the use of PG-M1 is most helpful in identifying the monocytic component in M4 (Fig. 6.9.6). The immature cell markers, CD34 and CD117, can be used to identify the malignant nature of the myeloid cells, if it is not morphologically apparent. In general, flow cytometry is the preferred technique to immunohistochemistry in diagnosing this subtype of AML.


Molecular Genetics

In typical M4 cases, the most common cytogenetic abnormality is the translocation of 11q23 with other partner chromosomes, which is seen in about 20% of M4 and M5 cases (1). In a recent study of 1897 AML cases, the incidence of 11q23 abnormality in M4, M5a, and M5b is 4.7%, 33.3%, and 15.9%, respectively (18). Molecular studies have identified a human homolog of the Drosophila trithorax gene designated mixed-lineage leukemia (MLL) gene, as it can be demonstrated in both acute myeloid and lymphoid leukemias (9).


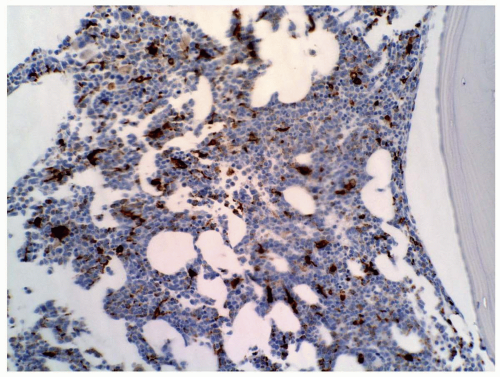
FIGURE 6.9.6 Bone marrow core biopsy shows many cells with CD68 PG-M1 staining. Myeloperoxidase stain, 20x magnification.

More than 30 partners of the MLL gene have been described (19). Among these translocations, t(9;11) is most common. In the Cancer and Leukemia Group B (CALGB) study, AML cases with t(9;11) have longer overall survival than that of other 11q23 rearrangement (20). However, another study found no difference in prognosis between t(9:11) and other forms of 11q23 translocation (18). The incidence of AML with MLL rearrangement is significantly higher in therapy-related AML than in de novo AML (18). In general, AML cases with 11q23 abnormality carry an unfavorable prognosis. The most specific genetic aberration, however, is found in the cases of M4Eo, which show inv(16)(p12q22), t(16;16)(p12;q22), or del(16)(q22). This entity is described in Case 5.

An abnormal karyotype, t(6;9)(p21-22;q34) is seen in M4 with basophilia (21). Recently, t(8;16)(p11;p13) has been found in an increasing number of M4 and M5 cases, which are characterized by the presence of erythrophagocytosis in the leukemic blasts (22, 23 and 24). Other low frequency aberrations include inv(3q26), t(3:3), and +4 (1,21). One study has found high expression of the cfos proto-oncogene in M4 and M5 cases (25). N-ras mutation has been reported in a single case of M4 (26).

The salient features for laboratory diagnosis of M4 are summarized in Table 6.9.1.


Clinical Manifestations

M4 occurs in all age groups but is more common in older individuals with the median age of 50 years (2,27). The male/female ratio was 1.4:1 in one study (27).

The clinical presentation is leukocytosis in 85% of patients, and 10% are leukopenic (27). As in the current case, anemia and thrombocytopenia are characteristic features (2). Consequently, patients may have fatigue, fever, bleeding disorders, and gingival hyperplasia. Lymphadenopathy is present in about half the patients and hepatosplenomegaly in 30% to 35% (27). Some patients are preceded with chronic myelomonocytic leukemia (2).


TABLE 6.9.1


Salient Features for Laboratory Diagnosis of AML-M4


1.


Presence of at least 20% myeloblasts-monoblasts-promonocytes in bone marrow


2.


Both myeloid and monocytoid series should be >20%.


3.


If monocytic component is <20% in bone marrow:


a.


Monocyte count in peripheral blood should be >5 × 10⁹/L.


b.


Serum lysozyme level should exceed three times the normal value.


4.


Myeloperoxidase (Sudan black B) positive cells: >3%


5.


Specific and nonspecific esterase-positive cells should be >20%.


6.


Flow cytometry: Positive for CD13, CD14, CD33, HLA-DR, myeloperoxidase, and one of the stem cell markers (CD34 or CD117)


7.


Immunohistochemistry: Positive for myeloperoxidase, lysozyme, chloroacetate esterase, CD15, CD68, CD34, and CD117


8.


Common karyotypes: 11q23 translocation with a partner gene; chromosome 16 abnormalities in M4 with eosinophilia; t(6:9) in M4 with basophilia; t(8;16) in M4/M5 with erythrophagocytosis


AML, acute myeloid leukemia; CD, cluster of differentiation; HLA-DR, human leukocyte antigen-DR.


REFERENCES

1. Lowenberg B, Downing JR, Burnett A. Acute myeloid leukemia. N Engl J Med. 1999;341:1051-1062.

2. Brunning RD, Matutes E, Flandrin G, et al. Acute myeloid leukemia not otherwise categorized. In: Jaffe ES, Harris NL, Stein H, Vardiman JW, eds. Tumours of Haematopoietic and Lymphoid Tissues. Lyon, France: IARC Press; 2001:91-105.

3. Smith M, Barnett M, Bassan R, et al. Adult acute myeloid leukaemia. Crit Rev Oncol Hematol. 2004;50:197-222.

4. Bennett JM, Catovsky D, Daniel MT, et al. Proposed revised criteria for the classification of acute myeloid leukemia. A report of the French-American-British Cooperative Group. Ann Intern Med. 1985;103:626-629.

5. Moscinski LC, Kasnic G, Saskar A. The significance of an elevated serum lysozyme value in acute myelogenous leukemia with eosinophilia. Am J Clin Pathol. 1992;97:195-201.

6. Huhn D, Twardzik L. Acute myelomonocytic leukemia and the French-American-British classification. Acta Haematol. 1983;69:36-40.

7. Li CY, Phyliky RL, Yam LT. Acute myelomonocytic leukemia. An unusual variant with both granulocytic and monocytic esterases in the leukemic cells. Mayo Clin Proc. 1986;61: 104-109.

8. Saito N. Acute myelomonocytic leukemia. An immunoelectron microscopic study. Am J Hematol. 1990;35:238-246.

9. Brunning RD, Matutes E, Flandrin G, et al. Acute myeloid leukaemia with recurrent genetic abnormalities. In: Jaffe ES, Harris NL, Stein H, Vardiman JW, eds. Tumours of Haematopoietic and Lymphoid Tissues. Lyon, France: IARC Press; 2001:81-87.


10. Neame PB, Soamboonstrup P, Browman GP, et al. Classifying acute leukemia by immunophenotyping. A combined FAB-immunologic classification of AML. Blood. 1986;68: 1355-1362.

11. Schwonzen M, Kuehn N, Vetten B, et al. Phenotyping of acute myelomonocytic (AMMOL) and monocytic leukemia (AMOL). Association of T-cell-related antigens and skininfiltration in AMOL. Leuk Res. 1989;13:893-898.

12. Merle-Beral H, Due LNC, Leblond V, et al. Diagnostic and prognostic significance of myelomonocytic cell surface antigens in acute myeloid leukemia. Br J Haematol. 1989;73: 323-330.

13. Yang DT, Greenwood JH, Hartung L, et al. Flow cytometric analysis of different CD14 epitopes can help identify immature monocytic populations. Am J Clin Pathol. 2005;124: 930-936.

14. Hans CR, Finn WG, Singleton TP, et al. Usefulness of anti-CD117 in the flow cytometric analysis of acute leukemia. Am J Clin Pathol. 2002;118:31-37.

15. Griffin JD, Davis R, Nelson DA, et al. Use of surface marker analysis to predict outcome of adult acute myeloblastic leukemia. Blood. 1986;68:1232-1241.

16. Kristensen JS, Hokland P. Monoclonal antibodies in myeloid diseases. Prognostic use in acute myeloid leukemia. Leuk Res. 1991;15:693-700.

17. Knowles DM. Immunophenotypic markers useful in the diagnosis and classification of hematopoietic neoplasms. In: Knowles DM, ed. Neoplastic Hematopathology. 2nd ed. Philadelphia: Lippincott Williams & Wilkins; 2001:93-226.

18. Schoch C, Schnittger S, Klaus M, et al. AML with 11q23/MLL abnormalities as defined by the WHO classification: incidence, partner chromosomes, FAB subtype, age distribution, and prognostic impact in an unselected series of 1897 cytogenetically analyzed AML cases. Blood. 2003;102:2395-2402.

19. Rowley JD. The role of chromosome translocation in leukemogenesis. Semin Hematol. 1999;36(suppl 7): 59-72.

20. Mrozek K, Heinonen K, Lawrence D, et al. Adult patients with de novo acute myeloid leukemia and t(9;11)(p22;q23) have a superior outcome to patients with other translocations involving band 11q 23: a cancer and leukemia group B study. Blood. 1997;90:4532-4538.

21. Second MIC Cooperative Study Group. Morphologic, immunologic and cytogenetic (MIC) working classification of the acute myeloid leukemias. Br J Haematol. 1988;68: 487-494.

22. Stark B, Resnitzky P, Jeison M, et al. A distinct subtype of M4/M5 acute myeloblastic leukemia (AML) associated with t(8;16)(p11;p13), in a patient with the variant t(8;19)(p11;q13)-case report and review of the literature. Leuk Res. 1995;19:367-379.

23. Velloso ERP, Mecucci C, Michaux L, et al. Translocation t(8;16)(p11;p13) in acute nonlymphocytic leukemia. Report of two cases and review of the literature. Leuk Lymphoma. 1996;21:137-142.

24. Sun T, Wu E. Acute monoblastic leukemia with t(8;16). A distinct clinicopathologic entity: report of a case and review of the literature. Am J Hematol. 2001;66:207-212.

25. Mavilio F, Testa W, Sposi NM, et al. Selective expression of fos proto-oncogene in human acute myelomonocytic and monocytic leukemias. A molecular marker of terminal differentiation. Blood. 1987;69:160-164.

26. Vandenberghe E, Baens M, Stul M, et al. Alteration of N-ras mutation in a patient with AML M4 and trilineage myelodysplasia. Br J Haematol. 1991;79:338-340.

27. Brunning RD, McKenna RW. Tumors of the Bone Marrow. Armed Forces Institute of Pathology (AFIP) Fascicle 9, 3rd series. Washington, DC: AFIP; 1994:51-55.


CASE 10 Acute Monoblastic and Monocytic Leukemia (M5) and 11q23 (Mixed Lineage Leukemia) Abnormalities


CASE HISTORY

A 71-year-old man presented with a history of abdominal pain radiating to his chest for 4 days. The patient had lost 18 pounds in the past 6 months. He was diagnosed with adenocarcinoma of the lung by fine-needle aspiration 2 years ago. Because of his seizure activity, the patient had a biopsy of the right parietal lobe, which proved to be metastatic carcinoma of the lung. The patient received local radiation therapy to his thorax and brain at that time. During a visit to the outpatient clinic, the patient was found to have a leukocyte count of 20,500/µL, with 43% segmented neutrophils, 12% bands, 28% lymphocytes, and 15% blasts. He was then scheduled for admission in 2 weeks.

On the day of admission, the leukocyte count rose to 62,700/µL with a differential of 7% segmented neutrophils, 1% bands, 9% lymphocytes, and 81% blasts. Bone marrow examination revealed 95% cellularity, and the aspirate showed 85% monoblasts, 7% promonocytes, and 3% monocytes. Only 5% of normal hematopoietic cells in the myeloid and erythroid cell lines were present.

Because the patient had stage IV lung cancer and type II Mobitz II heart block at the same time, no specific antileukemic treatment was given. He was treated with hydroxyurea to relieve leukostasis and allopurinol to prevent
tumor lysis. The patient was discharged and died at home on the day of discharge.


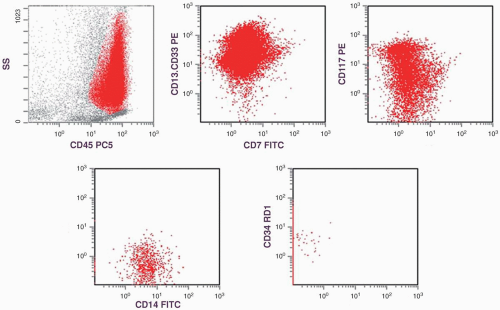
FIGURE 6.10.1 Flow cytometric analysis of bone marrow in an M5 case shows positive reactions to cluster of differentiation (CD)7, CD13.CD33, CD14, and CD117, but negative reactions to CD34. These histograms are not from the current case. SS, side scatter; PE, phycoerythrin; PC5, phycoerythrin cyanin 5; FITC, fluorescein isothiocyanate; RD1, rodamine.


FLOW CYTOMETRY FINDINGS

Bone marrow: Myeloperoxidase (MPO) 30%, CD13-CD33 92%, CD14 48%, CD11c 29%, HLA-DR 87%, CD34 8%, CD7 0% (Fig. 6.10.1).


CYTOCHEMICAL FINDINGS

MPO stain was positive in >10% of blasts. The combined esterase stain showed that >80% blasts in the bone marrow were positive for α-naphthyl butyrate esterase (Fig. 6.10.2).


CYTOGENETIC FINDINGS

Cytogenetic analysis showed two abnormal clones. The first clone of 7 cells revealed t(8;16)(p11.2;p13.3), and the second clone of 4 cells had additional material of unknown
origin on the short arm of the other chromosome 16 in addition to the t(8;16).


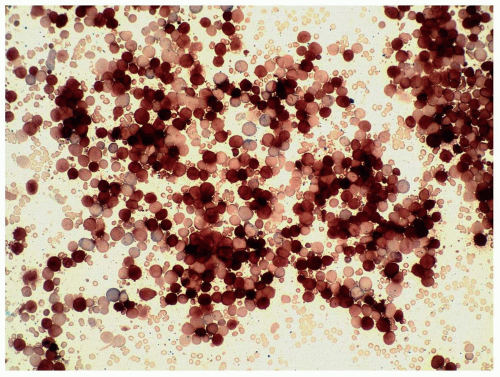
FIGURE 6.10.2 Combined esterase stain of a bone marrow aspirate shows predominantly nonspecific esterase staining of the blasts. Specific esterase stains only a few mature myeloid cells. 40x magnification.


DISCUSSION

The French-American-British criteria for the diagnosis of acute monoblastic leukemia (M5) require 80% or more of the nonerythroid cells in the bone marrow to be monoblasts, promonocytes, or monocytes (1). If the predominant component (>80%) is monoblasts, the condition is designated M5a, whereas the predominant components should be promonocytes in M5b. There are no consistent differences in clinical presentation between these two subtypes (2, 3 and 4). The incidence of these two subtypes combined is approximately 2% to 9% of all cases of acute myeloid leukemia (AML) (5,6).


Morphology

The monoblasts are usually larger than the myeloblasts, measuring about 40 to 50 µm in diameter (Figs. 6.10.3 and 6.10.4). The cytoplasm in most monoblasts is abundant with a grayish-blue tinge. It contains fine or inconspicuous granules, and the cell border is irregular. The nuclei of the very immature monoblasts are round or oval, but folding or creasing is frequently visible in most monoblasts. The promonocyte differs from the monoblast in its smaller size (up to 35 µm) and more prominent folding or creasing or lobulation of the nuclei. The presence of nucleoli in most promonocytes helps distinguish them from mature monocytes. Cytoplasmic vacuolation is frequently seen in monocytic elements. In general, if leukemic bone marrow shows a great variation in the nuclear configuration from cell to cell, the possible diagnosis of M5 should be considered (Figs. 6.10.4 and 6.10.5). Despite all these characteristics, cytochemical stain should be done routinely to definitively identify monocytic elements. For instance, neuroblastoma cells may occasionally be mistaken as monoblasts (7).


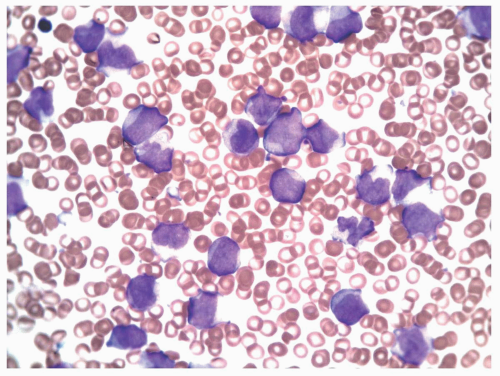
FIGURE 6.10.3 Peripheral blood smear of an M5 case shows various monocytic stages. Wright-Giemsa, 60x magnification.


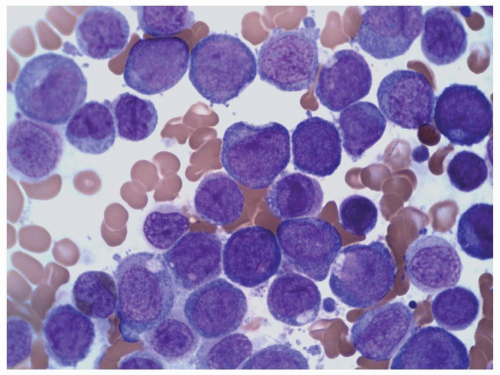
FIGURE 6.10.4 Bone marrow aspirate of an M5 case shows many monoblasts and promonocytes with a few monocytes. Wright-Giemsa, 100x magnification.

For cytochemical staining, M5 is an exceptional subtype of AML that is not required to have more than 3% MPO-positive blasts, because MPO is frequently negative in M5 (8,9). However, the MPO-negative cases should have a strong nonspecific esterase staining to back up the diagnosis. Chloroacetate esterase and periodic acid-Schiff are usually negative in M5, but they can be weakly positive in some cases (8,9). One study found that only one half of the M5 cases were positive for both α-naphthyl acetate esterase and CD14, whereas 25% were positive for α-naphthyl acetate esterase only and another 25% were positive for CD14 only (10). Therefore, a combination of cytochemistry
and immunophenotyping is necessary for an accurate diagnosis of M5.


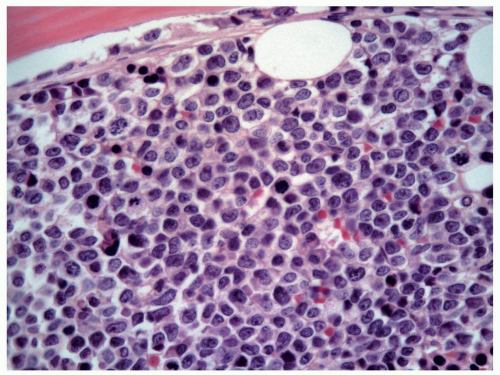
FIGURE 6.10.5 Bone marrow biopsy of an M5 case shows various stages of monocytes, replacing the normal hematopoietic cells. Hematoxylin and eosin, 60x magnification.


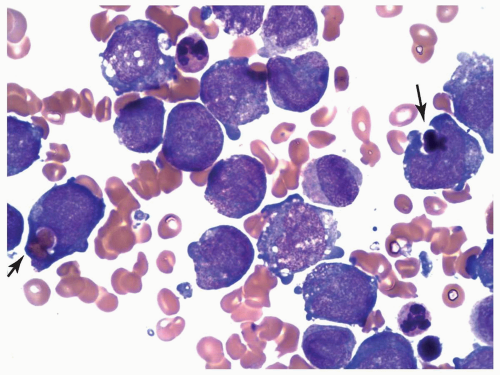
FIGURE 6.10.6 Bone marrow aspirate of an M5 case with t(8;16) shows phagocytosis of erythrocytes and normoblasts by monoblasts (arrows). Wright-Giemsa, 100x magnification.

In the current case, the patient’s bone marrow contained 95% monocytic cells with 85% monoblasts, which were verified by the nonspecific esterase stain. Therefore, a diagnosis of acute monoblastic leukemia was established. In addition, erythrophagocytosis was demonstrated in the monoblasts (Fig. 6.10.6), and the blasts in the peripheral blood showed prominent cytoplasmic granules (Fig. 6.10.7). These cytologic features are characteristic of a subtype of AML (usually M4 or M5) with the t(8;16) translocation, as documented in our case. As will be discussed later, this karyotype is not very common, but it is worth identifying because it carries a particularly poor prognosis, especially in treatment-related or secondary leukemia (11,12).


FIGURE 6.10.7 Peripheral blood smear of an M5 case with t(8;16) shows hypergranular monoblasts. Wright-Giemsa, 100x magnification.


Immunophenotype

The immunophenotype of M5 is composed of two sets of antigens. The first set is myeloid markers, which include CD13, CD15, CD33, and CD117 (13). However, myeloid markers, such as CD13 and CD15, can be selectively lost in M5 cases (14). The second set is monocyte markers that include CD4, CD11b, CD11c, CD14 (My4, LeuM3, and Mo2), CD32, CD36, CD64, CD68, and lysozyme. However, CD32 and CD36 are seldom used in routine testing (15,16).

CD34, the stem cell marker, is frequently negative in M5 (13,17), so CD117 is very important to identify the immature cells and to establish the diagnosis of leukemia. Previous studies have emphasized the percentage of CD14 expression as the major tool for distinction between M4 and M5 (18), but this assertion was subsequently challenged by others (19,20).

Although M5a and M5b share all antigens, some antigens are preferentially expressed in mature cells whereas others are demonstrated in immature cells. For instance, CD4 and CD14 are mainly demonstrated in mature monocytes, so they are often present in M5b cases (3,21). In contrast, CD117 is shown mainly in immature monocytes (21). CD11b and CD11c are present in both mature and immature monocytes; therefore, an immunophenotype of CD14− CD11b+ CD117+ is often seen in M5a cases (4). A recent study demonstrates that the combined use of different CD14 epitopes (Mo2 and My4) and CD64 can stratify different maturation stages of monocytes; this strategy appears to be useful in separating M5a and M5b (22). CD64 is positive for all mature and immature monocytes. My4 is present in mature monocytes and promonocytes, whereas Mo2 is only expressed by mature monocytes (22).

Immunoperoxidase antigen can be demonstrated by flow cytometry in M5b cases, but less often in M5a cases (13). However, immunoperoxidase activity is seldom demonstrated by cytochemistry in M5 cases.

CD56, a natural killer (NK) cell marker, is frequently positive in M5 cases, even though it is not specific (14,23). In one study, CD56 was demonstrated in 86% of M5 cases, just second to blastic NK-cell lymphoma and/or leukemia in frequency and far higher than any other AMLs (17).

Lymphoid markers can be detected in certain percentages of M5 cases. T-cell markers (CD2 and CD7) have been demonstrated in M5 cases (17,19). CD20 and CD23 have also been detected in a subpopulation of blast cells in M5 (17,21). Cases with a CD14-negative and T-cell antigen-positive phenotype are associated with leukemic skin infiltration (19). Platelet-megakaryocyte antibodies (CD41, CD42, and CD61) and antierythroid antibody (antiglycophorin A) do not cross-react with M5 cells. However, CD36, another platelet antigen, has been consistently demonstrated in both M5a and M5b cases (21).

A relatively new marker for monocytic lineage is CD163, which is the hemoglobin scavenger receptor. It can be demonstrated in M4 and M5 cases, but is seldom present in other AMLs (24).


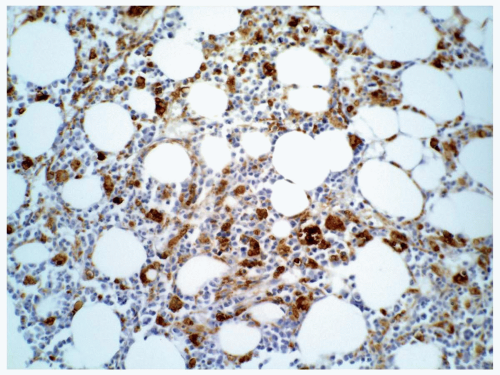
FIGURE 6.10.8 Bone marrow biopsy of an M5 case shows extensive staining of CD68 PG-M1. Immunoperoxidase, 20x magnification.


Comparison of Flow Cytometry and Immunohistochemistry

For the diagnosis of M5, the most difficult part is the identification of the monocytic series. Flow cytometry is able to demonstrate several markers, including CD4, CD11b, CD11c, CD14, and CD64. CD68 is most frequently used in immunohistochemistry, but two clones of CD68 are available. The KP-1 antibody is positive for both myeloid and monocytic cells, whereas PG-M1 is specific for monocytes (Fig. 6.10.8). Lysozyme stain can also be used in tissue stain, but it can be present in both monocytes and myelocytes. If the cell lineage cannot be clearly identified by immunophenotyping, cytochemistry is the final resort. Both α-naphthyl butyrate esterase and α-naphthyl acetate esterase are specific for monocytic series, if the stains are inhibited by sodium fluoride.


Molecular Genetics

The most common cytogenetic aberration in M5 involves 11q23; it accounts for 20% of abnormalities in M5 (25). In the World Health Organization (WHO) classification, 11q23 abnormalities are grouped together as a separate entity, but these abnormalities are mainly present in M5 cases.

Although >30 partner genes have been found participating in translocation of 11q23, only several chromosomal loci, including 6q27, 9q22, 10p12, 27q21, and 19p13.1, are frequently involved (4,25, 26, 27 and 28). The t(6;11) is usually seen in young men who present clinically with localized infection and a moderate leukocytosis (27).

The gene located at 11q23 was originally called ALL1, but it was later found that ALL1 is the same as MLL (mixed lineage leukemia) gene (28). Because 11q23-involved abnormalities have been found in AML, acute lymphoblastic leukemia, and lymphomas, MLL is the preferred term to use.

In a study of 58 M5a and 66 M5b patients, 11q23/MLL aberrations were detected in 31% of M5a cases and 12.1% of M5b cases (29). The second most common cytogenetic abnormality in this study was sole trisomy 8, which was found in 22.4% of M5a and 3% of M5b cases (29).

Another cytogenetic abnormality, t(8;16)(p11;p13), is only seen in 2% of M5 cases (25), but it is associated with highly specific pathologic findings, namely erythrophagocytosis by leukemic blasts and hypergranulation in monocytic components (11,30, 31 and 32). The gene located at 8p11 is MOZ (monocytic leukemia zinc finger), and that at 16p13 is CBP (cAMP response element-binding [CREB]-binding protein). Normally, MOZ protein interacts with its cognate complex and joins the general transcription apparatus complex to direct transcription of a certain gene (33). CBP protein, in contrast, interacts with an appropriate DNA binding factor and the transcriptional apparatus complex to direct transcription of another gene (33). As a result of the translocation, the fusion product of these two genes (MOZ/CBP) may lead to leukemogenesis through three possible mechanisms: the fusion product mis-targets the wrong gene instead of the genes these two individual proteins (MOZ and CBP) are supposed to target, the fusion product misregulates the targeted gene(s), and the fusion product loses normal function in directing DNA transcription (33).

In patients with a normal karyotype, partial tandem duplication of the MLL gene (MLL-PTD) was identified in 1.7% of M5a cases and 4.5% of M5b cases by reverse transcriptase-polymerase chain reaction (RT-PCR) and was confirmed by Southern blot (29). The frequency of Fms-like tyrosine kinase 3 length mutations (FLT3-LM) was detected by the same techniques in 6.9% of M5a and 28.8% of M5b cases (29). The FLT3 gene mutations in other studies were reported to be as high as 40% (4).

The salient features for laboratory diagnosis of M5 are summarized in Table 6.10.1.


Clinical Manifestations

M5 is predominantly seen in adults older than 40 years and in children younger than 10 years (50% of M5 patients are younger than 2 years) (34). Congenital M5 cases have been reported from time to time (34, 35, 36 and 37). The occurrence of M5 in young children appears to be associated with in utero exposure to pesticides and solvents (34). Pediatric patients usually have a worse prognosis than adult patients have.

M5 cases generally have higher leukocyte and platelet counts and more frequent lymphadenopathy than do other subtypes of AML (2,34). Disseminated intravascular coagulation is frequently seen in M5, second only to M3 (2,34). The lysozyme level is elevated in 67% to 100% of M5 cases. As lysozyme is nephrotoxic, 40% of M5 patients in one study had renal insufficiency, which was proportional to the lysozyme levels (38). About one fourth of patients with M5 have leukemic infiltration of skin (Fig. 6.10.9) and/or gum, one half have hepatosplenomegaly with or without lymphadenopathy, 3% to 22% have central nervous system involvement, and 28% have renal failure (2,3,39).

As a result of all these complications, M5 patients have a shorter survival time than patients with other subtypes of AML, although the complete remission rate may be comparable (2,40). The three major factors affecting the survival time in M5 cases are age, renal failure, and serum β2 microglobulin (B2M) levels, as demonstrated in one study (3). Patients with renal failure or high B2M levels have a
median survival of 1 and 3 weeks, respectively, whereas patients with no renal failure or low B2M levels have a median survival of 26 and 29 weeks, respectively. In the same study, lysozyme, lactate dehydrogenase, and B2M levels were elevated in 88%, 68%, and 81% of M5 cases, respectively, but the first two components did not show statistically significant association with patient prognosis (3).


TABLE 6.10.1


Salient Features for Laboratory Diagnosis of M5


1.


Presence of >80% monocytic components among the nonerythroid cells in the bone marrow


a. M5a: ≥80% of monocytic components are monoblasts.


b. M5b: Predominantly monocytes and promonocytes


2.


Elevation of serum and urine lysozyme levels


3.


Cytochemistry


Myeloperoxidase: May or may not be positive


Nonspecific esterase: Strongly positive


Specific esterase and periodic acid-Schiff: Usually negative


4.


Immunophenotype


Myeloid markers: CD33, CD13, CD15 may be positive, but one or more markers may be selectively lost.


Monocytic markers: CD4, CD11b, CD11c, CD14, CD64, CD68, and lysozyme may be positive, but one or more markers may be selectively lost.


Immature cell markers: CD34 is usually negative, and CD117 is frequently positive.


Frequently positive nonspecific marker: CD56


Consistently negative markers: CD41, CD42, CD61, glycophorin A


5.


Cytogenetics: Associated with t/del(11)(q23), t(8;16) (p11;p13), or others


6.


Molecular biology: MLL gene on 11q23 and MOZ/CBP on 8p11/16p13


FLT3 gene mutation is a frequent finding in patients with a normal karyotype.


CD, cluster of differentiation; MLL, mixed lineage leukemia; MOZ/CBP, monocytic leukemia zinc finger/CREB-binding protein; FLT3, Fms-like tyrosine kinase 3.


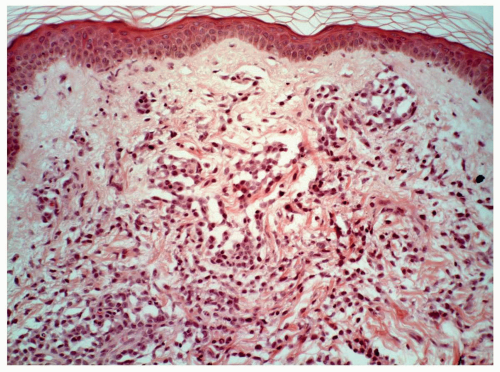
FIGURE 6.10.9 Skin biopsy of an M5 case shows extensive leukemic cell infiltration in the dermis. Hematoxylin and eosin, 20x magnification.

A recent study considered the poor prognosis of M5 associated with cytogenetic abnormalities, such as mutations in the FLT3 genes (4). This study also found that the disease-free survival and overall survival of patients with M5 did not appear to differ from non-M5 AML cases with currently available therapy.

The clinical features in patients with t(8;16) are similar to those without this aberration. However, patients with t(8;16) have a higher frequency of coagulopathy and extramedullary dissemination (11,30, 31 and 32).


REFERENCES

1. Bennett JM, Catovsky D, Daniel MT, et al. Proposed revised criteria for the classification of acute myeloid leukemia. A report of the French-American-British Cooperative Group. Ann Intern Med. 1985;103:620-625.

2. Peterson BA, Levine EG. Uncommon subtypes of acute nonlymphocytic leukemia: clinical features and management of FAB M5, M6, and M7. Semin Oncol. 1987;14:425-434.

3. Scott CS, Stark AN, Limbert HJ, et al. Diagnostic and prognostic features in acute monocytic leukemia: an analysis of 51 cases. Br J Haematol. 1988;69:247-252.

4. Tallman MS, Kim HT, Paietta E, et al. Acute monocytic leukemia (French-American-British classification M5) does not have a worse prognosis than other subtypes of acute myeloid leukemia: a report from the Eastern Cooperative Oncology Group. J Clin Oncol. 2004;22:1276-1286.

5. Flandrin G, Bernard J. Cytological classification of acute leukemias. A survey of 1400 cases. Blood Cells. 1975;1:7-15.

6. Petti MC, Anadori S, AnninoL, et al. Clinical and biological aspects of acute monocytic leukemia (a retrospective study of 29 patients). Haematologica. 1982;67:556-566.

7. Boyd JE, Parmley RT, Langevin AM, et al. Neuroblastoma presenting as acute monoblastic leukemia. J Pediatr Hematol Oncol. 1966;18:206-212.

8. Goaguen JE, Bennett JM. Classification of acute myeloid leukemia. Clin Lab Med. 1990;10:661-681.

9. Elghetany MT, MacCallum JM, Davey FR. The use of cytochemical procedures in the diagnosis and management of acute and chronic myeloid leukemia. Clin Lab Med. 1990; 10:707-720.

10. Milligan DW, Roberts BE, Limbert HJ, et al. Cytochemical and immunological characteristics of acute monocytic leukemia. Br J Haematol. 1984;58:391-397.

11. Sun T, Wu E. Acute monoblastic leukemia with t(8;16): A distinct clinicopathologic entity; report of a case and review of the literature. Am J Hematol. 2001;207-212.

12. Tasaka T, Matsuhashi Y, Uehara E, et al. Secondary acute monocytic leukemia with a translocation t(8;16)(p11;p13): case report and review of the literature. Leuk Lymphoma. 2004;45:621-625.

13. Brunning RD, Matutes E, Flandrin G, et al. Acute myeloid leukaemia not otherwise categorized. In: Jaffe ES, Harris NL, Stein H, Vardiman JW, eds. Tumours of Haematopoietic and Lymphoid Tissues, Lyon: IARC Press, 2001:91-105.

14. Dunphy CH, Orton SO, Mantell J. Relative contributions of enzyme cytochemistry and flow cytometric immunophotyping to the evaluation of acute myeloid leukemias with a monocytic component and of flow cytometric immunophenotyping to the evaluation of absolute monocytosis. Am J Clin Pathol. 2004;122:865-874.


15. Merle-Beral H, Due LNC, Leblond V, et al. Diagnostic and prognostic significance of myelomonocytic cell surface antigens in acute myeloid leukemia. Br J Haematol. 1989;73:323-330.

16. Ball ED. Immunophenotyping of acute myeloid leukemia cells. Clin Lab Med. 1990;10:721-736.

17. Gorczyca W: Flow cytometry immunophnotypic characteristics of monocytic population in acute monocytic leukemia (AML-M5), acute myelomonocytic leukemia (AML-M4), and chronic myelomonocytic leukemia (CMML). Methods Cell Biol. 2004;75:665-677.

18. Neame PB, Soamboonsrup P, Browman GP, et al. Classifying acute leukemia by immunophenotyping: a combined FAB-immunologic classification of AML. Blood. 1986;68:1355-1362.

19. Schwonzen M, Juehn N, Vetten B, et al. Phenotyping of acute myelomonocytic (AMMOL) and monocytic leukemia (AMOL): association of T-cell related antigens and skin infiltration in AMOL. Leuk Res. 1989;13:893-898.

20. Drexler HG. Classification of acute myeloid leukemias – FAB or immunophenotyping. Leukemia. 1987;1:697-705.

21. Khalidi H, Medeiros LJ, Chang K, et al. The immunophenotype of acute myeloid leukemia: high frequency of lymphoid antigen expression and comparison of immunophenotype, French-American-British classification, and karyotypic abnormalities. Am J Clin Pathol. 1998;109:211-220.

22. Yang DT, Greenwood JH, Hartung L, et al. Flow cytometric analysis of different CD14 epitopes can help identify immature monocytic populations. Am J Clin Pathol. 2005;124:930-936.

23. Tauchi T, Ohyashiki K, Ohyashiki JH, et al. CD4+ and CD56+ acute myeoloblastic leukemia. Am J Hematol. 1990;34:228-229.

24. Walter RB, Bachli EB, Schaer DJ, et al. Expression of the hemoglobin scavenger receptor (CD163/HbSR) as immunophenotypic marker of monocytic lineage in acute myeloid leukemia. Blood. 2003;101:3755-3756.

25. Lowenberg B, Downing JR, Burnett A. Acute myeloid leukemia. N Engl J Med. 1999;341:1051-1062.

26. Berger R, Le Coniat M, Flexor MA, et al. Translocation t(10;11) involving the MLL gene in acute myeloid leukemia. Importance of fluorescence in situ hybridization (FISH) analysis. Ann Genet. 1996;39:147-151.

27. Welborn JL, Jenks HM, Hagemeijer A. Unique clinical features and prognostic significance of the translocation (6;11) in acute leukemia. Cancer Genet Cytogenet. 1993;65:125-129.

28. Caligiuri MA, Strout MP, Gilliland DG. Molecular biology of acute myeloid leukemia. Semin Oncol. 1997;124:32-44.

29. Haferlach T, Schoch C, Schnittger S, et al. Distinct genetic patterns can be identified in acute monoblastic and acute monocytic leukemia (FAB AML M5a and M5b): a study of 124 patients. Br J Haematol. 2002;118:426-413.

30. Hanslip JI, Swansbury GJ, Pinkerton R, et al. The translocation t(8;16)(p11;p13) defines an AML subtype with distinct cytology and clinical features. Leu Lymphoma. 1992;6:479-486.

31. Stark B, Resnitzky R, Jeison M, et al. A distinct subtype of M4/M5 acute myeloblastic leukemia (AML) associated with t(8;16)(p11;p13) in a patient with the variant t(8;19)(p11;q13) – case report and review of the literature. Leuk Res. 1995;19:367-379.

32. Velloso ERP, Mecucci C, Michaux L, et al. Translocation t(8;16)(p11;p13) in acute non-lymphocytic leukemia: report on two new cases and review of the literature. Leuk Lymphoma. 1996;21:137-142.

33. Jacobson S, Pillus L. Modifying chromatin and concepts of cancer. Curr Opin Genet Dev. 1999;9:175-184.

34. Odom LF, Lampkin BC, Tannous R, et al. Acute monoblastic leukemia. A unique subtype – a review from the children’s cancer study group. Leuk Res. 1990;14:1-10.

35. Osada S, Horibe K, Oiwa K. A case of infantile acute moncytic leukemia caused by vertical transmission of the mother’s leukemic cells. Cancer. 1990;65:1146-1149.

36. Dinulos JG, Hawkins DS, Clark BS, et al. Spontaneous remission of congenital leukemia. J Pediatr. 1997; 131:300-303.

37. Fernandez MC, Weiss B, Atwater S, et al. Congenital leukemia successful treatment of a newborn with t(5;11) (q31;q33). J Pediatr Hematol Oncol. 1999;21: 152-157.

38. Weil M, Jacuillar C, Tobelem G. Therapy of acute monoblastic leukemia. Haematol Blood Transf. 1981;27:189-194.

39. Brunning RD. Acute myeloid leukemia. In: Knowles DM, ed. Neoplastic Hematopathology, 2nd ed. Philadelphia: Lippincott Williams & Wilkins, 2001:1667-1715.

40. Case 50-1990. Case records of the Massachusetts General Hospital. N Engl J Med. 1990;323:1689-1697.


CASE 11 Acute Erythroid Leukemia


CASE HISTORY

A 69-year-old man was admitted to the hospital for evaluation of anemia and thrombocytopenia. One week prior to admission, the patient started to have low-grade fever, nausea, malaise, and nonbloody diarrhea. He also had several episodes of epistaxis during the past week. The blood work done in the physician’s laboratory revealed a hematocrit of 20% and platelets of 30,000/µL and was referred to our hospital for further evaluation. His routine hematology workup 3 months before admission was essentially normal except for a hematocrit of 34%.

On admission, the patient looked pale, but no petechiae or ecchymosis was found on the skin. Physical examination revealed no hepatosplenomegaly or lymphadenopathy. Laboratory data showed normal serum iron, lactate dehydrogenase, and fibrinogen. D-dimer, fibrinogen split products, and direct Coomb test were negative.

A bone marrow aspirate showed 87.7% normoblasts including 55.7% pronormoblasts. There were 10.3% myeloid
cells, which included no myeloblasts. The pronormoblasts were pleomorphic with multiple intraplasmic vacuoles that were positive for periodic acid-Schiff (PAS) stain. The maturing normoblasts revealed megaloblastoid changes and nuclear dysplasia.


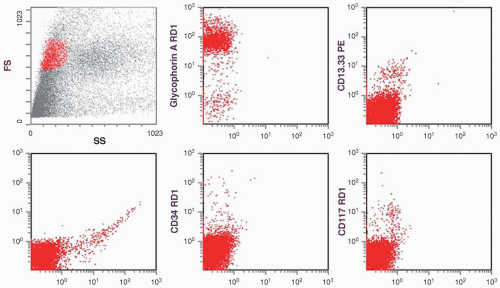
FIGURE 6.11.1 Flow cytometric analysis using the forward scatter (FS) versus side scatter (SS) plot, as the normoblasts are CD45 dim or negative. The histograms show positive glycophorin A reaction, but negative reactions for human leukocyte antigen-DR (HLA-DR), CD34, and CD117. A low percentage of CD13-CD33 is detected. FITC, fluorescein isothiocyanate; RD1, rhodamine; PE, phycoerythrin.

A diagnosis of acute erythroid leukemia was made. The patient’s family was informed of the poor prognosis in association with this disease. The patient refused to receive blood products, and the family opted to go home for home hospice care.


FLOW CYTOMETRY FINDINGS

The bone marrow aspirate revealed 3% myeloperoxidase (MPO), 65% CD13-CD33, 0% CD13-CD33/CD7, 2% CD14, 0% human leukocyte antigen-DR (HLA-DR), 44% glycophorin A, and 3% CD34 (Fig. 6.11.1).


CYTOGENETIC FINDINGS

Cytogenetic analysis of the bone marrow detected a complex abnormal karyotype. There was additional material on the short arm of chromosomes 7 and 21 and on the long arm of chromosome 11. A deletion of 5q and 7q and loss of chromosome 16 were also present.


DISCUSSION

Acute erythroid leukemia (AML-M6) is a rare disease, accounting for 4% to 5% of all acute myeloid leukemia (AML). Giovanni di Guglielmo was the first one to recognize this entity (1). In 1917, he described a syndrome with a mixed population of immature erythroid and myeloid cells (later referred to as di Guglielmo syndrome), and in 1926 he reported a disease with pure immature erythroid proliferation (later referred to as di Guglielmo disease) (2). However, this concept of subdivision of erthroleukemia did not draw attention in the field of hematology until recently. The French-American-British (FAB) criteria for M6 is the presence of at least 50% normoblasts (erythroblasts) among the total number of nucleated cells and 30% type I and type II blasts among the nonerythroid population in the bone marrow (Fig. 6.11.2) (3). According to this classification, any case with <30% myeloblasts should be included in the myelodysplastic syndrome. However, Kowal-Vern et al. (4) recognized the prognostic significance of the immature erythroid components; cases with an increased pronormoblast to myeloblast ratio have worse prognosis than those with a higher myeloblast count (4). They suggested the subdivision of M6 into M6a (the original M6) and M6b (pure erythroid leukemia). The same concept was presented by Garand et al. (5) and Hasserjian et al. (6); these groups designated the pure
erythroid leukemia as AML-M6 variant. Mazzella et al. (7) further subdivided AMA-M6 into M6a, M6b, and M6c (7). This group defined M6c cases as those with both myeloblasts and pronormoblasts >30% of the nucleated cells.


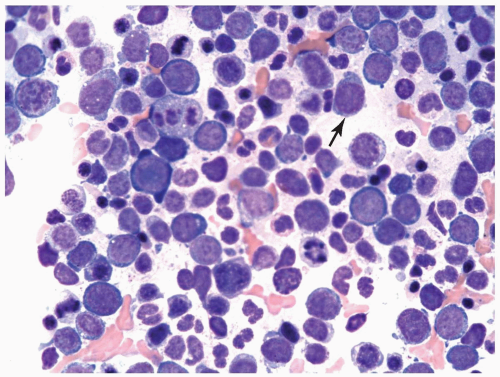
FIGURE 6.11.2 Bone marrow aspirate from a case of erythroleukemia (erythroid/myeloid) shows mainly pronormoblasts with a few myeloblasts (arrow). Wright-Giemsa, 60× magnification.

In the World Health Organization (WHO) classification, the original erythroleukemia is now designated erythroleukemia (erythroid/myeloid), and the requirement for the myeloblast count in the nonerythroid population has been reduced to ≥20% (8, 9 and 10). AML-M6b is designated as pure erythroid leukemia, which requires >80% of immature erythroid cells without a significant myeloblastic component in the bone marrow (Fig. 6.11.3).


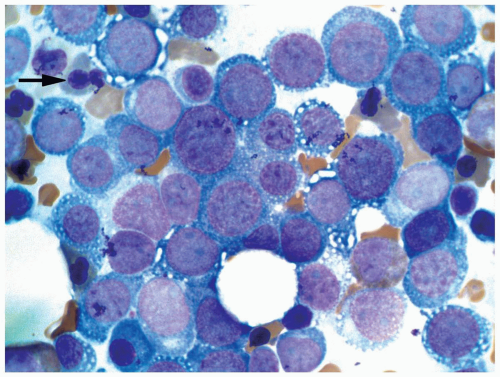
FIGURE 6.11.3 Bone marrow aspirate from a case of pure erythroid leukemia reveals predominantly pronormoblasts with other stages of normoblasts. Myeloblasts are absent. Note cytoplasmic vacuolation in pronormoblasts and a few dysplastic nucleated erythrocytes (arrow). Wright-Giemsa, 100× magnification.


Morphology and Cytochemistry

The characteristic morphologic features of acute erythroid leukemia are the predominance of atypical erythroid precursors of all maturation stages and the presence of erythrodysplasia in the bone marrow. As mentioned before, the percentages of the erythroid precursors and myeloblasts distinguish erythroleukemia (erythroid/myeloid) (M6a) from pure erythroid leukemia (M6b). In the peripheral blood, anisopoikilocytosis, macrocytosis, schistocytes, and nucleated erythrocytes may be present, but blasts are seldom encountered.

The erythroid precursors are mainly composed of pronormoblasts and basophilic normoblasts in M6a, but they are usually undifferentiated in M6b; cytochemistry and immunochemistry are often required for identification. The pronormoblasts are of large size with regular cell borders. The cytoplasm is deeply basophilic and devoid of granules. The nucleus is perfectly round with a delicate chromatin pattern, sometimes referred to as a sievelike pattern. The leukemic pronormoblasts and basophilic normoblasts are highly pleomorphic, varying in size and shape. The nuclei can be polylobulated, multiple, fragmented, or extraordinarily large. One to a few prominent nucleoli are usually present. The cytoplasm is characterized by multiple vacuolation and lack of hemoglobinization.

The erythrodysplastic features include megaloblastoid/megaloblastic changes, nuclear budding, nuclear bridging, and other irregular configurations of the nucleus. The frequent presence of erythrodysplasia in M6 may be because most cases of M6 evolve through a myelodysplastic phase (11). M6 is frequently associated with a history of myelodysplastic syndrome, chemotherapy, or exposure to toxin or alcohol (7,12).

The myeloblasts in M6a are not different from those seen in M1 and M2. Auer rods can be found in occasional cases. Dysplastic features are seldom seen in myeloid and megakaryocytic lineages. If a suspicious M6a case shows ≥50% dysplastic myeloid or megakaryocytic cells, it should be classified as AML with multilineage dysplasia (9,10). In cases suspicious for M6b, vitamin B12 and folate deficiency and erythropoietin therapy should always be excluded before a diagnosis is made (2,9). The distinction between M6a and refractory anemia with excess blasts is sometimes difficult, because when there is marked erythroid hyperplasia in myelodysplastic syndrome, the myeloblast count in the small population of nonerythroid nucleated cells may easily reach the 20% cutoff required for the diagnosis of M6a (13).

Cytochemical stain is helpful in substantiating the diagnosis of M6. PAS is normally negative in nucleated red blood cells. However, it is often positive in M6 cases showing coarse granules (block pattern) in pronormoblasts and basophilic normoblasts, and diffuse cytoplasmic staining in polychromatophilic and orthochromic normoblasts (Fig. 6.11.4). A negative PAS stain, however, does not exclude the diagnosis of M6. The MPO, Sudan black B, and chloroacetate esterase stains are negative for normoblasts; if they are positive in M6 cases, the cells that pick up the
stains are myeloblasts (Fig. 6.11.5) (14). Some early normoblasts may show weak focal α-naphthyl butyrate esterase stain, which is, however, not helpful in the diagnosis. The Prussian blue stain for iron is helpful to detect ringed sideroblasts, which are seen more frequently in M6b than in M6a cases (2).


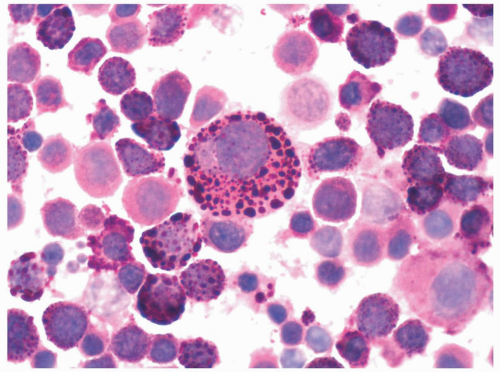
FIGURE 6.11.4 Bone marrow aspirate from a case of pure erythroid leukemia shows coarse periodic acid-Schiff (PAS)-positive granules in the cytoplasm of pronormoblasts and basophilic normoblasts, but diffuse staining in polychromatophilic and orthochromatic normoblasts. PAS, 100× magnification.

In the current case, the bone marrow contained 87% erythroid precursors including 55% pronormoblasts without the presence of myeloblasts. The pronormoblasts were pleomorphic, and the cytoplasm was vacuolated. The normoblasts other than the pronormoblasts showed marked nuclear dysplasia. The bone marrow biopsy was hypercellular with extensive erythroblastic infiltration (Figs. 6.11.6 and 6.11.7). The cytochemical stain demonstrated strong cytoplasmic PAS staining with a block pattern. The flow cytometry revealed 44% glycophorin A. With all this laboratory information, a definitive diagnosis of pure erythroid leukemia (M6b) was established.


FIGURE 6.11.5 Bone marrow aspirate from a case of M6a reveals myeloperoxidase staining in the myelocytic series including myeloblasts, but the normoblasts are negative. Myeloperoxidase, 100× magnification.


FIGURE 6.11.6 Bone marrow core biopsy from a case of erythroid leukemia shows normal hematopoietic cells are replaced by erythrocytic series. Hematoxylin and eosin, 40× magnification.


Immunophenotype

In M6a cases, the erythroid precursors are usually recognizable. However, M6b cases often show primitive blasts, and the PAS stain can be negative or equivocal; therefore, immunophenotyping is frequently required for a final diagnosis.


FIGURE 6.11.7 Pronormoblasts in a bone marrow biopsy readily recognizable in a Giemsa-stained preparation. Giemsa, 100× magnification.


Several antibodies can help to identify the erythroid series. Early antibodies include anti-hemoglobin and anticarbonic anhydrase I antisera, which identify the normal components of erythrocytes, but these components may not be present in very immature cells (15,16). The mouse monoclonal antibody, FA6-152, is positive for erythrocyte burst-forming units, erythrocyte colony-forming units, pronormoblasts, and normoblasts, but it is also present in normal monocytes and megakaryocytes (17). A murine monoclonal antibody developed at the Mayo Clinic, RC82.4, is reported to be specific and sensitive in detecting normal and leukemic erythroid cells without cross-reactivity to other cell lineages (16). However, the nature of the antigen with which RC-82.4 reacts is still not clear, and the antibody is not commercially available.

Gupta and Dhond (18) used a panel of monoclonal antibodies specific for different developmental stages (erythrocyte burst-forming units, erythrocyte colony-forming units, normoblasts, erythrocytes) and components (glycophorin A and H antigens) of erythroid cells and found that, in most cases of M6, the phenotype of the pronormoblasts was that of the intermediate stage of maturation (19). Transferrin receptor antibody (CD71) has also been used to detect mature and immature nucleated erythrocytes (18). Although CD71 has been used in the monoclonal antibody panel for the diagnosis of M6 (20), it is an activation antigen, presenting in various conditions, and thus not specific for M6. The erythroid precursors may express CD36, but this antigen is also present on megakaryocytes and monocytes (8).

Greaves et al. (21) found that 78% of 27 cases of M6 reacted with glycophorin-A antibody, but only 3% of 724 cases of nonerythroid leukemias had a positive reaction to that antibody. Because of its specificity and availability, glycophorin-A antibody has become the most widely used for the identification of erythroid cells and diagnosis of M6 (22). Glycophorin-A antibody has been used in flow cytometry and, more recently, in immunohistochemistry.

Using glucose-6-phosphate dehydrogenase isoenzyme analysis, it has been found that M6 is a clonal disorder arising from a multipotent stem cell (23). The human erythroleukemia cell line expresses surface antigens of the erythroid, macrophage, and megakaryocyte lineages (24). This cell line can be induced by different agents into full expression of erythroid, macrophage, or megakaryocyte phenotypes (24). Therefore, it is not surprising to see that leukemic cells in M6 cases may react to myeloid antigens (CD11b, CD13, CD15, and CD33) and platelet antigen (CD41) (2,11,18). However, the reactions to these antigens are not consistent, and the results are sometimes due to the coexistence of myeloblasts and increased megakaryocytes in the bone marrow; thus, myelomonocytic or megakaryocytic antigens should not be depended on for the diagnosis of M6.

CD34 was present in 26% of M6a and 26.7% of M6b cases in one study (7). However, the percentage of CD34 was proportional to that of myeloblasts rather than pronormoblasts. The expression of CD117 (c-kit) is also associated with myeloblasts (9).


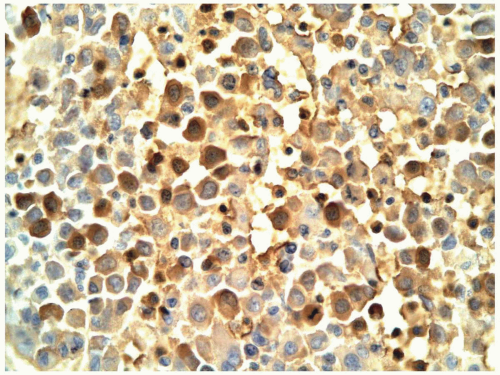
FIGURE 6.11.8 Erythroid cells in an M6 case are highlighted by hemoglobin A staining. 60× magnification.


Comparison of Flow Cytometry and Immunohistochemistry

Immunohistochemical stains can demonstrate erythroid precursors with glycophorin-A and hemoglobin A antibodies (Fig. 6.11.8) (9). Myeloblasts can be detected with CD34 and CD117 together with other myeloid antibodies (e.g., MPO, CD33). In contrast, glycophorin A is the only antibody useful for the diagnosis of M6 by flow cytometry.


Molecular Genetics

The percentage of aneuploidy is particularly high (63%) in M6 (25). Most cases show complex karyotypes with multiple structural abnormalities (9). Monosomy or longarm deletions of chromosome 5 and/or 7 occur most frequently in various studies (7,11,25). The karyotype demonstrated in the current case is characteristic. These two chromosomes are most frequently associated with myelodysplastic syndromes, which may precede the development of M6.

Cuneo et al. (11) divide M6 cases into two groups: Those with three or more cytogenetic abnormalities are designated major karyotype aberrations (MAKA), and those with a single abnormality are designated minor karyotype aberrations (MIKA). The MAKA group is always associated with increased immature erythroid precursors, and the MIKA group with preserved maturation of erythroid cells. The MAKA group has lower hemoglobin levels, lower complete remission rates, and shorter survival than the MIKA group (11). Apparently, this cytogenetic-cytopathologic classification is of prognostic significance. Mazzella et al. (7) found that 8 of 16 M6a cases had a normal karyotype, 4 had MIKA, and 4 had MAKA, whereas 10 of 11 M6b cases had MAKA.

In a case of M6 with monosomy 7, fluorescence in situ hybridization identified the same clonal abnormality in both erythroid and myeloid lineage, and the normal erythroid population coexisted with the leukemic erythroid population (26). These findings substantiate the theory that M6 is a clonal disorder arising from a multipotent
stem cell. Multidrug resistance gene expression and p53 gene mutation were demonstrated in all subtypes of M6, but more frequently in M6b and M6c than in M6a (2).


TABLE 6.11.1


Salient Features for Laboratory Diagnosis of M6


1.


M6a: Presence of ≥50% of normoblasts among all nucleated cells and ≥20% of myeloblasts among nonerythroid cells in the bone marrow


2.


M6b: Presence of ≥80% immature erythroid precursors with no significant myeloblast component


3.


Positive periodic acid-Schiff staining in mature and immature nucleated erythroid cells


4.


Glycophorin-A and hemoglobin-A staining by immunohistochemistry and glycophorin-A positivity by flow cytometry


5.


Myeloblasts in M6a cases show myeloid markers (e.g., CD13, CD33) and immature cell markers (CD34 and CD117).


6.


Complex abnormal karyotypes in most cases, with frequent -5/5q- and -7/7q-


The salient features for laboratory diagnosis of M6 are summarized in Table 6.11.1.


Clinical Manifestations

Clinically, the presenting symptoms are usually associated with severe anemia. M6 cases have the lowest hemoglobin level and leukocyte and platelet counts, compared with other subtypes of AML, partly because M6 is often preceded by a myelodysplastic syndrome (27). Although nucleated red blood cells are frequently present, pronormoblasts are seldom detected in the peripheral blood (12). Hepatosplenomegaly and lymphadenopathy occur in <25% of patients (27).

M6 is often seen in elderly persons, but a subset of younger patients with better clinical outcome has been found in one study (12). Congenital, familial erythroleukemia or erythroleukemia of infancy and childhood have been occasionally reported (28, 29, 30 and 31). M6 may also be presented as a blastic crisis of a myeloproliferative disorder, such as chronic myelogenous leukemia or polycythemia vera (2,5,32).

In a study by Mazzella et al. (7), the increase of proliferation markers (proliferating cell nuclear antigen [PCNA] and Ki-67) correlated positively with pronormoblast count and multiple cytogenetic abnormalities and inversely with survival and erythroid lineage maturation. They also found that patients with increased numbers of myeloblasts and few pronormoblasts had the best prognosis, whereas survival rapidly declined with decreasing myeloblast counts. Accordingly, the authors suggested that chemotherapy for M6 should be directed toward both myeloblasts and pronormoblasts to replace the current regimens that do not affect pronormoblasts.

Therapeutic effects also depend on disease status at presentation. In 19 de novo cases of M6, the remission rate after induction chemotherapy was 95% and the relapse rate was 35%, whereas 8 cases with secondary M6 had a remission rate of 57% and a relapse rate of 75% (33). The reported median survival for M6 varies from 4 to 14 months (34). With autologous hematopoietic stem cell transplantation, the leukemia-free survival (LFS) was 26% ± 5% at 5 years, whereas the LFS was 57% ± 5% for allogeneic hematopoietic stem cell transplantation (34).


REFERENCES

1. Bain BJ. Historical review: Di Guglielmo and his syndromes. Br J Haematol. 2003;120:939-943.

2. Mazzella FM, Alvares C, Kowal-Vern A, et al. The acute erythroleukemias. Clin Lab Med. 2000;20:119-137.

3. Bennett JM, Catovsky D, Daniel MT, et al. Proposed revised criteria for the classification of acute myeloid leukemia: a report of the French-American-British Cooperative Group. Ann Intern Med. 1985;103:626-629.

4. Kowal-Vern A, Cotelingam J, Schumacher HR. The prognostic significance of proerythroblasts in acute erythroleukemia. Am J Clin Pathol. 1992;98:34-40.

5. Garand R, Duchayne E, Blanchard D, et al. Minimally differentiated erythroleukemia (AML M6 ‘variant’): a rare subset of AML distinct from AML M6. Groupe Francais d’Hematologie cellulaire. Br J Haematol. 1995;90:868-875.

6. Hasserjian RP, Howard, J, Wood A, et al. Acute erythremic myelosis (true erythroleukaemia): a variant of AML FAB-M6. J Clin Pathol. 2001;54:205-209.

7. Mazzella FM, Kowal-Vern A, Shrit A, et al. Acute erythroleukemia: evaluation of 48 cases with reference to classification, cell proliferation, cytogenetic, and prognosis. Am J Clin Pathol. 1998;110:590-598.

8. Brunning RD. Acute myeloid leukemia. In: Knowles DM, ed. Neoplastic Hematopathology. 2nd ed. Philadelphia: Lippincott Williams & Wilkins; 2001:1667-1715.

9. Brunning RD, Matutes E, Flandrin G, et al. Acute myeloid leukaemia not otherwise categorized. In: Jaffe ES, Harris NL, Stein H, Vardiman JW, eds. Pathology and Genetics of Tumours of Haematopoietic and Lymphoid Tissues. Lyon, France: IARC Press; 2001:91-105.

10. Vardiman JW, Harris NL, Brunning RD. The World Health Organization (WHO) classification of the myeloid neoplasms. Blood. 2002;100:2292-2302.

11. Cuneo A, Van Orshoven A, Michaux JL, et al. Morphologic, immunologic and cytogenetic studies in erythroleukemia: evidence for multilineage involvement and identification of two distinct cytogenetic-clinicopathological types. Br J Haematol. 1990;75:346-354.

12. Arkinson J, Hrisinko MA, Weil SC. Erythroleukemia: a review of 15 cases meeting 1985 FAB criteria and survey of the literature. Blood Rev. 1992;6:204-214.

13. Selby DM, Valdez R, Schnitzer B, et al. Diagnostic criteria for acute erythroleukemia. Blood. 2003;101:2895-2896.

14. Li CY, Yam LT, Sun T. Modern Modalities for the Diagnosis of Hematologic Neoplasms. New York: Igaku-Shoin; 1996:13.

15. Villeval JL, Cramer P, Lemonine F, et al. Phenotype of early erythroblastic leukemia. Blood. 1986;68:1167-1173.

16. Solberg LA, Oles KJ, Kimlinger TK, et al. A new murine monoclonal antibody for the diagnosis of erythroleukemia. Am J Clin Pathol. 1990;93:387-390.

17. Edelman P, Vinci G, Villeval JL, et al. A monoclonal antibody against an erythrocyte ontogenic antigen identifies fetal and adult progenitors. Blood. 1986;67:56-63.


18. Gupta AS, Dhond SR. Phenotypic heterogeneity of erythroblasts in erythroblastic leukemia revealed by monoclonal antibodies. Am J Hematol. 1998;29:12-17.

19. Yokochi T, Brice M, Rabinovith PS, et al. Monoclonal antibodies detecting antigenic determinants with restricted expression on erythroid cells from the erythroid committed progenitor levels to the mature erythroblast. Blood. 1984;63:1376-1484.

20. Ngyyen AN, Milam JD, Johnson KA, et al. A relational database for diagnosis of hematopoietic neoplasms using immunophenotyping by flow cytometry. Am J Clin Pathol. 2000;113:95-106.

21. Greaves MF, Sieff C, Edward PAW. Monoclonal antiglycoprotein as a probe for erythroleukemias. Blood. 1983;61: 645-651.

22. Edward PAW. Monoclonal antibodies that bind to the human erythrocyte membrane glycoproteins glycophorin A and band 3. Biochem Soc Trans. 1980;8: 334-336.

23. Ferraris AM, Canepa L, Mareni C, et al. Re-expression of normal stem cells in erythroleukemia during remission. Blood. 1983;62:177-179.

24. Long MW, Heffner CH, Williams JL, et al. Regulation of megakaryocyte phenotype in human erythroleukemia cells. J Clin Invest. 1990;85:1072-1084.

25. Rowley JD, Alimena G, Garson DM, et al. A collaborative study of the relationship of the morphological type of acute nonlymphocytic leukemia with patient age and karyotype. Blood. 1982;59:1013-1022.

26. Wong KF, Chu YC, Kwong YL. Abnormal erythropoiesis in erythroleukemia: a fluorescence in situ hybridization study. Cancer Genet Cytogenet. 1998;105:187-189.

27. Peterson BA, Levine EG. Uncommon subtypes of acute nonlymphocytic leukemia: clinical features and management of FAB M5, M6, and M7. Semin Oncol. 1987;14:425-434.

28. Allen RR, Wadsworth LD, Kalousek DK, et al. Congenital erythroleukemia: a case report with morphological, immunophenotypic and cytogenetic findings. Am J Hematol. 1989;31:114-121.

29. Hadjiyannakis A, Fletcher WA, Lebrun DP. Congenital erythroleukemia in a neonate with severe hypoxic ischemic encephalopathy. Am J Perinatol. 1998;30:395-401.

30. Novik Y, Marino P, Makower DF, et al. Familial erythroleukemia: a distinct clinical and genetic type of familial leukemias. Leuk Lymphoma. 1998;30:395-401.

31. Malkin D, Freedman MH. Childhood erythroleukemia: review of clinical and biological features. Am J Pediatr Hematol Oncol. 1989;11:348-359.

32. McFarlane R, Sun T. Detection of BCR/ABL fusion product in normoblasts in a case of chronic myelogenous leukemia. Am J Surg Pathol. 2004;28:1240-1244.

33. Killick S, Matutes E, Powles RL, et al. Acute erythroid leukemia (M6): outcome of bone marrow transplantation. Leuk Lymphoma. 1999;35:99-107.

34. Fouillard L, Labopin M, Gorin NC, et al. Hematopoietic stem cell transplantation for de novo erythroleukemia: a study of the European Group for Blood and Marrow Transplantation (EBMT). Blood. 2002;100:3135-3140.


CASE 12 Acute Megakaryoblastic Leukemia


CASE HISTORY

A 48-year-old man presented with fatigue and night sweats for 2 weeks. The patient was previously in good health and went to donate blood in the hospital, just to find out that he had a low leukocyte count. Since then he noticed low-grade fever and night sweats. Upon consulting his primary care physician, he was found to have pancytopenia. He further developed symptoms of dyspnea on exertion while walking up stairs or playing with his children. The patient was referred to a hematologist who admitted him to the hospital for further evaluation.

Physical examination on admission was unremarkable except for the presence of petechiae on his left and right anterior shins. He had no lymphadenopathy or hepatosplenomegaly. Laboratory examination of the peripheral blood showed a total leukocyte count of 1,900/µL, hematocrit of 14.6%, hemoglobin of 4.9 g/dL, and platelet count of 23,000/µL. The differential count revealed 71.1% lymphocytes, 24.3% neutrophils, and 2.3% monocytes, but no immature leukocytes were found.

After admission, a bone marrow biopsy was performed. It revealed 90% cellularity with many megakaryocytes of varying size and shape, which stained positive for CD42b. The bone marrow aspirate showed 52% blasts; many of them had cytoplasmic blebs.

A diagnosis of acute megakaryoblastic leukemia (AMKL; French-American-British [FAB] classification acute myeloid leukemia [AML]-M7) was established, and induction chemotherapy was started with ARA-C and daunomycin. During the course of treatment, the patient developed neutropenic fever and diarrhea associated with chemotherapy. However, his condition was under control after antibiotic treatment. A repeat bone marrow biopsy showed complete remission, and he was discharged 1 month after admission.

Subsequently, the patient went through multiple cycles of consolidation and salvage therapy, but leukemia relapsed 2 months after the first admission. During this course, he had multiple episodes of neutropenic fever, pulmonary and hepatic aspergillosis, Staphylococcus B bacteremia, and Clostridium difficile colonization. Although the infections were treated successfully with various regimens of antibiotics, his leukemia became refractory to chemotherapy. Many blasts finally appeared in the peripheral blood, and the patient died 1 year after the initial diagnosis of M7.


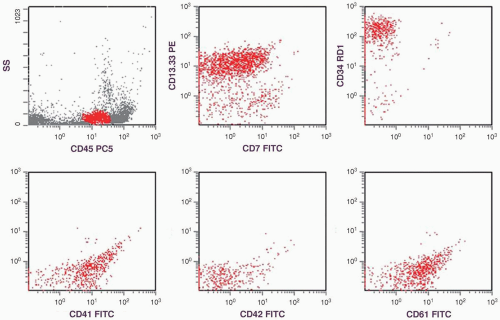
FIGURE 6.12.1 Flow cytometric analysis shows positive CD13.CD33, partially positive CD7, and positive CD34 reactions. The diagnostic feature is the expression of the immature megakaryocyte markers (CD41 and CD61) with low percentage or negative reaction of the mature megakaryocytic marker (CD42). SS, side scatter; PC5, phycoerythrin cyanin 5; PE, phycoerythrin; RD1, rhodamine; FITC, fluorescein isothiocyanate.


FLOW CYTOMETRY FINDINGS

The bone marrow showed 0% myeloperoxidase (MPO), 91% CD13-CD33, 42% CD13-CD33/CD7, 82% CD41, 0% CD42, 75% CD61, 76% CD34, 0% terminal deoxynucleotidyl transferase (TdT), 5% glycophorin A, and 0% CD14 (Fig. 6.12.1).


CYTOCHEMICAL FINDINGS

The leukemic cells in the bone marrow were negative for MPO and α-naphthyl butyrate esterase but positive for periodic acid-Schiff (PAS) stains. The PAS stain showed a typical peripheral pattern with strong staining in the cytoplasmic blebs.


DISCUSSION

AMKL is a rare disease with a bimodal age distribution. The incidence of AMKL differs in various age groups. It accounts for 1% to 10% of AML in adults, 3.1% to 10% in childhood AML, and about 20% in AML of infants (1, 2, 3 and 4). The incidence of AMKL in children with Down syndrome (DS) is estimated to be approximately 500 times greater than that in children without this syndrome (5). There is evidence to indicate that AMKL in these various groups of patients may be biologically different, as they differ in cytogenetic profile and prognosis (6).

AMKL is classified as AML-M7 in the FAB system (7). Its diagnostic criterion is the presence of ≥30% megakaryoblasts in the bone marrow. In the World Health Organization (WHO) classification, the requirement for the blast count is reduced to 20%, but more than one half of the blasts should be identified as of megakaryocytic lineage (8,9). This system also includes the transient myeloproliferative disorder in DS as a variant of AMKL (9).

In contrast to criteria for other subtypes of AML, the FAB scheme requires the identification of megakaryocytic cells not only by morphology but also by either the platelet peroxidase reaction on electron microscopy or staining with monoclonal or polyclonal platelet specific antibodies. Because myelofibrosis or increased bone marrow reticulin is a common finding in patients with AMKL, satisfactory bone marrow aspirate may be difficult to obtain and characteristic megakaryoblasts are difficult to find. In those cases, a diagnosis of AMKL is allowed on the estimation of the number of blasts in the bone marrow biopsy (7,9).
Under this condition, unequivocal megakaryoblasts should be identified in the peripheral blood and/or bone marrow by immunologic techniques (7).


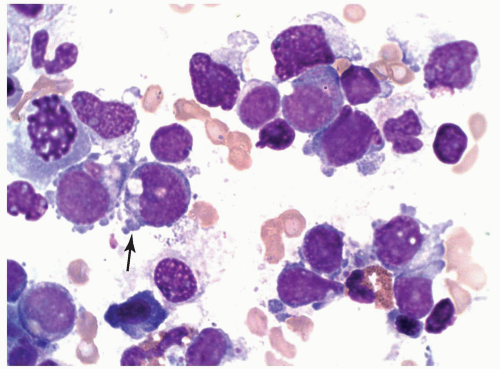
FIGURE 6.12.2 Bone marrow aspirate shows a cluster of megakaryoblasts of varying sizes. Large cells show moderate amount of basophilic cytoplasm with irregular cell border or budding (arrow). Chromatin is dispersed and nucleoli are present. Small cells, in contrast, reveal scanty cytoplasm and dense chromatin, resembling lymphoblasts. Wright-Giemsa, 100× magnification.


Morphology and Cytochemistry

The morphology of megakaryoblasts is highly polymorphic. They may appear as small round cells with scanty cytoplasm and dense chromatin, resembling lymphoblasts, or as larger cells with a fine chromatin pattern and prominent nucleoli (Figs. 6.12.2 and 6.12.3) (1,7,10). The large-cell type usually has a moderate amount of basophilic cytoplasm with or without azurophilic granules. The most specific morphologic feature is the presence of cytoplasmic blebs (budding), which represents the process of platelet shedding from the cell surface. However, the real process is seen only in mature megakaryocytes. Cytoplasmic blebs, nevertheless, can be an artifact seen in other subtypes of AML and is thus not pathognomonic for AMKL.


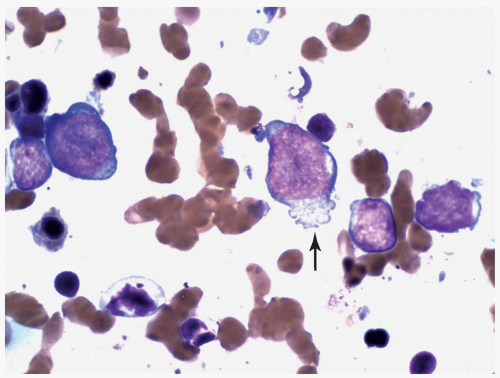
FIGURE 6.12.3 Bone marrow touch imprint shows two large and two small megakaryoblasts. Cytoplasmic projection is clearly visible in the large blasts (arrow). Wright-Giemsa, 100× magnification.


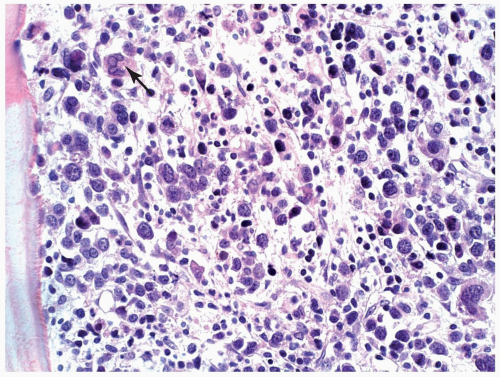
FIGURE 6.12.4 Bone marrow biopsy shows total replacement of the normal hematopoietic cells by megakaryoblasts and a few large megakaryocytes (arrow). Marked variation in size of the blasts distinguishes megakaryoblasts from other blasts. Hematoxylin and eosin, 40× magnification.

Megakaryoblasts may be difficult to identify in bone marrow biopsy, but their presence is usually suggested by the accompanying megakaryocytes and reticular fibrosis (Figs. 6.12.4 and 6.12.5). The megakaryocytes are frequently smaller than normal megakaryocytes, about
7 to 10 µm in diameter, hypolobated, or mononucleated (11). These megakaryocytes are often referred to as micromegakaryocytes or dwarf megakaryocytes. They may be present singly or forming small or large clusters. A reticulin fiber network usually surrounds the mature megakaryocytes, but prominent fibrosis may not be present, especially in cases where immature megakaryoblasts are predominant.


FIGURE 6.12.5 Bone marrow biopsy in a case of M7 with relapse shows a cluster of leukemic cells (arrow) on a fibrotic background. Hematoxylin and eosin, 10× magnification.


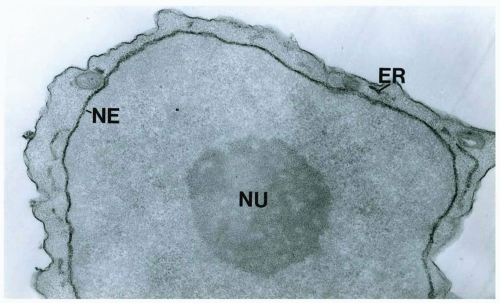
FIGURE 6.12.6 Electron micrograph of a megakaryoblast in a case of M7 leukemia, showing platelet peroxidase activity in the endoplasmic reticulum (ER) including the nuclear envelope (NE). Note the prominent nucleolus (NU) in the nucleus. 30,000× magnification. (Courtesy of Dr. Saul Teichberg, North Shore University Hospital, New York.)

In equivocal cases, electron microscopic identification of platelet peroxidase can be helpful. The platelet peroxidase appears earlier than other platelet antigens as identified by other monoclonal or polyclonal antibodies, discussed later (12). In megakaryocytes and megakaryoblasts, the peroxidase reaction is localized on the nuclear membrane and the endoplasmic reticulum, whereas the reaction in myeloblasts mainly occurs in the Golgi area and cytoplasmic granules (Figs. 6.12.6 and 6.12.7) (7).

In cases with a dry tap, the enumeration of the percentage of megakaryoblasts is impossible and the blast count depends on a rough estimation in the core biopsy. Under this condition, many similar diseases should be carefully excluded, such as myelodysplastic syndromes, acute panmyelosis with fibrosis, idiopathic myelofibrosis, or other subtypes of AML before or after treatment (13,14). In these diseases, megakaryocytes are a reactive component that may become dysplastic, mimicking malignant cells. The distinction of these entities with AMKL requires multiparameter studies. For instance, a recent comparative study of acute panmyelosis with myelofibrosis and AMKL found that the former is characterized by a multilineage myeloid proliferation, smaller blast population, and infrequent expression of megakaryocytic antigen (15). Making the matter more complicated is the fact that these diseases can transform into each other. A case report of chronic idiopathic myelofibrosis transformed into AMKL is a good example (16). In contrast, AMKL with t(1;22) in an infant may be mistaken as metastatic neuroblastoma (9). Cuneo et al. (17) used 20% platelet antigen-positive cells as a cutoff point to distinguish AMKL from other disorders containing megakaryocytic elements.


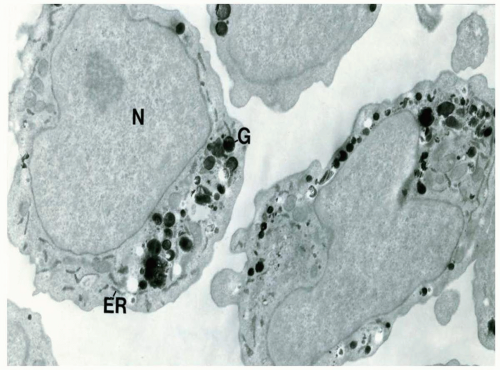
FIGURE 6.12.7 Electron micrograph of a myeloblast showing myeloperoxidase activity in many secretory granules (G) but also in the endoplasmic reticulum (ER) including the nuclear envelope. Note the immature nucleus (N) with a prominent nucleolus in one cell. 11,500× magnification. (Courtesy of Dr. Saul Teichberg, North Shore University Hospital, New York.)

Cytochemical stains are characteristic in the constant absence of MPO and Sudan black B stains but in the presence of PAS (Fig. 6.12.8) and acid phosphatase (18,19). The PAS stain is typical in a peripheral staining pattern with prominent staining of the cytoplasmic blebs (19). The reactions of various nonspecific esterases differ: α-naphthyl butyrate esterase is negative but α-naphthyl acetate esterase and naphthol AS-D acetate esterase are positive, with focal staining in megakaryoblasts.


Immunophenotype

The monoclonal antibodies most commonly used for the identification of megakaryocytes are CD41, CD42, and CD61
(1, 2 and 3,8,13,20). Recently, CD36 has been included in the megakaryocytic profile (4,9). In paraffin sections, factor VIII antibody was frequently used to identify megakaryocytes, but factor VIII may not be present on the leukemic cells in all patients with AMKL (12). Currently, CD42b and CD61 antibodies are available for immunohistochemical staining and provide a more specific identification (9).


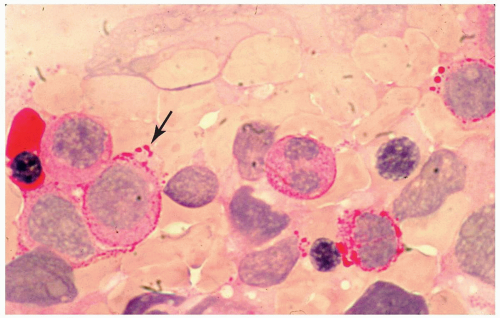
FIGURE 6.12.8 Bone marrow aspirate with periodic acid-Schiff stain shows a peripheral staining pattern with accentuation in cytoplasmic blebs (arrow). 100× magnification.


FIGURE 6.12.9 Bone marrow biopsy from a patient with acute myeloblastic leukemia shows extensive megakaryocytic reaction. Hematoxylin and eosin, 20× magnification.

A note of caution: Platelets frequently adhere to myeloblasts and cause falsely high percentages of CD41, CD42, and CD61 (21). Therefore, the study of cytoplasmic platelet antigens may avoid this problem (9). Some studies mentioned that CD42 is positive in mature platelets but negative in some cases of immature megakaryoblasts (13,22,23); thus, the presence of a low percentage of CD42 as compared to CD41 and CD61 may be a clue to the diagnosis of AMKL. In addition, megakaryocytic reaction is occasionally seen in other subtypes of acute leukemias (Fig. 6.12.9), leading to the demonstration of high percentages of CD41/CD42/CD61-positive populations by flow cytometry.

For myelomonocytic antigens, CD33 is frequently positive, but MPO, CD13, CD14, and CD15 are usually negative (2,19,24, 25 and 26). CD34, a hematopoietic progenitor cell antigen, and CD56, a neural cell adhesion molecule and natural killer cell marker, are frequently expressed on megakaryoblasts (12,19,25, 26, 27 and 28). The expression of HLA-DR is variable (2,18,19). Glycophorin A has been detected in 18% of 41 cases of pediatric AMKL at St. Jude Children’s Research Hospital (4).

For lymphoid markers, the B-cell markers (CD19, CD79a, CD10, and CD20) are generally negative (2,19,24,25). The expression of T-cell markers is selective: CD2 and CD7 are often positive, but CD3 and CD5 are usually negative (4,9,18).

In the current case, the diagnosis was based on the demonstration of typical morphology in some of the megakaryoblasts in the bone marrow aspirate. This diagnosis was further confirmed by the flow cytometric study that demonstrated positive reactions in all three megakaryocytic antigens with a much lower percentage of CD42 than of CD41 and CD61. The bone marrow biopsy showed total replacement of normal hematopoietic cells by the small mononucleated megakaryoblasts with scattered megakaryocytes in various degrees of maturation. Myelofibrosis appeared only after chemotherapy. Immunohistochemical stains in bone marrow core biopsy demonstrated CD42b on the relatively mature megakaryocytes, but not on megakaryoblasts. However, when the patient was in remission, CD42b was not demonstrated in the fibrotic bone marrow. The PAS stain also played a role in the early diagnosis of this case by demonstrating the surface staining pattern on the megakaryoblasts.


FIGURE 6.12.10 Bone marrow biopsy with CD42b staining shows positive stain in the relatively mature megakaryocytes/megakaryoblasts. Myeloperoxidase, 40× magnification.


Comparison of Flow Cytometry and Immunohistochemistry

Flow cytometry is able to identify three megakaryocytic antigens, CD41, CD42, and CD61. The discrepancy between CD42 and the other two markers is helpful in establishing the diagnosis. In immunohistochemistry, the use of CD42b and CD61 may directly identify the megakaryocytes, but the former only identifies the mature cells and not the blastic cells (Fig. 6.12.10). CD61 staining, in contrast, is affected by the fixation procedure and decalcification (9). Factor VIII staining may be used to supplement CD42b and CD61 in achieving the diagnosis.


Molecular Genetics

As trilineage myelodysplasia is frequently coexistent with de novo AMKL and many of the chromosome aberrations in AMKL are shared by other myeloid neoplasms, this leukemia appears to be derived from a multipotent stem cell (25). The cytogenetic abnormalities are also shared with myelodysplastic syndrome, and dysgranulopoiesis is seen in one third of the pediatric AMKL cases in one study (6). These findings suggest that AMKL may often be a secondary leukemia. Some studies also suggested that megakaryocytes may share a common progenitor cell with erythrocytes (5,26,29).


Cytogenetic analyses have been conducted in many studies of AMKL (3,19,24,25,30,31), but no cytogenetic profile has emerged as a specific marker. By summarizing 31 cases in the literature in addition to their own 15 cases, Cuneo et al. (25) found that -7/7q- and -5/5q- are the most common abnormalities. A more recent French study found AMKL to be characterized by a higher incidence of abnormalities, a higher complexity of karyotypes, and a different distribution of abnormalities among children and adults (6). This study divided AMKL cases into nine cytogenetic groups: (i) normal karyotypes, (ii) patients with DS, (iii) numeric abnormalities only, (iv) t(1;22)(p13;q13), (v) t(9;22)(q34;q11), (vi) 3q21q26, (vii) -5/del(5q) or -7/del(7q) or both, (viii) i(12)(p10), and (ix) other structural changes. Whereas groups 1, 2, 3, and 4 were exclusively seen in children, groups 5, 6, 7, and 8 were mainly seen in adults (6).

Lu et al. (32) found that pediatric patients with DS and those without differ in the karyotypes. In patients with DS, 10 of 43 cases showed no additional cytogenetic abnormalities besides trisomy 21. Most of the patients without DS showed aberrations of chromosome 22, including 16 cases with t(1;22) (q13;q13) and 6 cases with 22q13 translocation variants. The remaining non-DS patients showed frequent cytogenetic changes, including rearrangement of 3q21, 3q26-27, trisomy 21, and other specific changes.

The karyotype aberration t(1;22) has been exclusively reported in pediatric cases; most patients were younger than 12 months (3,19,31,33). This translocation is estimated to be present in 30% of pediatric patients and in >65% of infants with AMKL (34). This translocation is of special interest because it involves two oncogenes and because of its association with myelofibrosis. The N-ras oncogene is located in the breakpoint 1p13, and it may be activated as a consequence of translocation leading to malignant transformation of megakaryocytes (19). The c-sis oncogene is located at chromosome 22q13. A marked increase in c-sis messenger RNA in leukemic cells has been reported in two AMKL cases (35,36). The c-sis gene encodes platelet-derived growth factor B, which plays an important role in the occurrence of myelofibrosis. Recently, however, OTT (RBM15) and MAL (MLK1) genes have been found in 1p13 and 22q13, respectively (37,38). The OTT-MAL fusion transcript can be identified with molecular biology techniques in karyotypically cryptic cases (6). Patients with t(1;22) have a worse prognosis than do those AMKL cases without this translocation because of their poor response to chemotherapy. Therefore, autologous bone marrow transplantation is the therapy of choice, particularly for this group of patients (3).

In AMKL cases with DS, mutation in the gene for globin transcription factor 1 (GATA-1) has been implicated as a major mechanism for leukemogenesis (39). GATA-1 is a transcription factor that is essential for normal megakaryocytopoiesis. Absence of GATA-1 promotes accumulation of immature megakaryocytes. Acquired mutations in GATA-1 have been detected in the vast majority of AMKL patients with DS and in almost all cases of transient myeloproliferative disorder (39).


TABLE 6.1 2.1


Salient Features for Laboratory Diagnosis of Acute Megakaryoblastic Leukemia


1.


Presence of ≥20% megakaryoblasts in bone marrow aspirate


2.


If bone marrow aspirate is not successful, bone marrow biopsy identification of immature leukemic cell infiltration and immunologic identification of megakaryocytes in blood or bone marrow are required.


3.


Flow cytometry shows high percentages of CD41 and CD61 but low percentage of CD42b.


4.


Immunohistochemical stains including CD42b, CD61, and factor VIII are available.


5.


Electron microscopic identification of platelet peroxidase in leukemic cells


6.


A peripheral periodic acid-Schiff staining pattern or staining of the blebs on the blasts


7.


t(1;22)(p13;q13) is specific for infantile megakaryoblastic leukemia.


The salient features for laboratory diagnosis of AMKL are summarized in Table 6.12.1.


Clinical Manifestations

As mentioned before, AMKL can be seen in different age groups that may have biological, cytogenetic, and prognostic differences. In adults, AMKL is frequently secondary to chemotherapy, to leukemic transformation of either myelofibrosis or myelodysplastic syndrome, or as megakaryoblastic crisis of chronic myelogenous leukemia (3,7,27). In contrast, AMKL in children generally appears de novo (2).

Children with DS have a 10- to 20-fold increased risk for the development of acute leukemia (23), especially AMKL (25,40,41). In this group of patients, AMKL accounts for approximately 50% of acute leukemia and is frequently preceded by transient leukemia 1 to 4 years earlier (5). In a study of 20 children with DS in Japan, 14 had AMKL and all were younger than 3 years (20). Therefore, the possibility of an association between trisomy 21 and AMKL has been raised. However, trisomy 21 does not frequently appear in AMKL leukemic cells when the patient has a normal constitutional karyotype (20). In contrast, patients with transient leukemia and those with subsequent development to AMKL all have trisomy 21 in their leukemic cells (28). In those patients, if they do not have DS, they may have trisomy 21 mosaicism with a normal karyotype. Because the same cytogenetic abnormalities in addition to trisomy 21 in the leukemic cells of transient leukemia are also found in the leukemic cells of subsequent AMKL, it is suggested that AMKL in these patients arises from transient leukemic cells (28).

Clinically, the patient may have fatigue, weakness, fever, bleeding, ecchymosis, and petechiae, but lymphadenopathy and hepatosplenomegaly are seldom seen
(1,42). However, pediatric patients with t(1;22) may often have organomegaly (34). Patients with AMKL are usually anemic and thrombocytopenic. The leukocyte count may be low at the beginning of the disease, but an abrupt and rapid increase in the number of peripheral blasts is frequently seen in the terminal stage. The platelet aggregation responses may be impaired, and serum lactate dehydrogenase levels are frequently elevated. Bilateral symmetrical periostitis and osteolytic lesions have been observed in children (43).

Some clinical symptoms are defined by cytogenetic aberrations. For instance, patients with t(1;22) translocation have very early onset of AMKL with organomegaly but have no history of transient leukemia and myelodysplastic syndrome (33). Patients with the 3q21 aberration often have a secondary leukemia with weakness, anemia, CD34+ blasts, marked dysmorphic megakaryoblasts, normal or increased platelet counts, and very poor response to chemotherapy (44,45).

AMKL may be coexistent with other leukemias. A spontaneous and simultaneous occurrence of multiple myeloma and AMKL in a case of polycythemia vera has been reported (46). Another case report described coexistence of acute megakaryoblastic and B-lymphoblastic mixed blast crisis of chronic myeloid leukemia with chronic lymphocytic leukemia (47).

AMKL cases usually have a rapidly progressive course. All patients without treatment die within 1 year. At St. Jude Children’s Research Hospital, the 2-year event-free survival in patients with DS is 83%, whereas it is 14% for pediatric cases with de novo AMKL and 20% for cases with secondary AMKL (4). Allogeneic transplantation during remission offers the best chance of cure in this hospital.


REFERENCES

1. Matsuo T, Bennett JM. Nonlymphocytic leukemias and myelodysplastic syndromes. Acute leukemia of megakaryocyte lineage (M7). Cancer Genet Cytogenet. 1988;34:1-3.

2. San Miguel JF, Gonzalez M, Canizo MC, et al. Leukemia with megakaryoblastic involvement. Clinical, hematologic and immunologic characteristics. Blood. 1988;72:402-407.

3. Lion T, Haas OA, Harbott J, et al. The translocation t(1;22) (p13;q13) is a non-random marker specifically associated with acute megakaryocytic leukemia in young children. Blood. 1992;79:3325-3330.

4. Athale UH, Razzouk BI, Raimondi SC, et al. Biology and outcome of childhood acute megakaryoblastic leukemia: a single institution’s experience. Blood. 2001;97: 3727-3732.

5. Zipursky A, Poon A, Doyle J. Leukemia in Down’s syndrome. A review. Pediatr Hematol Oncol. 1992;9:139-149.

6. Dustugue N, Lafage-Pochitaloff M, Pages MP, et al. Cytogenetic profile of childhood and adult megakaryoblastic leukemia (M7): a study of the Groupe Francais de Cytogenetique Hematologique (GFCH). Blood. 2002;100: 618-626.

7. Bennett JM, Catovsky D, Daniel MT, et al. Criteria for the diagnosis of acute leukemia of megakaryocyte lineage (M7). A report of the French-American-British Cooperative Group. Ann Intern Med. 1985;103:460-462.

8. Brunning RD. Acute myeloid leukemia. In: Knowles DM, ed. Neoplastic Hematopathology. 2nd ed. Philadelphia: Lippincott Williams & Wilkins; 2001:1667-1715.

9. Brunning RD, Matutes E, Flandrin G, et al. Acute myeloid leukaemia not otherwise categorized. In: Jaffe ES, Harris NL, Stein H, Vardiman JW, eds. Tumours of Haematopoietic and Lymphoid Tissues. Lyon, France: IARC Press; 2001:91-105.

10. Gassmann W, Loffler H. Acute megakaryoblastic leukemia. Leuk Lymphoma. 1995;18(suppl 1):69-73.

11. Brunning RD, McKenna RW. Tumours of the Bone Marrow. Armed Forces Institute of Pathology (AFIP) Fascicle 9, 3rd series. Washington, DC: AFIP; 1994:77-85.

12. Koike T, Aoki S, Maruyama S, et al. Cell surface phenotyping of megakaryoblasts. Blood. 1987;69:957-960.

13. Bloomfield CD, Brunning RD. FAB M7. Acute megakaryoblastic leukemia-beyond morphology. Ann Intern Med. 1985;103:450-452.

14. Rosenthal NS, Farhi DC. Dysmegakaryopoiesis resembling acute megakaryoblastic leukemia in treated acute myeloid leukemia. Am J Clin Pathol. 1991;95:556-560.

15. Orazi A, O’Malley DP, Jiang J, et al. Acute panmyelosis with myelofibrosis: an entity distinct from acute megakaryoblastic leukemia. Mod Pathol. 2005;18:603-614.

16. Hirose Y, Masaki Y, Shimoyama K, et al. Granulocytic sarcoma of megakaryoblastic differentiation in the lymph nodes terminating as acute megakaryoblastic leukemia in a case of chronic idiopathic myelofibrosis persisting for 16 years. Eur J Haematol. 2001;67:194-198.

17. Cuneo A, Mecucci C, Kerin S, et al. Multipotent stem cell involvement in megakaryoblastic leukemia. Cytologic and cytogenetic evidence in 15 patients. Blood. 1989;74: 1781-1790.

18. Tallman MS, Neuberg D, Bennett JM, et al. Acute megaloblastic leukemia. The Eastern Cooperative Oncology Group experience. Blood. 2000;96:2405-2411.

19. Washio S, Ido M, Azuma E, et al. Acute megakaryoblastic leukemia with translocation t(1;22)(p13;q13) in a 10-week-old infant. Am J Hematol. 1992;39:56-60.

20. Kojima S, Matsuyama T, Sato T, et al. Down’s syndrome and acute leukemia in children. An analysis of phenotype by use of monoclonal antibodies and electron microscopic platelet peroxidase reaction. Blood. 1990;76:2348-2353.

21. Betz SA, Foucar K, Head D, et al. False positive flow cytometric platelet glycoprotein IIb/IIIa expression in myeloid leukemias secondary to platelet adherence to blasts. Blood. 1992;79:2399-2403.

22. Borowitz MJ, Bray R, Gascoyne R, et al. U.S.-Canadian consensus recommendations in the immunophenotypic analysis of hematologic neoplasia by flow cytometry. Data analysis and interpretation. Cytometry. 1997;30:236-244.

23. Fong C, Brodeur GM. Down’s syndrome and leukemia. Epidemiology, genetics, cytogenetics and mechanisms of leukemogenesis. Cancer Genet Cytogenet. 1987;28:55-76.

24. Slav I, Urban C, Haas OA, et al. Acute megakaryocytic leukemia in children. Clinical, immunologic and cytogenetic findings in two patients. Cancer. 1991;68:2266-2272.

25. Cuneo A, Mecucci C, Kerin S, et al. Multipotent stem cell involvement in megakaryoblastic leukemia. Cytologic and cytogenetic evidence in 15 patients. Blood. 1989;74: 781-1790.

26. Cripe LD, Hromas R. Malignant disorders of megakaryocytes. Semin Hematol. 998;35:200-209.

27. Ikushima S, Yoshihara T, Matsumura T, et al. Expression of CD56/NCAM in hematopoietic malignant cells. A usual marker for acute monocytic and megakaryocytic leukemias. Int J Hematol. 1991;54:395-403.


28. Zipursky A. Transient leukaemia-A benign form of leukaemia in newborn infants with trisomy 21. Br J Haematol. 2001;120: 930-938.

29. Ito E, Kasai M, Toki T, et al. Expression of erythroid-specific genes in megakaryoblastic disorders. Leuk Lymphoma. 1996;23:545-550.

30. Sait SNJ, Brecher ML, Green DM, et al. Translocation t(1;22) in congenital acute megakaryocytic leukemia. Cancer Genet Cytogenet. 1988;34:277-280.

31. Koller U, Haas OA, Ludwig WD, et al. Phenotypic and genotypic heterogeneity in infant acute leukemia. II. Acute non-lymphoblastic leukemia. Leukemia. 1989;3:708-714.

32. Lu G, Altman AJ, Benn PA. Review of the cytogenetic changes in acute megakaryoblastic leukemia. One disease or several? Cancer Genet Cytogenet. 1993;67:81-89.

33. Bernstein J, Dastugue N, Haas OA, et al. Nineteen cases of the t(1;22)(p13;q13) acute megakaryoblastic leukemia of infants/children and a review of 39 cases: report from a t(1;22) study group. Leukemia. 2000;14:216-218.

34. Lion T, Haas OA. Acute megakaryocytic leukemia with the t(1;22)(p13;q13). Leuk Lymphoma. 1993;11:15-20.

35. Sunami S, Fuse A, Simizu B, et al. The c-sis gene expression in cells from a patient with acute megakaryoblastic leukemia with Down’s syndrome. Blood. 1987;70: 368-371.

36. Marcus RE, Hibbin JA, Matute E, et al. Megakaryoblastic transformation of myelofibrosis with expression of c-sis oncogene. Scand J Haematol. 1986;36:186-193.

37. Mercher T, Coniat MB, Monni R, et al. Involvement of a human gene related to the Drosophila spen gene in the recurrent t(1;22) translocation of acute megakaryocytic leukemia. Proc Natl Acad Sci U S A. 2001;98:5776-5779.

38. Ma Z, Morris SW, Valentine V, et al. Fusion of two novel genes, RBM15 and MKL1, in the t(1;22)(p13;q13) of acute megakaryoblastic leukemia. Nat Genet. 2001;28:220-221.

39. Gurbuxani S, Vyas P, Crispino JD. Recent insights into the mechanisms of myeloid leukemogenesis in Down syndrome. Blood. 2004;103:399-406.

40. Hayashi Y, Eguchi M, Suggita K, et al. Cytogenetic findings and clinical features in acute leukemia and transient myeloproliferative disorders in Down’s syndrome. Blood. 1989;74:1781-1790.

41. Richard G, Brody J, Sun T. A case of acute megakaryocytic leukemia with hematogones. Leukemia. 1993;7:1900-1903.

42. Peterson BA, Levine EG. Uncommon subtypes of acute nonlymphocytic leukemia. Clinical features and management of FAB M5, M6 and M7. Semin Oncol. 1987;14:425-434.

43. Athale UH, Kaste SC, Razzouk BI, et al. Skeletal manifestations of pediatric acute megakaryoblastic leukemia. J Pediatr Hematol Oncol. 2002;24:561-565.

44. Rynditch A, Schnittger S, Gardiner K. Leukemia breakpoint region in 3q21 is gene rich. Gene. 1997;193:49-57.

45. Bitter MA, Neilly ME, LeBeau MM, et al. Rearrangement of chromosome 3 involving 3q21 and 3q26 are associated with normal or elevated platelet counts in acute nonlymphocytic leukemia. Blood. 1985;66:1362-1370.

46. Terpstra WE, Meuwissen OJAT, Hagemeijer A, et al. Multiple myeloma and acute megakaryoblast leukemia in spent phase polycythemia vera. Am J Clin Pathol. 1990;94:786-790.

47. Colla S, Sammarelli G, Crugnola M, et al. Co-existence of Philadelphia chromosome positive acute megakaryoblastic and B-lymphoblastic mixed blast crisis of chronic myeloid leukemia with chronic lymphocytic leukemia. Eur J Haematol. 2004;72:361-365.


CASE 13 Myeloid Sarcoma


CASE HISTORY

A 60-year-old man presented with a 3-week history of increasing fatigue and right neck swelling. Examination of peripheral blood revealed pancytopenia. The patient was treated with antibiotics for neutropenic fever without response. He was admitted to the hospital for further evaluation.

On admission, his total leukocyte count was 9200/µL with 94% myeloblasts and 6% lymphocytes. Granulocytes were not demonstrated in the peripheral blood. The hemoglobin level was 13.9 g/dL, hematocrit 40.3%, and platelet count 57,000/µL. Physical examination showed no hepatosplenomegaly, but right cervical lymphadenopathy was noted. A lymph node biopsy and a bone marrow biopsy were performed after admission.

The patient was started on imatinib (Gleevec), which was followed by a precipitous drop in the leukocyte count from 1,500/µL to 600/µL. Within the ensuing days, the patient developed a disseminated fungal infection, renal insufficiency, and altered mental status. He subsequently died.


FLOW CYTOMETRY FINDINGS

Peripheral blood: Myeloid markers: CD13-CD33 86%, CD13-CD33/CD7 80%, CD14 0%, myeloperoxidase (MPO) 0%. Activation antigen: HLA-DR 91%. Immature cell markers: CD34 85%, CD117 66%.

Bone marrow: Myeloid markers: CD13-CD33 86%, CD13-CD33/CD7 82%, CD14 0%, MPO 0%. Activation antigen: HLA-DR 91%. Immature cell markers: CD34 85%, CD117 66%.

Lymph node biopsy: Myeloid markers: CD13-CD33: 96%, CD13-CD33/CD7 95%, CD34 80%, CD117 62% (Fig. 6.13.1).


IMMUNOHISTOCHEMICAL STAINS

The tumor cells showed a strongly positive staining for CD45 and CD43, but were negative for CD3, CD20, CD34, CD45RO, MPO chloroacetate esterase, and lysozyme.


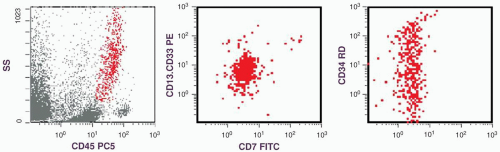
FIGURE 6.13.1 Flow cytometric analysis of a lymph node shows a large cluster of granulocytic cells (red) in the dot plot. Gated cell cluster shows a dual CD7 and CD13.CD33 staining as well as a spectrum of CD34 staining, representing mature and immature granulocytes. SS, side scatter; PC5, phycoerythrin cyanin 5; PE, phycoerythrin; FITC, fluorescein isothiocyanate.


CYTOGENETIC FINDING

Cytogenetic study showed a normal karyotype of 46,XY in the bone marrow.


DISCUSSION

Myeloid sarcoma (MS) is a solid tumor of extramedullary myeloid cells localized in soft tissues and in bones (Fig. 6.13.2). Extramedullary myeloid leukemic infiltration can be seen in acute myeloid leukemia (AML) and chronic myeloid leukemia (CML), usually found at autopsy, but as far as a tumor mass is not formed, it should not be considered as MS (1,2). This entity was first described by Burn in 1811 (3). The name of chloroma was designated by King (3) because this tumor sometimes shows a green color that fades when exposed to air. The presence or absence of the green color depends on the concentration of MPO in the tumor. By using the peroxidase stain, Brugess proved the myelogenous origin of chloroma. The term granulocytic sarcoma was introduced by Rappaport (3) and had been generally used for many years until recently when the World Health Organization (WHO) scheme designated this tumor as MS (1). In the literature many other synonyms have been used, including extramedullary myeloid cell tumor, myeloblastoma, myelosarcoma, and monocytic sarcoma.


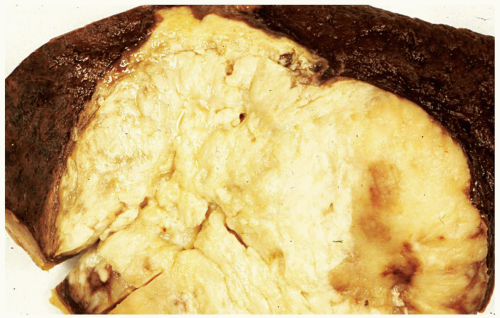
FIGURE 6.13.2 Splenectomy specimen shows a large solid tumor mass in the center, representing a granulocytic sarcoma.


Morphology

MS is morphologically similar to lymphoma, particularly large cell lymphoma. In three study series, 66%, 75%, and 100% of MS cases, respectively, were initially misdiagnosed as lymphoma (4, 5 and 6). As will be discussed later, a correct diagnosis requires a high index of suspicion and immunophenotyping of the tumor.

The major clue that may lead to the diagnosis is the demonstration of eosinophilic myelocytes (Fig. 6.13.3) in the hematoxylin and eosin-stained histologic sections (4,5). The presence of the mature granulocytes does not count, because this presence may simply represent a leukocytic reaction in a lymphoma, frequently due to necrosis of the tumor cells. Unfortunately, about 50% of MS contains no myelocytes. In those cases, a tissue imprint is more helpful for the distinction between lymphoma cells and immature myelomonocytic cells, including myeloblasts, monoblasts, and promyelocytes. Pure monocytic sarcoma is rare, but most MS contains a certain percentage of monoblasts (5). The presence of cytoplasmic granules and/or Auer rods is particularly helpful in identifying myeloblasts.

On the basis of tumor-cell differentiation, MS can be classified into three groups: well differentiated, immature (poorly differentiated), and blastic (1,4,7). The well differentiated group is composed primarily of promyelocytes, but nearly all stages of granulocyte may be present. The immature group consists of myeloblasts and promyelocytes. In tissue sections, the tumor cells have vesicular nuclei with conspicuous nucleoli (Fig. 6.13.4). The nuclei may be variable
in size and show nuclear grooves, creases, or convolutions (7). The cytoplasm is moderate to abundant, and a small number of tumor cells may show cytoplasmic granules consistent with myeloid differentiation. The blastic group is formed predominantly of myeloblasts. In tissue sections, the nuclei of the tumor cells are uniform and relatively round. The nuclear chromatin is dispersed, and small inconspicuous nucleoli are seen only occasionally. The cytoplasm varies in amount and contains no granules.


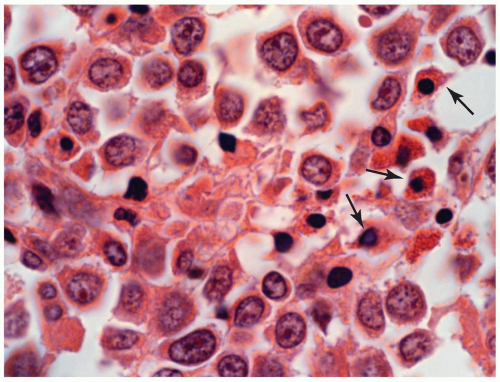
FIGURE 6.13.3 Myeloid sarcoma of bone shows a few eosinophilic myelocytes (arrows) scattered among the large tumor cells. Hematoxylin and eosin, 100× magnification.

By immunohistochemical stains, MS can be further divided into different cell lineages, which are designated as granulocytic variant, monoblastic variant, myelomonoblastic variant, megakaryoblastic variant, and erythroblastic variant (8).

MS is usually presented as sheets of leukemic infiltrate, frequently involving adjacent tissues. In the periphery of the tumor mass, tumor cells may form strands and cords (Figs. 6.13.5 and 6.13.6), and sometimes a targetoid pattern, vaguely reminiscent of invasive lobular breast carcinoma (5). The tumor infiltrates by expansion, so that normal tissues, such as the glandular and tubular structures, may be separated but the overall architecture is preserved.


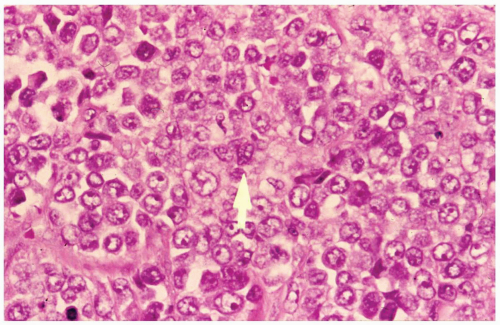
FIGURE 6.13.4 Myeloid sarcoma of the hip shows large tumor cells with vesicular nuclei and conspicuous nucleoli. One cell shows a nuclear groove (arrow). Hematoxylin and eosin, 60× magnification.


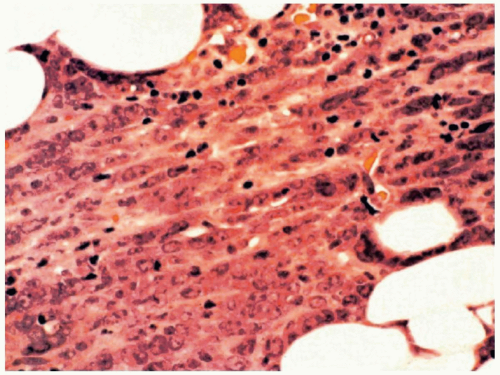
FIGURE 6.13.5 Myeloid sarcoma of a lymph node shows a cording pattern at the periphery of the tumor. Hematoxylin and eosin, 40× magnification.

In lymph nodes, the sinuses and occasionally the paracortex and medulla are infiltrated by leukemic cells, but the germinal centers are preserved. A reported case of monocytic sarcoma showed a myxoid stroma with cording of tumor cells in the lymph node (9). In another case of MS, the tumor cells assumed plasmacytoid features, simulating nonsecretory multiple myeloma (10). The morphologic characteristics of MS are summarized in Table 6.13.1.

MS may show a starry-sky pattern with a high mitotic rate, mimicking lymphoblastic and Burkitt lymphomas (4,5). Occasionally, MS may also simulate embryonal rhabdomyosarcoma, amelanotic melanoma, or undifferentiated
carcinomas (11). Electron microscopy may help in the differential diagnosis by demonstrating specific cytoplasmic granules and/or Auer rods, but the most useful technique for a definitive diagnosis is immunophenotyping by immunohistochemistry or flow cytometry.


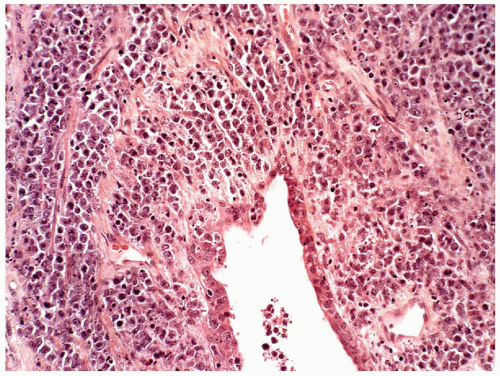
FIGURE 6.13.6 Myeloid sarcoma of the lung shows cords of tumor cells around the bronchus. Hematoxylin and eosin, 20× magnification.


TABLE 6.13.1


Characteristic Morphologic Features of Granulocytic Sarcoma


Histologic


Sheets of tumor cells separate but do not destroy normal tissue.


pattern


Tumor cells may form strands and cords at the periphery.


Cytology


Tumor cells usually mimic large lymphoma cells, but the scattered eosinophilic myelocytes may give a clue to the diagnosis.


Specific features


Cording arrangement and presence of eosinophilic myelocytes


Immunophenotype

Most immunophenotypic studies of MS were performed with immunohistochemistry. One of the reasons for this is because MS is usually an unexpected diagnosis, the specimen is often fixed, and by the time MS is suspected, flow cytometry cannot be done. Another reason is that there are many immunohistochemical markers that can be used for the identification of myelomonocytic cells, so that it is more convenient to perform immunohistochemical staining alone.

The time-honored Leder stain for chloroacetate esterase is most frequently used. However, this stain is relatively insensitive and is frequently negative in tumors composed predominantly of blasts (12). Other common immunohistochemical markers include CD14, CD15, CD43 (Fig. 6.13.7), CD68, MPO, and lysozyme. Recently, CD99 and CD117 have been added to the list (13,14). Additionally, elastase, α1-antichymotrypsin, lactoferrin, and cathepsin have been used in rare reports with various sensitivities, but are not accepted as routine histochemical stains (4,7,11,15, 16 and 17). Audouin et al. (8) have included factor VIII, CD31, and CD61 for the identification of the megakaryoblastic variant of MS and glycophorin C and blood group antigens for the erythroblastic variant.


FIGURE 6.13.7 Myeloid sarcoma cells stain strongly with CD43. Immunoperoxidase, 20× magnification.

The sensitivity of some markers depends on the cell type of the tumor. In the study by Traweek et al. (7), CD15 and CD68 (KP-1) were positive for all well differentiated MS and 76% of poorly differentiated MS. However, for the blastic groups, CD68 was positive in only three of five cases, and CD15 was negative in all of five cases. The insensitivity of these two markers in least-differentiated MS was confirmed by Hudock et al. (18).

According to the literature, the most sensitive markers appear to be lysozyme and CD43 (19, 20 and 21). The presence of CD43 in MS has been further confirmed in several other studies (2,8,16,22,23). Although CD43 is a T-cell marker, the diagnosis of MS is valid when the so called “CD43 only” pattern is present, in which other T-cell and B-cell markers are negative (20,24).

A speedy diagnosis can be made if tissue imprints are available. Cytochemical stains for MPO, chloroacetate esterase (for granulocytes), and α-naphthyl butyrate esterase (for monocytes) can be performed on such preparations.

Most of the comparative studies considered flow cytometry superior to immunohistochemistry for the diagnosis of MS. One of the reasons is that some markers (such as CD45) can be negative or weakly positive by immunohistochemical stains but strongly positive by flow cytometry in the same specimen (19,25). This is particularly true for cytospins, smears, and cell blocks, in which immunocytochemical or cytochemical stains are often difficult to interpret (26).

There are several markers which are not myelomonocytic markers but are useful for differential diagnosis. HLA-DR is helpful in identifying MS that is associated with acute promyelocytic leukemia, in which case HLA-DR should be very low or entirely absent. CD34, the stem cell marker, is present in MS cases (particularly the blastic type), but is negative for lymphomas (27). CD34, however, can be negative in well and poorly differentiated types of MS (7). CD56, a neural cell adhesion molecule, can also be found in MS, and its expression usually predicts a poor prognosis (3). In fact, CD56 is probably one of the predisposing factors for the development of MS in patients with AMLs (28). The blasts that express CD56 may bind to tissue expressing the same adhesion molecule, thus forming a solid tumor mass (29).


FIGURE 6.13.8 Myeloid sarcoma cells stains strongly with CD45, but negative with CD20 and CD3 (not shown). Immunoperoxidase, 20× magnification.

A panel of CD45 together with T-cell and B-cell markers is a powerful screening tool to distinguish MS and lymphoma, as MS usually only expresses CD45 (but not T-cell and B-cell markers) (Fig. 6.13.8). However, rare cases of MS may demonstrate T-cell markers, such as CD45RO, (UCHL1), CD3, and CD7 (11,15, 16 and 17). Less frequently, B-cell markers, such as CD20, Ki-B3, 4kB5, MB1, and LN2, have been reported in MS cases (11,16). These findings may represent nonspecific cross-reactivity, or, in some cases, they may represent a mixed lymphoid-myeloid phenotype (15,16,30).


Comparison of Flow Cytometry and Immunohistochemistry

Although most cases of MS are diagnosed by immunohistochemistry, flow cytometry is more helpful in some conditions. There are some antibodies that are available only for flow cytometry, such as CD13, CD11b, CD11c, CD14, and CD33. In MS of monocytic lineage, multiple monocytic antibodies (CD11b, CD11c, CD14, and CD64) should be used, because one or two of these markers can be negative in individual cases (19,31).

It is particularly critical to use flow cytometry in minimally differentiated AML (AML-M0) cases, because immunohistochemistry frequently fails to demonstrate diagnostic markers in those cases. The M0 case reported by Amin et al. (32) showed the absence of MPO, lysozyme, Sudan black B, specific and nonspecific esterase, and terminal deoxynucleotidyl transferase (TdT). CD34 was demonstrated in rare cells. However, flow cytometry revealed HLA-DR, CD11c, CD13, CD15, CD34, and TdT. The report from Astall et al. (27) detected no CD15 chloroacetate esterase and lysozyme by immunohistochemistry. The only diagnostic markers were CD45 and CD43. Flow cytometry in the same case, however, demonstrated CD7, CD13, CD33, CD34, and CD43. Finally, the report from Miyata et al. (33) revealed no immunohistochemical reactions to MPO, chloroacetate esterase, and lysozyme, but flow cytometry demonstrated CD7, CD13, CD33, CD41, and CD56.

The current case is also an M0 case, which showed the absence of CD34, MPO, chloroacetate esterase, and lysozyme by immunohistochemical stains, but flow cytometry detected high percentages of CD34 and CD117, as well as dual staining of CD33-CD13/CD7 in the peripheral blood, bone marrow, and lymph node biopsy, thus a diagnosis of MS was established.


Molecular Genetics

The cytogenetic abnormalities most frequently associated with MS include t(8;21)(q22;q22), characteristic of M2; inv(16)(p13;q22) or t(16;16)(p13;q22), characteristic of M4 with eosinophilia; and t(9;11)(p21;q23), characteristic of M5 (3,34,35). In contrast, AML with t(8;21) has a higher incidence of MS, particularly orbital MS (36). In fact, t(8;21) and the expression of CD56 may play a synergistic role in the development of MS (28,37). Translocation between chromosomes 8 and 21 results in the fusion of the AML1 gene on chromosome 21 to the eleven twenty-one (ETO) gene on chromosome 8. The novel chimeric gene (AML1/ETO) produces a transcript that may play a role in leukemic transformation (38). A case of coexistence of t(8;21)(AML1/ETO) and t(9:22)(BCR/ABL) was recently reported in an MS case (39). Yin et al. (40) suggested that the synergistic effect of BCR/ABL and AML/ETO might provide an additional growth advantage necessary for neoplastic transformation.

In contrast, pediatric patients with t(8;21) AML and MS usually have a good prognosis (35,41). In general, t(8;21) AML is associated with a younger age of onset, frequent splenomegaly, a high complete remission rate, and long relapse-free survival (29). No cytogenetic abnormalities have been identified in MS associated with myelodysplastic syndrome (MDS) (42).

The salient features for laboratory diagnosis of MS are summarized in Table 6.13.2.


Clinical Manifestations

Most MS cases are associated with AML, CML, other types of myeloproliferative disorders, or MDS. These associated conditions can be present before, during, or after the occurrence of MS. In a few cases, the patient may never show features of leukemia or myelodysplasia. Those patients probably die of MS before leukemia or myelodysplasia starts to surface.

Up to 2004, approximately 800 cases of MS have been reported. According to a study series of 478 patients with myelogenous leukemias, more MS cases were associated with CML (4.5%) than AML (2.5%) (43). Less than 20 MS cases have been reported with MDS.

Among AML cases, the most commonly reported subtypes appear to be AML with maturation (AML-M2) and acute myelomonocytic leukemia with eosinophilia (AML-M4eo). Another source claimed that MS has a significantly increased incidence in M4 and M5 (3), whereas another report mentioned M1 and M2 as the most common leukemias developed after MS (27). However, as most case reports of MS did not subclassify the leukemia, the incidence of the leukemic subtypes cannot be accurately estimated.


TABLE 6.1 3.2


Salient Features for Laboratory Diagnosis of Granulocytic Sarcoma


1.


Screening panel is composed of CD45, CD19 or CD20, and CD3. MS cases should be CD45+, CD19/CD20−, CD3−. Lymphoma cases should be CD45+ and either CD19/CD20+ or CD3+.


2.


The standard flow cytometry panel for MS may include CD13, CD14, CD15, CD33, and myeloperoxidase.


3.


If monocytic sarcoma is suspected, CD11b, CD11c, CD4, and CD64 should be added.


4.


Immunohistochemistry panel may include chloroacetate esterase (Leder stain), myeloperoxidase, lysozyme, CD15, CD43, and CD68.


5.


Lysozyme and CD43 are considered the most sensitive markers.


6.


If monocytic sarcoma is suspected, α-naphthyl butyrate esterase should be added.


7.


Two new markers, CD99 and CD117, can be added in equivocal cases.


8.


Common cytogenetic abnormalities include t(8;21)(q22;q22), inv(16), and t(9;11)(p21;q23).


CD, cluster of differentiation; MS, myeloid sarcoma.


Among MDS cases, chronic myelomonocytic leukemia and refractory anemia with excess blasts in transformation have a more frequent association with MS and with subsequent development of AML. Nevertheless, MDS-associated MS is not always a forerunner of AML (44). In general, MS is a predictor of poor prognosis in CML and MDS: Patients usually die in a few weeks after the discovery of MS. In CML, the occurrence of MS is frequently followed by blast crisis.

As mentioned before, MS is frequently misdiagnosed initially. In some MS cases, a correct diagnosis was not made even in subsequent recurrences of the tumor. One patient had a series of 11 episodes of MS in the subcutaneous tissue, lymph nodes, liver, and lumbosacral epidural space over 29 months. However, the recurrences in several episodes were still misdiagnosed for diseases other than MS (28).

The most frequently involved organs and/or tissues are soft tissue, periosteum and bone, lymph nodes, and skin. In female patients, ovaries and the breast are frequently involved (45). One patient had MS in the vagina, both breasts, and ovaries 6 months after the development of AML (46). In pediatric patients, orbital MS is the most frequent finding (35,47). However, many organ involvements were only discovered at autopsy. In autopsied cases, practically all major organs, except for the spleen, have been affected (3).

The age of MS has a wide range, varying from 1 week to 75 years. It has been seen mostly in the middle-aged male population, and less frequently in patients younger than 15 years. The mean age in several reported series is very close: 43 years reported by Eshghabadi et al. (48), 48 years by Neiman et al. (4), and 44 years by Friedman et al. (49).

The importance of making an accurate diagnosis of MS is due to its therapeutic implication. Patients who receive antileukemic therapy with or without local radiation therapy usually have a long remission, whereas other treatments, such as surgical, radiation, and antilymphoma therapy, usually show no effects. Patients who were treated with antileukemic therapy within 4 months from the initial diagnosis of MS achieved complete remission of both MS and leukemia (6). In contrast, patients initially treated for lymphoma usually failed to respond to the subsequent correct treatment and had a dismal prognosis (17). Therefore, the current opinion advocates treating MS as AML, even in the absence of leukemic manifestations (6,17,34,48,49).


REFERENCES

1. Brunning RD, Matutes E, Flandrin G, et al. Acute myeloid leukaemia not otherwise categorized. In: Jaffe ES, Harris NL, Stein H, Vardiman JW, eds. Tumours of Haematopoietic and Lymphoid Tissues. Lyon, France: IARC Press; 2001:91-107.

2. Dabbagh V, Browne G, Parapia LA, et al. Granulocytic sarcoma of the rectum: a rare complication of myelodysplasia. J Clin Pathol. 1999;52:865-866.

3. Byrd JC, Edenfield J, Shields DJ, et al. Extramedullary myeloid cell tumors in acute nonlymphocytic leukemia: a clinical review. J Clin Oncol. 1995;13:1800-1816.

4. Neiman RS, Barcos M, Berard C, et al. Granulocytic sarcoma: a clinicopathologic study of 61 biopsied cases. Cancer. 1981;48:1426-1437.

5. Meiss JM, Butler JJ, Osborne BM, et al. Granulocytic sarcoma in nonleukemic patients. Cancer. 1986;58:2697-2709.

6. Breccia M, Mandelli F, Petti MC, et al. Clinico-pathological characteristics of myeloid sarcoma at diagnosis and during follow-up: report of 12 cases from a single institution. Leuk Res. 2004;28:1165-1169.

7. Traweek ST, Arber DA, Rappaport H, et al. Extramedullary myeloid cell tumors: an immunohistochemical and morphologic study of 28 cases. Am J Surg Pathol. 1993;17: 1011-1019.

8. Audouin J, Comperat E, Le Tourneau A, et al. Myeloid sarcoma: clinical and morphologic criteria useful for diagnosis. Int J Surg Pathol. 2003;11:271-282.

9. Strauchen JA. Sarcomatoid neoplasm of monocytic lineage. Am J Surg Pathol. 1991;15:1206-1208.

10. Carmichael GP, Lee YT. Granulocytic sarcoma simulating “non-secretory” multiple myeloma. Hum Pathol. 1977;8: 697-700.

11. Davey FR, Olsen S, Kurec AS, et al. The immunophenotyping of extramedullary myeloid cell tumors in paraffin-embedded tissue sections. Am J Surg Pathol. 1988;12:699-707.

12. Roth MJ, Medeiros J, Elenitoba-Johnson K, et al. Extramedullary myeloid cell tumors: an immunohistochemical study of 29 cases using routinely fixed and processed paraffinem-bedded tissue sections. Arch Pathol Lab Med. 1995;119: 790-798.

13. Zhang PJ, Barcos M, Stewart CC, et al. Immunoreactivity of MIC2 (CD99) in acute myelogenous leukemia and related disease. Mod Pathol. 2000;13:452-458.


14. Chen J, Yanuck RR, Abbondanzo SL, et al. C-kit (CD117) reactivity in extramedullary myeloid/granulocytic sarcoma. Arch Pathol Lab Med. 2001;125:1448-1452.

15. Furebring-Freden M, Martinsson U, Sundstrom C. Myelosarcoma without acute leukemia. Immunohistochemical and clinicopathologic characterization of eight cases. Histopathology. 1990;16:243-250.

16. Horny HP, Campbell M, Steinke B, et al. Acute myeloid leukemia: immunohistologic findings in paraffin-embedded bone marrow biopsy specimens. Hum Pathol. 1990;21: 648-655.

17. Fellbaum C, Hansmann ML. Immunohistochemical differential diagnosis of granulocytic sarcoma and malignant lymphomas on formalin-fixed material. Virchows Arch A Pathol Anat Histopathol. 1990;416:351-355.

18. Hudock J, Chatten J, Miettinen M. Immunohistochemical evaluation of myeloid leukemia infiltrates (granulocytic sarcoma) in formaldehyde-fixed, paraffin-embedded tissue. Am J Clin Pathol. 1994;102:55-60.

19. Dunphy CH, Martin DS. Extramedullary tumor of monoblasts in the central nervous system: presenting feature of simultaneous bone marrow involvement by acute monocytic leukemia. Arch Pathol Lab Med. 1999;123:327-331.

20. Menasce LP, Banerjee SS, Beckert E, et al. Extra-medullary myeloid tumour (granulocytic sarcoma) is often misdiagnosed: a study of 26 cases. Histopathology. 1999;34:391-398.

21. McCluggage WG, Boyd HK, Jones FD, et al. Mediastinal granulocytic sarcoma: a report of two cases. Arch Pathol Lab Med. 1998;122:545-547.

22. Valbuena JR, Admirand JK, Gualko G, et al: Myeloid sarcoma involving the breast. Arch Pathol Lab Med. 2005;129: 32-38.

23. Tao J, Wu M, Fuchs A, et al. Fine-needle aspiration of granulocytic sarcomas: a morphologic and immunophenotypic study of seven cases. Ann Diagn Pathol. 2000;4:17-22.

24. Segal GH, Stoler MH, Tubs R. The “CD43 only” phenotype: an aberrant, nonspecific immunophenotype requiring comprehensive analysis for lineage resolution. Am J Clin Pathol. 1992;97:861-865.

25. Quintanilla-Martinez L, Zukerberg LR, Ferry JA, et al. Extramedullary tumors of lymphoid or myeloid blasts. The role of immunohistology in diagnosis and classification. Am J Clin Pathol. 1995;104:431-433.

26. Liu K, Mann KP, Garst JL, et al. Diagnosis of posttransplant granulocytic sarcoma by fine-needle aspiration cytology and flow cytometry. Diagn Cytopathol. 1999;20:85-89.

27. Astall E, Yarranthon H, Arnl J, et al. Granulocytic sarcoma preceding AML M0 and the diagnostic value of CD34. J Clin Pathol. 1999;52:705-707.

28. Byrd JC, Weiss RB. Recurrent granulocytic sarcoma. An unusual variation of acute myelogenous leukemia associated with 8;21 chromosomal translocation and blast expression of the neural cell adhesion molecule. Cancer. 1994;73:2107-2112.

29. Tallman MS, Hakimian D, Shaw JM, et al. Granulocytic sarcoma is associated with 8;21 translocation in acute myeloid leukemia. J Clin Oncol. 1993;11:690-697.

30. Hossain D, Weisberger J, Sreekantaiah C, et al. Biphenotypic (mixed myeloid/T-cell) extramedullary myeloid cell tumor. Leuk Lymphoma. 1999;33:399-402.

31. Lauritzen AF, Delsol G, Hansen NE, et al. Histiocytic sarcomas and monoblastic leukemias: a clinical, histologic and immunophenotypic study. Am J Clin Pathol. 1994;102:45-54.

32. Amin KS, Ehsan A, McGuff HS, et al. Minimally differentiated acute myelogenous leukemia (AML-M0) granulocytic sarcoma presenting in the oral cavity. Oral Oncol. 2002;38:516-519.

33. Miyata A, Fujii S, Kijuchi T, et al. Acute myelocytic leukemia (M0) in an elderly patient with relapsed granulocytic sarcoma (M7) of bone during the second period of complete remission 5 years after onset [in Japanese]. Nippon Ronen Igakkai Zasshi (Jap J Geriatrics). 2003;4: 507-513.

34. Hutchison RE, Kurec AS, Davey FR. Granulocytic sarcoma. Clin Lab Med. 1990;10:889-901.

35. Brown NP, Rowe D, Reid MM. Granulocytic sarcoma with translocation (9;11)(p22;q23): two cases. Cancer Genet Cytogenet. 1997;96:115-117.

36. Schwyzer R, Sherman GG, Cohn RJ, et al. Granulocytic sarcoma in children with acute myeloblastic leukemia and t(8;21). Med Pediatr Oncol. 1998;31:144-149.

37. Krishnan K, Ross CW, Adams PT, et al. Neural cell-adhesion molecule (CD56)-positive, t(8;21) acute myeloid leukemia (AML-M2) and granulocytic sarcoma. Ann Hematol. 1994;69: 321-323.

38. Caligiuri MA, Strout MP, Gilliland DG. Molecular biology of acute myeloid leukemia. Semin Oncol. 1997;24:32-44.

39. Jondle DM, Sun T, Woods JE, et al. The role of flow cytometry in the diagnosis of myeloid sarcoma. In press.

40. Yin CC, Medeiros LJ, Glassman AB, et al. t(8;21)(q22;q23) in blast phase of chronic myelogenous leukemia. Am J Clin Pathol. 2004;121:836-842.

41. Felice MS, Zubizarreta PA, Alfaro EM, et al. Good outcome of children with acute myeloid leukemia and t(8;21)(q22;q22), even when associated with granulocytic sarcoma: a report from a single institute in Argentina. Cancer. 2000;88:1939-1944.

42. List A, Gonzalez-Osete G, Kummet T, et al. Granulocytic sarcoma in myelodysplastic syndromes: clinical marker of disease acceleration. Am J Med. 1991;90:274-276.

43. Muss HB, Maloney WC. Chloroma and other myeloblastic tumors. Blood. 1973;42:721-728.

44. Byrd JC, Edenfield WJ, Dow NS, et al. Extramedullary myeloid cell tumors in myelodysplastic syndromes: not a true indication of impending acute myeloid leukemia. Leuk Lymphoma. 1996;21:153-159.

45. Liu PI, Ishimaru T, McGregor DH, et al. Autopsy study of granulocytic sarcoma (chloroma) in patients with myelogenous leukemia. Hiroshima-Nagasaki 1949-1969. Cancer. 1973;31:948-955.

46. Gralnick HR, Dittmar K. Development of myeloblastoma with massive breast and ovarian involvement during remission in acute leukemia. Cancer. 1969;24:746-749.

47. Stockl FA, Dolmetsch AM, Saornil MA, et al. Orbital granulocytic sarcoma. Br J Ophthalmol. 1997;81:1084-1088.

48. Eshghabadi M, Shojania AM, Carr I. Isolated granulocytic sarcoma: report of a case and review of the literature. J Clin Oncol. 1986;4:912-917.

49. Friedman HD, Adelson MD, Elder RC, et al. Granulocytic sarcoma of the uterine cervix-literature review of granulocytic sarcoma of the female genital tract. Gyncol Oncol. 1992;46:128-137.


CASE 14 Precursor B-Lymphoblastic Leukemia/Lymphoma


CASE HISTORY

A 20-year-old man was found to have leukocytosis during a preoperative evaluation before a knee operation. Further hematologic workup showed that his total leukocyte count was 55,000/µL with 54% lymphocytes, 33% blasts, 11% neutrophils, and 2% monocytes. The hematocrit was 45% and platelet count 331,000/µL. The only clinical symptom that the patient had at that time was a persistent sore throat.

The patient was initially refractory to chemotherapy, but he was finally in remission after high dose chemotherapy. However, his leukocyte count gradually dropped to 100/µL. His hematocrit dropped to 23.6% and platelets to 30,000/µL. He developed a neutropenic fever with a temperature of 101.2°F. His infection was finally under control, and he received a bone marrow transplant from a matched, unrelated donor.


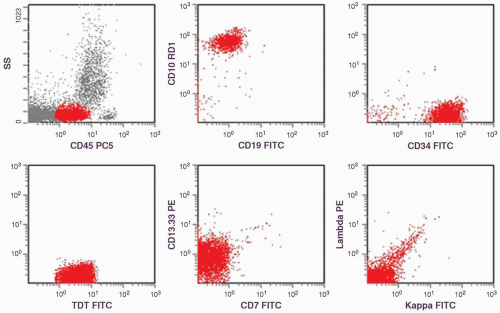
FIGURE 6.14.1 Flow cytometric histograms show dual staining of CD10 and CD19, positive CD34 and terminal deoxynucleotidyl transferase (TdT), partial positive CD13.33, but negative CD7, kappa, and lambda. SS, side scatter; PC5, phycoerythrin-cyanin 5; RD1, rhodamine; FITC, fluorescein isothiocyanate; TDT, terminal deoxynucleotidyl transferase; PE, phycoerythrin.

The patient was doing well for 10 months without any clinical symptoms, but his routine check-up showed multiple blasts at the end of the 10th month. He was again treated with chemotherapy, which achieved a complete remission. However, he developed pulmonary aspergillosis with subsequent spreading to the brain. He had several episodes of left-sided seizures with residual left lower extremity weakness. Despite multiple antibiotic treatments, the patient continued to have spiking fever, and became lethargic and confused. The patient finally died 17 months after the initial diagnosis of acute lymphoblastic leukemia (ALL).


FLOW CYTOMETRIC FINDINGS

Bone marrow aspiration: CD7 0%, CD10 94%, CD10/CD19 84%, CD14 1%, CD13-CD33 53%, CD34 97%, κ 0%, λ 0%, 0%, terminal deoxynucleotidyl transferase (TdT) 85% (Fig. 6.14.1).


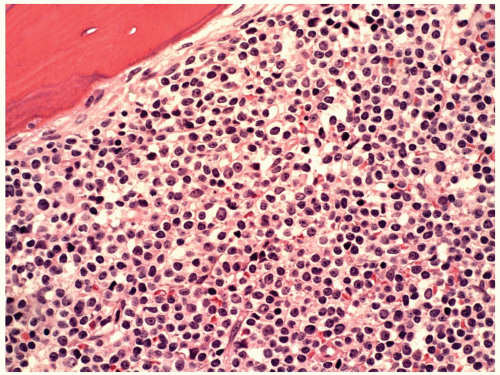
FIGURE 6.14.2 Bone marrow biopsy of a case of B-cell acute lymphoblastic leukemia (ALL) shows diffuse blast infiltration. Hematoxylin and eosin, 40× magnification.


CYTOCHEMICAL STAINS

The blasts were negative for myeloperoxidase (MPO), α-naphthyl butyrate esterase, and chloroacetate esterase but were positive for periodic acid-Schiff (PAS).


DISCUSSION

Precursor B-lymphoblastic leukemia/lymphoma includes ALL and lymphoblastic lymphoma (LBL) of B-cell origin. ALL is a leukemia with proliferation of lymphoblasts involving both the bone marrow (Fig. 6.14.2) and the peripheral blood. The cutoff point for clinical diagnosis of ALL is 25% blasts in the bone marrow (1). A case is diagnosed as ALL when ≥25% of lymphoblasts are present in the marrow. If bone marrow shows <25% of lymphoblasts in a case with lymph node or other soft tissue involvement, it is designated LBL with bone marrow involvement. There is a need to establish an arbitrary threshold to separate ALL from LBL because a leukemic phase may be present in LBL. In contrast, lymphoblasts may be absent in the peripheral blood in occasional ALL cases (aleukemic leukemia). In fact, about one third of ALL patients have a total white cell count of <5,000/µL.


TABLE 6.14.1


FAB Classification for Acute Lymphoblastic Leukemia


L1


L2


L3


Size of blasts


Small, uniform


Large, variable


Medium to large, uniform


Amount of cytoplasm


Scanty


Variable


Moderate


Cytoplasmic basophilia


Moderate


Variable


Intense


Cytoplasmic vacuoles


Variable


Variable


Prominent


Nucleus


Regular, occasional clefting, homogenous chromatin


Irregular, clefting common, heterogeneous chromatin


Regular, nonclefted, homogeneous, finely stippled chromatin


Nucleolus


0-1, inconspicuous


≥1, prominent


2-5, prominent


N/C ratio


High


Low


Low


FAB, French-American-British; N/C ratio, nuclear/cytoplasmic ratio.


Morphology and Cytochemistry

The morphology of leukemic lymphoblasts varies between adults and children. The most popular morphologic classification is the French-American-British (FAB) system, which divides ALL into L1, L2, and L3 (Table 6.14.1) (2,3). The leukemic cells in L1 are uniformly small with scanty cytoplasm (Fig. 6.14.3). Their nuclei are regular in shape, with inconspicuous nucleoli. This form is usually seen in pediatric cases. The neoplastic cells in L2 are generally large, but their size is variable, as is the cytoplasm (Fig. 6.14.4). Their nuclei also vary in shape, with prominent nucleoli. This form is more frequently seen in adults than in children. The cells in L3 are uniformly large, with moderate amounts of deep basophilic cytoplasm, which contains many vacuoles. The nuclei are round and regular with prominent nucleoli. This form is rare in comparison with L1 and L2 and is more frequently seen in adults. It can also be the leukemic form of Burkitt lymphoma.

However, not all cases of ALL are easily assigned to the L1 and L2 subgroups, so reproducibility among observers is not high (4). In addition, immunophenotypes and cytogenetic abnormalities play an important role in predicting the prognosis, but these parameters do not correlate well with the L1 and L2 classification. Therefore, L1 and L2 have been combined by the World Health Organization (WHO) into one group: ALL L1/L2 (5). ALL must be distinguished from acute myeloid leukemia (AML). Their distinction is based on morphology, cytochemistry, immunophenotyping, and genotyping (Table 6.14.2).


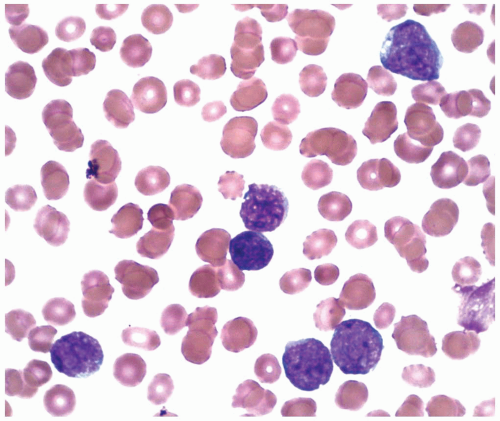
FIGURE 6.14.3 Peripheral blood smear of acute lymphoblastic leukemia (ALL) case shows small, uniform blasts with scant cytoplasm and inconspicuous nucleoli (L1 morphology). Wright-Giemsa, 100× magnification.

Cytochemically, lymphoblasts are only positive for PAS (6). The typical staining pattern for lymphoblasts is called the block pattern, but this pattern is not always present. In fact, some ALL cases can be PAS negative. In contrast, cases of AML may occasionally show a positive reaction to PAS. Therefore, the PAS reaction is not specific. In contrast, MPO, chloroacetate esterase, and α-naphthyl butyrate esterase are relatively specific for AML, so negative reactions to these cytochemical stains are helpful in excluding AML and are thus useful in establishing the diagnosis of ALL.


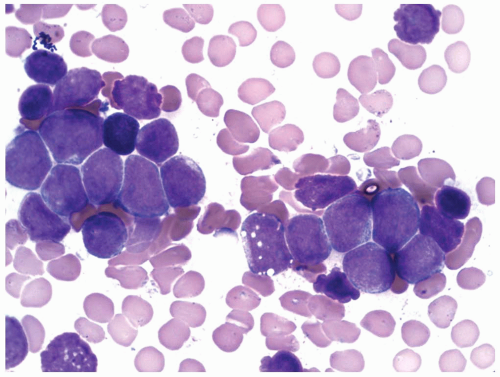
FIGURE 6.14.4 Bone marrow aspirate of acute lymphoblastic leukemia (ALL) case shows large blasts with variable sizes, scant cytoplasm, and inconspicuous nuclei (L2 morphology). Wright-Giemsa, 100× magnification.

Another entity that should be distinguished is the hematogone. Hematogones are normal B-cell precursors that can be demonstrated in pediatric bone marrow or in bone
marrow regenerating after chemotherapy or transplantation. It is, therefore, most important to differentiate hematogones from lymphoblasts, particularly in pediatric ALL cases after chemotherapy. Hematogones are small to medium-sized with a high nuclear cytoplasmic ratio, and can mimic small mature lymphocytes or L1 lymphoblasts. Their major morphologic differences from lymphoblasts are the homogeneous nuclear chromatin pattern and the absence of nucleoli (5). In some cases, however, indistinct nucleoli can be present. A low percentage (0.01% to 1.3%) of hematogones has been detected in the peripheral blood of patients without ALL (7).


TABLE 6.14.2


Differentiating Features between Acute Lymphoblastic and Acute Myeloblastic Leukemias


Lymphoblastic


Myeloblastic


Size of blasts


Variable, depending on subtype


Usually large and uniform


Cytoplasm


Scant


Moderate amount


Cytoplasmic granules


Absent


Frequently present


Auer rods


Absent


Seen in about 1/5 of cases


Nuclear chromatin


Coarse to fine


Delicate and dispersed


Nucleoli


0-2, less prominent


1-4, often prominent


Myelodysplastic changes


Absent


May be present


Myeloperoxidase/Sudan black


Negative


Often positive


Chloroacetate esterase


Negative


Positive in myeloid leukemia


Nonspecific esterase


Negative


Positive in monocytoid leukemia


Periodic acid-Schiff


Often positive


Positive in about 10%-15% of cases


TdT


Frequently positive


Positive in occasional cases


Common ALL antigen (CD10)


Frequently positive


Negative


Myeloid antigens


Negative


Positive


Gene rearrangement


Frequently positive


Occasionally positive


TdT, terminal deoxynucleotidyl transferase; CD, cluster of differentiation.


Immunophenotype

In the Foon and Todd (8) immunologic classification, antibodies against human leukocyte antigen-DR (HLA-DR), CD19, CD10, CD20, Cµ, and surface immunoglobulin M (IgM) are used to subdivide B-cell ALL into six subgroups. However, some of the subgroups may not be relevant in terms of prognosis and treatment. Therefore, the new immunologic classification includes only three subgroups: B-precursor ALL, pre-B ALL, and B-ALL (9). Some authors use the terms of early pre-B, pre-B, and B-ALL to define the same classification (10). Others omit the pre-B stage (1) or add a transitional pre-B subgroup in between pre-B and B-cell ALL (11).

These stages can be distinguished simply by using CD19, Cµ, and surface Ig. B-precursor ALL shows only CD19, pre-B ALL expresses CD19 and Cµ, whereas B-ALL bears CD19 and surface Ig. However, a recent study shows that surface Ig can be occasionally demonstrated in B-precursor and pre-B ALL (12). The malignant nature of the ALL cells is determined by TdT, CD10 (common ALL antigen), and CD34 (hematopoietic progenitor antigen). TdT is present in most cases of ALL except for B-ALL. CD10 is seen in most cases of B-cell ALL. CD34 is present in B-precursor ALL (but not in pre-B ALL) and in some cases of B-ALL.

Additional antibodies that can be helpful in classifying ALL include HLA-DR, CD20, CD22, and CD24 (Table 6.14.3). Cytoplasmic CD22 appears earlier than surface CD22 in the B-cell developmental stage and is consistently positive in B-ALL (13).

A relatively new marker, CD79a, has been routinely used to identify B cells in ALL cases at St. Jude Children’s Research Hospital (14). In another study, CD79a was found in the cytoplasm of B cells in most cases of ALL of different categories, including early B cell, pre-B cell, and mature B cell, as well as in common ALL. CD79b is also present in the cytoplasm of B cells in different kinds of ALL, but it is a less sensitive marker than CD79a (15).


TABLE 6.14.3


Immunophenotypic Classification of B-Lineage Acute Lymphoblastic Leukemia


Antigens


B-Precursor ALL


Pre-B ALL


B-ALL


CD10


+


+


±


CD19


+


+


+


CD20


±


±


+


Cyto-CD22


+


+


+


CD22


+


CD24


+


+


+


CD34


+


Cyto-CD79a


+


+


+


HLA-DR


+


+


+


Cyto-µ


+


Surface Ig


+


TdT


+


±


ALL, acute lymphoblastic leukemia; Cyto-, cytoplasmic; Ig, immunoglobulin; TdT, terminal deoxynucleotidyl transferase; HLA-DR, human leukocyte antigen-DR; CD, cluster of differentiation.


TABLE 6.14.4


Correlation between Immunologic Classification, FAB Subgroups, and Cytogenetic Abnormalities


Immunologic Subgroup


FAB Subgroup


Cytogenetic Abnormalities


Approximate Frequency


B-precursor ALL


L1, L2


t(9;22), 11q23 rearr., t(12;21)


50%


Pre-B ALL


L1, L2


t(9;22), 11q23 rearr., t(1;19)


20%


B-ALL


L3


t(8;14), t(2:8), t(8;22)


4%


ALL, acute lymphoblastic leukemia; FAB, French-American-British; rearr., rearrangement.


Mixed lineage ALL cases are encountered occasionally. When CD2 and CD19 are demonstrated, those cases usually represent precursor-B ALL rather than T-cell ALL (T-ALL) because Ig rearrangements are demonstrated in most of these cases, whereas T-cell receptor (TCR) rearrangement is rarely observed (16). One or more myeloid markers can be demonstrated in as many as one fourth of children and one third of adults with ALL (10). However, a diagnosis of acute mixed lineage leukemia should be reserved for cases with definitive evidence of both myeloid and lymphoid characteristics by immunophenotyping and genotyping (15). This mixed lineage feature usually has no prognostic or therapeutic implications, but a few cases may require treatment directed toward both lineages (14).

The immunologic classification also correlates with the FAB subgroups and associates with certain cytogenetic abnormalities (Table 6.14.4) (9,10). B-precursor ALL
constitutes 50% of adult ALL and shows L1 or L2 morphology. It is associated with t(9;22), 11q23 rearrangement, and t(1;19). B-ALL is present in 4% of adult ALL and is the leukemic counterpart of Burkitt lymphoma. Therefore, it shows L3 morphology and is associated with t(8;14), t(2;8), or t(8;22). In B-ALL patients showing no L3 morphology, the cytogenetic changes may also be different, and the prognosis is worse than it is in patients with L3 morphology (9). Because many of these patients carry t(14;18), some authors have suggested that these may represent cases of follicular lymphoma progressing to a leukemic phase with blast transformation (17). However, recent studies show that many of these cases have t(4;11) translocation involving the AF4 and mixed lineage leukemia (MLL) genes (18). The immunophenotype of these cases is characterized by the absence of CD10 and coexpression of myeloid-associated markers, particularly CD15 (19).

One distinct function of immunophenotyping by flow cytometry is to distinguish regenerated lymphoblasts after chemotherapy of ALL versus leukemic lymphoblasts. Wells et al. (20) emphasized the assessment of the dot-plot projections (patterns) using pairs of monoclonal antibodies (CD2/CD19, CD20/CD10, CD22/CD34, HLA-DR/CD11b, CD33/CD13, and cytoplasmic TdT) combined with CD45 peridinin-chlorophyll-protein complex (perCP). In comparison with the pattern of normal lymphoblasts, they found the following aberrations in leukemic lymphoblasts: increased side scatter, increased forward scatter, decreased CD45 expression, overexpression of CD10, underexpression of CD10, absence of CD10, desynchronous CD22/CD34, decreased CD19 expression, myeloid antigen expression, and absence of CD34. Because the aberration differs in each case, such changes can be used to identify tumor cells in the bone marrow of a particular patient and is thus helpful in detecting minimal residual disease (MRD).

As mentioned before, hematogones should be distinguished from lymphoblasts, especially after chemotherapy. Hematogones can be divided into three maturation stages (21). Stage 1 hematogones express TdT, CD34, CD10, CD19, CD22, and CD38. In stage 2, TdT and CD34 are down-regulated and CD10 is partially down-regulated, but CD20 and surface Ig start to appear. Stage 3 hematogones show the same markers as in stage with strong expression of CD20 and surface Igs. The major distinction between hematogones and lymphoblasts is that the former always express a continuous and complete maturation spectrum and lack asynchronous or aberrant antigen expression, whereas neoplastic lymphoblasts often show aberrant immunophenotype (21).


Comparison between Flow Cytometry and Immunohistochemistry

A large panel of antibodies can be used in flow cytometric analysis. Flow cytometry is also able to distinguish cytoplasmic from surface staining (e.g., cytoplasmic CD22 and Cµ). Therefore, this technique is superior to immunohistochemistry for the diagnosis of ALL. However, hematogones can be easily recognized with immunohistochemical stain due to direct morphologic correlation.

In the current case, the negative cytochemical staining in MPO, α-naphthyl butyrate esterase, and chloroacetate esterase but positive PAS staining is not supportive of acute myelogenous leukemia. The positive reactions to TdT, CD10, CD34, and CD19 are consistent with ALL of B-cell lineage. The presence of CD13/CD33 markers can be seen in ALL cases and it does not mean biphenotypic leukemia (5). In terms of stage, the absence of Cµ excludes pre-B ALL, and the absence of surface Igs rules out B-ALL. Therefore, this case should be diagnosed as B-precursor ALL.


Molecular Genetics

Cytogenetics plays an important role in ALL, because it is the most powerful prognostic predictor that can be used to guide the therapeutic approach. On the basis of cytogenetic findings, childhood precursor-B ALL can be divided into three distinct subgroups (11). The low risk group includes ALL cases with hyperdiploidy (>50 chromosomes), t(12;21), and dic(9:12). The high risk group includes those cases with 11q23 translocations, t(9:22), and hypodiploidy (<46 chromosomes). The remaining cases, including those with t(1;19), are classified in the intermediate risk group. However, another study showed that the poor prognosis associated with pre-B ALL is attributable to its association with the translocation t(1;19) (13). The higher frequency of t(9;22) in adult ALL as compared with childhood ALL partially accounts for the generally poor outcome in adult cases (22). For the high risk group, the patient should be treated aggressively with early bone marrow transplantation. The low risk patients can be treated with less toxic drugs, such as antimetabolites.

Numerical chromosome aberrations, either alone or in association with structural abnormalities, are present in about half of ALL cases. These changes can be divided into several ploidy groups, namely, low hyperdiploidy (47 to 50 chromosomes), high hyperdiploidy (>50 chromosomes or DNA index >1.15), hypodiploidy, pseudodiploidy (46 chromosomes with structural abnormalities), and gain or loss of a single chromosome (23).

There are more than 30 structural abnormalities, including translocation, deletion, inversion, isochromosome, and dicentric chromosome (dic), known to be present in ALL; the more important ones are listed in Table 6.14.5 (23, 24 and 25). The Groupe Francais de Cytogénétique Hématologique found structural abnormalities in 78% of ALL cases studied (22). In recent years, most genes involved in translocations have been characterized by molecular biology (24,25). Because molecular biology techniques are usually more sensitive than karyotyping, they have become very important tools for diagnosis and prognostic prediction in cases of ALL. The Southern blotting technique has been gradually replaced by polymerase chain reaction (PCR) and reverse transcriptase (RT)-PCR techniques. In addition, the fluorescence in situ hybridization technique is able not only to detect numerical chromosome aberrations but also translocations. Proto-oncogenes are usually involved in chromosomal translocations. As a result, either the proto-oncogene is activated or a fusion transcript/chimeric protein is formed to induce
tumorigenesis (24,25). The loss of tumor suppressor genes is another mechanism in the pathogenesis of ALL.


TABLE 6.14.5


Important Chromosomal Abnormalities and Genes Involved in Acute Lymphoblastic Leukemia


Abnormality


Genes Involved


Approximate Incidence


t(9;22)(q34;q11)


BCR, ABL


Adults: 30%; children: 3%


t(8;14)(q24;q32)


c-MYC, IgH


1%


t(2:8)(p12;q24)


c-MYC, IgK


<1%


t(8;22)(q24;q11)


c-MYC, IgL


<1%


t(1;19)(q23;p13)


E2A, PBX1


5%


t(17;19)(q22;p13)


E2A, HLF


<1%


t(5;14)(q31;q32)


IL3, IgH


<1%


t(1;11)(p32;q23)


MLL, AF1P


<1%


t(4;11)(q21;q23)


MLL, AF4


Infants: 60%; adults: 5%


t(9;11)(p22;q23)


MLL, AF9


<1%


t(12;21)(p13;q22)


TEL, AML1


Adults: <1%; children: 20%


BCR, breakpoint cluster region; ABL, Ableson; c-MYC, an oncogene derived from avian myelocytomatosis virus; Ig, immunoglobulin; HLF, hepatic leukemia factor; MLL, mixed lineage leukemia; TEL, translocation-Ets-leukemia oncogene; AML1, acute myeloid leukemia 1.


When an immunophenotype is not conclusive, Ig gene or TCR gene rearrangement should be considered (26). Most B-cell ALL cases show Ig gene rearrangement. However, most B-precursor ALL cases reveal TCR δ chain gene rearrangement (27). Although Ig or TCR gene rearrangements are present in virtually all ALL cases, cross-lineage gene rearrangements occur in >90% of precursor B-ALL and in about 20% of T-ALL, so that a conclusive result may not be obtainable (28). The selection of methods is also important. Because combinatorial diversity is relatively restricted for TCR γ and TCR α rearrangements, Southern blotting is the method of choice for their detection (24). In contrast, IgH, TCR β, and TCR δ show considerable junctional diversity, and PCR is preferred.

Recent studies show that gene expression profiling has a great potential in stratifying ALL cases, predicting prognosis, and guiding treatment selection (29,30). Gene profiling has also identified unique leukemia-associated markers, which can be monitored by flow cytometry for the detection of MRD (29). For instance, ALL cases with MLL rearrangements are associated with CD10− CD24− CD15+ (30). ALL with t(1;19) is characterized by CD10+ CD34− CD20− Cµ+ (5). B-ALL with t(12;21) shows CD10+ HLA-DR+ CD9− CD20− (5).

The salient features for laboratory diagnosis of B-ALL are summarized in Table 6.14.6.


Clinical Manifestations

ALL is mainly a pediatric neoplasm with an early incidence peak at 2 to 5 years of age that represents about 80% of the childhood leukemia in the United States (23). The incidence in the pediatric group is approximately 30 cases per 1 million children younger than 15 years. However, ALL has a bimodal distribution, with a second peak around age 50 years, and a steady rise in incidence thereafter. The incidence of ALL in adults is about one third that in children. In the United States, ALL is more frequently seen in whites than in blacks (1.8:1) and in boys than in girls (1.2:1) (11).

The clinical symptoms of ALL are due to suppression of hematopoiesis in the bone marrow and, occasionally, extramedullary leukemic infiltration. The most common symptom is anemia, which manifests as pallor, weakness, and excessive tiredness. Hemorrhages, such as petechiae, ecchymoses, and epistaxis, occur in about two thirds of patients. Neutropenia, which may lead to a predisposition to bacterial infections, is less commonly seen. Lymphadenopathy and splenomegaly are seen in three fourths of patients, and hepatomegaly in one half of patients. In ALL cases, central nervous system, testicular, renal, and bone and joint involvement are the most common (3). In B-LBL cases, the skin,
bone, and lymph nodes are most frequently involved (5). However, any organ system can be affected (Fig. 6.14.5).


TABLE 6.14.6


Salient Features for Laboratory Diagnosis of B-Cell ALL


1.


TdT positive for precursor-B and pre-B ALL


2.


CD10 positive in all subgroups, except for some B-ALL cases


3.


HLA-DR positive in all subgroups


4.


CD19 frequently present without CD20


5.


Cµ positive in pre-B ALL only


6.


Monoclonal surface immunoglobulin in B-ALL only


7.


Immunoglobulin gene or T-cell receptor gene rearrangements


ALL, acute lymphoblastic leukemia; TdT, terminal deoxynucleotidyl transferase; HLA-DR, human leukocyte antigen-DR; CD, cluster of differentiation.


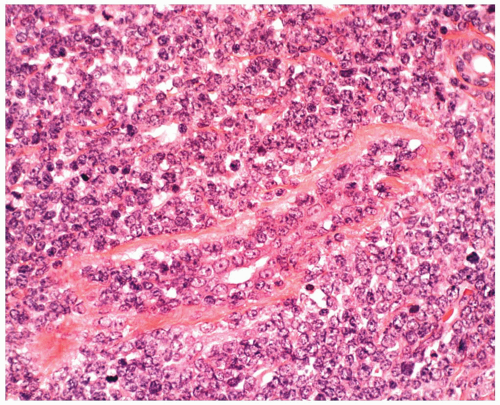
FIGURE 6.14.5 Breast biopsy of acute lymphoblastic leukemia (ALL) case reveals ductal and periductal leukemic infiltration. Wright-Giemsa, 40× magnification.

The current cure rate is about 80% in children but only 30% to 40% in adults (11,31,32). This discrepancy is partly due to the higher frequency of adverse genetic aberrations (e.g., breakpoint cluster region/Ableson[BCR/ABL] fusion gene) and partly due to the usually higher leukocyte count or other factors present in the adult ALL population. In contrast, children aged 1 to 9 years usually have hyperdiploidy and favorable genetic changes (e.g., translocation-Etsleukemia/acute myeloid leukemia [TEL/AML1] fusion gene). The prognosis of infants <12 months old is generally poor. This may be related to both clinical and biological factors, such as high leukocyte counts at diagnosis, irregular or immature phenotypes, and unfavorable molecular and cytogenetic abnormalities (e.g., MLL rearrangement) (33).

The follow-up examination of bone marrow after chemotherapy for the detection of MRD has been advocated in recent years and it has proven to be a powerful tool for the prediction of prognosis (34). There are several sensitive techniques for the detection of MRD, including flow cytometry, PCR, RT-PCR, and fluorescence in situ hybridization (20,25,35). The detection of MRD usually predicts relapse of ALL. However, some recent studies found that PCR analysis may be too sensitive, and long-term remission may be sustained in the presence of MRD detected by PCR (36). Therefore, a threshold of residual disease level should be determined or several techniques should be used to detect MRD at different time points after treatment. One study found that flow cytometric analysis at week 14 postchemotherapy was the most predictive (37).


REFERENCES

1. Head DR, Behm FG. Acute lymphoblastic leukemia and the lymphoblastic lymphomas of childhood. Semin Diagn Pathol. 1995;12:325-334.

2. Bennett JM, Catovsky D, Daniel MT, et al. Proposals for the classification of acute leukemias. Br J Haematol. 1976;33: 451-458.

3. Brunning RD, McKenna RW. Tumors of the Bone Marrow. Washington DC: Armed Forces Institute of Pathology; 1994:100-142.

4. Harris NL, Jaffe ES, Diebold J, et al. The World Health Organization Classification of Hematological Malignancies. Report of the Clinical Advisory Committee Meeting. Airlie House, Virginia, November 1997. Mod Pathol. 2000;13: 193-207.

5. Brunning RD, Borowitz M, Matutes E, et al. Precursor B lymphoblastic leukaemia/lymphoblastic lymphoma (precursor B-cell acute lymphoblastic leukemia). In Jaffe ES, Harris NL, Stein H, Vardiman JW, eds. Tumours of Haematopoietic and Lymphoid Tissues. Lyon, France: IARC Press; 2001:111-114.

6. Li CY, Yam LT, Sun T. Modern modalities for the diagnosis of hematologic neoplasms. New York: Igaku-Shoin; 1997:7-19.

7. Kroft SH, Asplund SL, McKenna RW, et al. Haematogones in the peripheral blood of adults: a four-colour flow cytometry study of 102 patients. Br J Haematol. 2004;126:209-212.

8. Foon KA, Todd RF. Immunologic classification of leukemia and lymphoma. Blood. 1986;68:1-31.

9. Jennings CD, Foon KA. Recent advances in flow cytometry. Application to the diagnosis of hematologic malignancy. Blood. 1997;90:2863-2892.

10. Copelan ES, McGuire EA. The biology and treatment of acute lymphoblastic leukemia in adults. Blood. 1995;85:1151-1168.

11. Pui CH. Acute lymphoblastic leukemia. Pediatr Clin North Am. 1997;44:831-846.

12. Kansal R, Deeb G, Barcos M, et al. Precursor B lymphoblastic leukemia with surface light chain immunoglobulin restriction. Am J Clin Pathol. 2004;121:512-525.

13. Borowitz MJ, DiGiuseppe JA. Acute lymphoblastic leukemia. In: Knowles DM, ed. Neoplastic Hematopathology. 2nd ed. Philadelphia: Lippincott Williams & Wilkins; 2001:1643-1665.

14. Pui CH, Evans WE. Acute lymphoblastic leukemia. N Engl J Med. 1998;339:605-615.

15. Astsaturov IA, Matutes E, Moritla R, et al. Differential expression of B29 (CD79b) and mb-1 (CD79a) proteins in acute lymphoblastic leukemia. Leukemia. 1996;10:769-773.

16. Melnick SJ. Acute lymphoblastic leukemia. Clin Lab Med. 1999;19:169-186.

17. Kouides PA, Phatak PD, Wang N, et al. B-cell lymphoblastic leukemia with L1 morphology and coexistence of t(1;19) and t(14;18) chromosome translocation. Cancer Genet Cytogenet. 1994;78:23-27.

18. Silverman LB, Sallan SE. Newly diagnosed childhood acute lymphoblastic leukemia-update on prognostic factors and treatment. Curr Opin Hematol 2003;10: 290-296.

19. Frater JL, Batanian JR, O’Connor DM, et al. Lymphoblastic leukemia with mature B-cell phenotype in infancy. J Pediatr Hematol Oncol. 2004;26:672-677.

20. Wells DA, Sale GE, Shulman HM, et al. Multidimensional flow cytometry of marrow can differentiate leukemic from normal lymphoblasts and myeloblasts after chemotherapy and bone marrow transplantation. Am J Clin Pathol. 1998;110:84-94.

21. McKenna RW, Asplund SL, Kroft SH. Immunophenotypic analysis of hematogones (B-lymphocyte precursors) and neoplastic lymphoblasts by 4-color flow cytometry. Leuk Lymphoma. 2004;45:277-285.

22. Armstrong SA, Look AT. Molecular genetics of acute lymphoblastic leukemia. J Clin Oncol. 2005;23:6306-6315.

23. Faderl S, Kantarjian HM, Talpaz M, et al. Clinical significance of cytogenetic abnormalities in adult acute lymphoblastic leukemia. Blood. 1998;91:3995-4019.


24. Macintyre EA, Delabesse E. Molecular approaches to the diagnosis and evaluation of lymphoid malignancies. Semin Hematol. 1999;36:373-389.

25. Thandla S, Aplan PD. Molecular biology of acute lymphocytic leukemia. Semin Oncol. 1997;24:45-56.

26. Crist WM, Grossi CE, Pullen DJ, et al. Immunologic markers in childhood acute lymphoblastic leukemia. Semin Oncol. 1985;12:105-121.

27. Yokota S, Hansen-Hagge TE, Ludwig WD, et al. Use of polymerase chain reactions to monitor minimal residual disease in acute lymphoblastic leukemia patients. Blood. 1991;77:331-339.

28. Szczepanski T, Pongers-Willemse MJ, Langerak AW, et al. Unusual immunoglobulin and T-cell receptor gene rearrangement patterns in acute lymphoblastic leukemia. Curr Top Microbiol Immunol. 1999;246:205-213.

29. Pui CH, Relling MV, Downing JR. Acute lymphoblastic leukemia. N Engl J Med. 2004;350:1535-1548.

30. Parkin JL, Arthur DC, Abramson CS, et al. Acute leukemia associated with the t(4;11) chromosome rearrangement: ultrastructural and immunologic characteristics. Blood. 1982;60:1321-1331.

31. Ravindranath Y. Recent advances in pediatric acute lymphoblastic and myeloid leukemia. Curr Opin Oncol. 2003;15: 23-35.

32. Kebriaei P, Larson RA. Progress and challenges in the therapy of adult acute lymphoblastic leukemia. Curr Opin Hematol. 2003;10:284-289.

33. Basso G, Ronddelli R, Covezzoli R, et al. The role of immunophenotype in acute lymphoblastic leukemia of infant age. Leuk Lymphoma. 1994;15:51-60.

34. Moppett J, Burke GAA, Steward CG, et al. The clinical relevance of detection of minimal residual disease in childhood acute lymphoblastic leukaemia. J Clin Pathol. 2003;56:249-253.

35. Campena D, Coustan-Smith E, Detection of minimal residual disease in acute leukemia by flow cytometry. Cytometry. 1999;38:139-152.

36. Estrov Z, Freedman MGH. Detection of residual disease in acute lymphoblastic leukemia of childhood. Leuk Lymphoma. 1999;33:47-52.

37. Coustan-Smith E, Sancho J, Hancock ML, et al. Clinical importance of minimal residual disease in childhood acute lymphoblastic leukemia. Blood. 2000;96:2691-2696.


CASE 15 Precursor T-Lymphoblastic Leukemia/Lymphoma


CASE HISTORY

A 10-year-old boy was admitted to the hospital because of intermittent cough, dyspnea, progressive wheezing, and orthopnea for approximately 1 month. He was treated for asthma to no avail. Chest x-ray examination revealed a large anterior mediastinal mass with tracheal deviation. Pericardial effusion was also detected. Physical examination found cervical, supraclavicular, and axillary lymphadenopathy. However, the liver and spleen were not palpable. Hematologic workup revealed a total leukocyte count of 512,000/µL with 15% lymphocytes, 12% neutrophils, and 72% blasts. His hematocrit was 35% and platelet count 95,000/µL. The blood chemistry profile was unremarkable except for an extremely high level of lactate dehydrogenase (960 U/L).

After admission, the patient was immediately treated with combined chemotherapy and radiation therapy. However, the size of the mediastinal mass and peripheral lymphadenopathy remained unchanged after treatment. He became increasingly hypoxic and bradycardic and died 5 days after admission.

At autopsy, a large mediastinal mass was found that encased the roots of the aorta, pulmonary artery, and superior vena cava. The tumor also compressed the trachea and invaded the epicardium. The pericardial fluid contained a large number of blasts.


FLOW CYTOMETRIC FINDINGS

The peripheral blood showed 0% CD2, 1% surface CD3, 54% cytoplasmic CD3, 5% CD3/CD4, 10% CD3/CD8, 6% CD5, 98% CD7, 2% CD10, 1% CD19, 3% CD25, 97% CD34, and 85% terminal deoxynucleotidyl transferase (TdT) (Fig. 6.15.1).


DISCUSSION

Precursor T-lymphoblastic leukemia/lymphoma was previously divided into T-lymphoblastic lymphoma (LBL) and Tacute lymphoblastic leukemia (ALL) in the old classifications. However, this new designation has been adopted by both the Revised European-American Lymphoma (REAL) classification (1) and the World Health Organization (WHO) classification (2), because T-LBL and T-ALL are morphologically identical and clinically similar.

LBL was originally called Sternberg sarcoma and was first described by Smith et al. (3) as a T-cell lymphoma derived from thymic lymphocytes. Barcos and Lukes (4) further defined its morphologic and clinical characteristics and considered it a distinct clinical immunopathologic entity. LBL was also called convoluted T-cell lymphoma because its nuclei are convoluted in most cases.
In the Working Formulation of non-Hodgkin Lymphoma, LBL was divided into the convoluted and nonconvoluted subtypes (5).


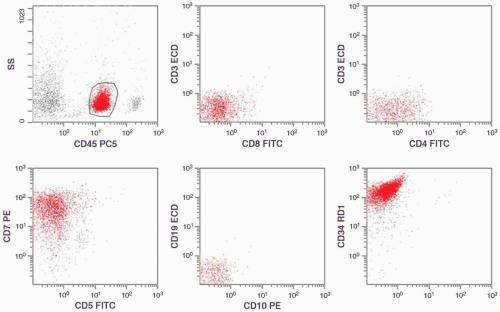
FIGURE 6.15.1 Flow cytometric histograms show that the tumor cells react only to cluster of differentiation (CD)7 and CD34 with low percentages of CD3/CD4 and CD3/CD8. CD5, CD10, and CD19 are negative. SS, side scatter; PC5, phycoerythrin cyanin 5; ECD, phycoerythrin-Texos Red; PE, phycoerythrin; RD1, rhodamine; FITC, fluoresein isothiocyanate.

In children, B-ALL is composed of approximately 85% of ALL cases, whereas T-ALL is identified in about 15% of ALL patients (6,7).


Morphology

The typical morphologic feature of LBL is the presence of a “starry sky” histologic pattern due to the presence of numerous tangible-body macrophages as a result of accelerated apoptosis (Fig. 6.15.2). Mitosis is also prominent (Table 6.15.1). This histologic pattern is indistinguishable from that of Burkitt and Burkitt-like lymphoma. However, these two entities can be differentiated by their cytology (Table 6.15.2). Cells from LBL are intermediate in size with scanty cytoplasm, which shows no vacuolation in imprints. Their nuclei are usually convoluted, containing dusky chromatin and inconspicuous nucleoli. However, LBL may also manifest as a nonconvoluted form or an atypical pleomorphic form (8). In touch preparations, LBL reveals an L1/L2 morphology (9). Cells from Burkitt and Burkitt-like lymphoma
are medium-sized with abundant pyroninophilic cytoplasm, which is deeply basophilic and often vacuolated in imprint preparations. Their nuclei are round or ovoid, containing clumped chromatin and multiple nucleoli in tissue sections (10). Touch preparations of a lymph node may show the L3 morphology with more immature-looking chromatin than in tissue sections. In case of doubt, immunophenotyping is helpful; LBL is predominantly of T-cell origin, but Burkitt and Burkitt-like lymphoma are exclusively of B-cell type.


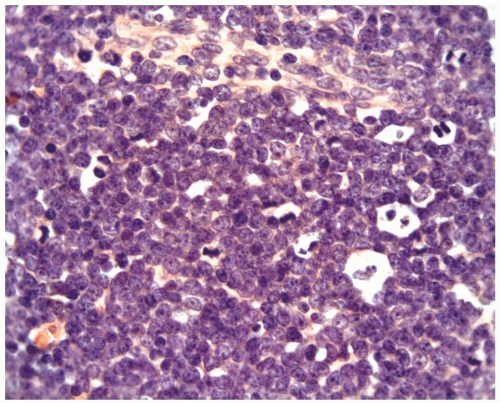
FIGURE 6.15.2 Lymph node biopsy shows a “starry sky” histologic pattern with tangible-body macrophages and mitotic figures in the vacuoles. Hematoxylin and eosin, 60× magnification.


TABLE 6.15.1


Characteristic Morphologic Features of Lymphoblastic Lymphoma


Histologic pattern


Diffuse lymphoid infiltration on a “starry sky” background


Cytology


Small to intermediate size, scanty cytoplasm, convoluted nuclei, dusky chromatin, and inconspicuous nucleoli


Specific features


“Starry sky” pattern and convoluted nuclei with a high mitotic rate


LBL and T-ALL are considered the tissue and leukemic phases of the same disease. Their distinction is rather arbitrary, depending on the distribution of the tumor cells: LBL is mainly in the soft tissue, but ALL is predominantly in the blood and bone marrow (11). However, LBL may have a leukemic phase with bone marrow involvement. On the other hand, ALL may also involve lymph nodes, particularly the mediastinal lymph node. The arbitrary cutoff point for the distinction of these two entities is 25% of lymphoblasts in the bone marrow, above which is designated ALL; otherwise, it is considered LBL with bone marrow involvement (12). Immunophenotyping does not help in their distinction, because their phenotypes are essentially identical. The lymphoblasts in T-ALL show either L1 or L2 morphology (Fig. 6.15.3), whereas L3 is always of B-cell lineage.


TABLE 6.15.2


Comparison of Lymphoblastic Lymphoma and Burkitt Lymphoma


Lymphoblastic Lymphoma


Burkitt Lymphoma


High incidence group


Children


Children


Clinical presentation


Mediastinal mass


Jaw or abdominal lesion


Mitotic rate


High


High


“Starry sky” pattern


Less prominent


More prominent


Cell size


Small to intermediate


Intermediate to large


Cytoplasm


Scanty, pale blue, no vacuoles


Abundant, dark blue, vacuolated


Nuclear shape


Usually convoluted


Round to ovoid


Chromatin pattern


Finely speckled


Clumped


Nucleoli


Inconspicuous


Multiple, distinct


FAB type


L1/L2


L3


Phenotype


Predominantly T cell


Exclusively B cell


Cytogenetic aberration


Not specific


t(8;14), t(8;22), or t(2;8)


EBV related


No


Yes


EBV, Epstein-Barr virus; FAB, French-American-British.


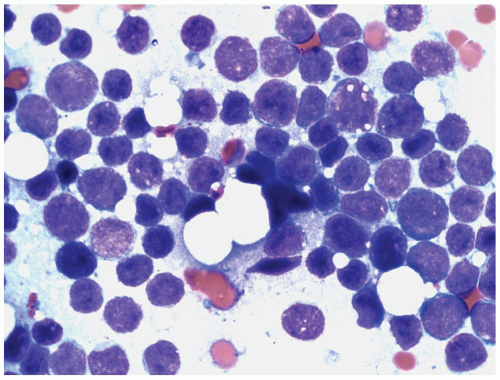
FIGURE 6.15.3 Bone marrow aspirate shows many lymphoblasts with different sizes, immature chromatin pattern, and inconspicuous nucleoli. A few lymphoblasts reveal vacuolated cytoplasm. Wright-Giemsa, 100× magnification.

Cytochemically, the lymphoblasts are periodic acid-Schiff positive, but are negative for myeloperoxidase, as well as for specific and nonspecific esterases. T lymphoblasts may also show focal acid phosphatase staining (2).


TABLE 6.15.3


Immunologic Classification of T-Cell ALL


CD1


CD2


cCD3


sCD3


CD4


CD5


CD7


CD8


TdT


Pre-T


+


+


+


Early cortical


+ (75%)


+


+ (90%)


+


+


Late cortical


+


+


+


+ (25%)


+ (90%)


+


+


+ (90%)


+


Medullary


+


+


+


±


+


+


±


±


CD, cluster of differentiation; TdT, terminal deoxynucleotidyl transferase; c, cytoplasmic; s, surface.


Immunophenotype

The traditional immunologic classification divides T-cell ALL into four immunophenotypes (Table 6.15.3) (7). The pre-T-cell phenotype expresses only CD7, cytoplasmic CD3, and TdT without other T-cell antigens. The early cortical phenotype shows CD2, CD5, CD7, and strong TdT. The late cortical phenotype reveals CD1, CD2, CD5, CD7, and dual CD4/CD8 with minimal surface CD3. The medullary phenotype shows CD2, CD3, CD5, CD7, and segregated CD4 or CD8. TdT is not commonly expressed in this phenotype. Cytoplasmic CD3 is expressed in all stages (13). The late cortical phenotype is most commonly encountered, followed by the early cortical phenotype. However, ALL immunophenotypes frequently do not correlate with recognized stages of normal lymphocyte maturation and may not conform to a maturation arrest model. In fact, the common diagnostic feature for T-cell neoplasms is either loss or aberrant expression of T-cell antigens (7,14). The U.S.- Canadian Consensus Recommendation Group indicated that the coexpression of cytoplasmic CD3 and TdT/CD34 alone is diagnostic for T-ALL (15). The phenotypic features of adult T-ALL are similar to those of childhood T-ALL, but human leukocyte antigen-DR (HLA-DR) and CD10 are more frequently positive in adults than in children (13).

On the basis of therapeutic response and prognosis, most authors consider it unnecessary to divide T-ALL into multiple subtypes. The general consensus is either to divide it into pre-T-cell and T-cell ALL or not to divide T-ALL into any subtypes (9,16,17).

However, individual markers may be used to predict the prognosis. Two study groups found that T-ALL cases that expressed CD10 had better prognosis than those without CD10 expression in terms of remission rate and eventfree survival (18,19). CD3 positivity associated with an abnormal karyotype, in contrast, was reported to be a significant adverse risk factor (20). Another report showed statistically significant correlation between the CD2 antigen expression frequency and eventfree survival (6). The comparison of ALL cases with different maturation phenotypes showed no statistical significance in terms of therapeutic response and prognosis (21,22). The coexpression of myeloid markers in T-ALL cases was reported to show a worse prognosis than those without (23,24). This conclusion, however, was not confirmed by other studies (25).

Most cases of LBL are of thymic origin, with approximately one half of the T-cell cases corresponding to common thymocytes and one fourth each to early thymocytes and late thymocytes (12,26). Immature B cell (pre-pre-B cell and pre-B cell), mature B cell, and natural killer (NK) cell types have also been reported (8,11,12,26, 27, 28, 29, 30 and 31). Sheibani et al. (27) divided LBL into five groups: LBL with T-cell phenotype (T-LBL), T-LBL with expression of common ALL antigen (CALLA), T-LBL with expression of NK cell-associated antigens, LBL with pre-B cell phenotype and B-LBL (Table 6.15.4). These immunophenotypes show some clinical correlations, such as the absence of mediastinal mass in the pre-B-cell and B-cell phenotypes and the aggressive clinical course seen in NK-associated antigen phenotypes (27,29,30). However, the NK-associated antigen phenotype is considered to be blastic NK-cell lymphoma/leukemia by other studies (32). Skin involvement is more frequently seen in the CALLA-positive phenotype (28,33), and skin and lytic bone lesions occur more often in the immature B-cell phenotype (8,11,28).

Among all markers, TdT is most useful because it is present in almost all cases of LBL (except for mature B-cell type) and is seldom, if ever, seen in other lymphomas (Fig. 6.15.4) (11,27). In the REAL classification, TdT positivity
is only listed in precursor T- and precursor B-LBL and/or leukemia (1). Therefore, a positive TdT reaction may exclude the diagnosis of Burkitt lymphoma. The reactivities of T-cell monoclonal antibodies depend on the stage of thymocytes to which the tumor cells are related (34). Generally, CD2 is consistently positive in all study series, and CD1 is specific for the common thymocyte stage (11,26,27). The reactivities of CD4 and CD8 are usually used as the criteria for stage identification: early thymocytes are CD4−, CD8−; common thymocytes are CD4+, CD8+; and late thymocytes are CD4+, CD8− or CD4−, CD8+.

Only gold members can continue reading. Log In or Register to continue

Stay updated, free articles. Join our Telegram channel

Aug 2, 2016 | Posted by in HEMATOLOGY | Comments Off on Clinical Application

Full access? Get Clinical Tree

Get Clinical Tree app for offline access