Introduction
This chapter describes the physics quality assurance (QA) program for the proton pencil beam scanning (PBS) gantry of the Hitachi ProBeat machine (Hitachi America, Ltd., Tarrytown, NY) at the Proton Therapy Center University of Texas MD Anderson Cancer Center (UT MDACC PTC), which has been in clinical use since May 2008. This QA program has two components, namely machine QA and patient treatment field–specific QA. The machine QA program is designed to test the functionality of the various components of the delivery system so as to ensure that safe and accurate delivery of the dose to all the patients treated with the machine. The patient treatment field–specific QA is designed to assure that the delivered dose and planned dose distributions for the specific treatment plan for the patient and fields in that plan are in agreement within acceptable tolerance limits. These QA programs were designed by using the recommendations from the International Commission on Radiation Units and Measurements Report 78 and American Association of Physicists in Medicine TG-40 report on the comprehensive QA program for radiation oncology and with the consideration of practicality and effectiveness of the QA checks to assure safe and accurate treatment delivery. The objective of the QA program for the PBS proton beam is to assure the accuracy or constancy of the following delivery system components:
- 1.
dose monitor calibration
- 2.
energy or range of the individual spots
- 3.
spot depth dose distribution
- 4.
spot lateral fluence and dose profiles
- 5.
spot positioning
- 6.
gantry and couch isocentricity
- 7.
x-ray and radiation isocenter coincidence
- 8.
couch translation
- 9.
x-ray imaging system functionality
- 10.
patient treatment field dose distribution
Items 1 through 9 constitute the machine QA program, and item 10 is the patient treatment field–specific QA program. Various tasks in the QA program for the scanning proton pencil beam gantry at UT MDACC PTC are summarized in Table 6.1 and are described in detail in the following sections. The QA programs at other centers are described briefly using the information available in the published literature.
| Quality Assurance Check | Frequency | Tolerance (±) |
|---|---|---|
| X-ray, laser, and couch alignment | Daily, monthly, annually | 1 mm |
| Proton pencil beam range constancy | Daily, annually | 1 mm |
| Spot position accuracy | Daily, annually | 1 mm |
| Spot size constancy | Daily, annually | 1 mm or 10% |
| Volumetric dose constancy | Daily, monthly, annually | 3% for daily, 2% for monthly and annual |
| Couch rotation isocentricity | Weekly, monthly, annually | 1 mm |
| Couch translation | Monthly, annually | 1 mm |
| Snout translation | Monthly, annually | 1 mm |
| Gantry isocentricity | Monthly, annually | 1 mm |
| Proton field and x-ray field coincidence | Monthly, annually | 2 mm |
| Patient imaging and analysis system shift calculation accuracy | Monthly | 1 mm |
| Radiation vs. mechanical isocenter coincidence check | Monthly, annually | 1 mm |
| Output as a function of gantry | Monthly, annually | 2% |
| Dose monitor calibration using IAEA TRS 398 protocol | Annually | 2% |
| Daily and monthly QA dosimetry system baseline verification | Annually | 2% |
| Dose and MU linearity and Dynamic MU delivery constancy | Annually | 2% |
| Validation of inverse-square factor | Annually | 2% |
| Integral depth dose constancy | Annually | 2% |
| X-ray imaging system: kVp accuracy | Biennial (once in every 2 years) | 10% |
| X-ray imaging system: HVL | Biennial | >2.3 mm @ 80 kV |
| X-ray imaging system: timer accuracy | Biennial | 5% |
| X-ray imaging system exposure reproducibility | Biennial | Coefficient <0.005 |
| X-ray imaging system: mA linearity | Biennial | <10% |
| X-ray imaging system: output constancy | Biennial | 20% |
| X-ray imaging system: field light vs. x-ray alignment | Biennial | 2% of Source to Image Distance |
| X-ray imaging system: image quality | Biennial | Consistency with baseline |
| X-ray imaging system: safety, dead man switch, 5 minute time, radiation warning sign, and door interlock | Biennial | Functional |
| Delivery system safety interlocks: beam pause, in-room beam stops, facility beam stop, beam delivery indicator light, radiation monitors, door interlock, audiovisual monitoring, gantry rotation sensor, room clearance push button, room motion sensor | Annually | Functional |
| Patient treatment field–specific dose distribution: agreement between plan and measurement | Before start of treatment | Gamma pass rate for 3% dose and 3-mm distance agreement >90% |
| Patient treatment field–specific spot positions: agreement between planned and delivered spot positions and spot monitor units | Before start of treatment and after each field delivery | 1 mm for mean deviation in spot position and 1% for mean deviation in spot MU |
Machine quality assurance
The machine-focused QA program at PTC has daily, weekly, monthly, and annual components. The original QA program at PTC was derived from our passive scattering proton beam QA program described in a paper by Arjomandy et al. as well as from the original commissioning of the spot scanning beamline described in a paper by Gillin et al. However, over the years, we have adapted this program, especially the daily QA and monthly QA, based on our initial experience. Therefore, more emphasis is put on those two subjects.
The daily QA is performed once a day before treatment and takes about half an hour. The monthly QA is done within one calendar month. The annual QA is performed within 365 days and is the most comprehensive among the three.
Daily quality assurance
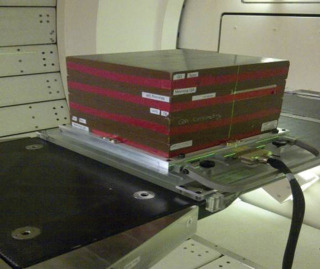
The goal of the daily QA is to verify: (1) the dosimetric characteristics of the proton pencil beam; (2) proper functioning of the dose monitor chambers; (3) proper functioning of the spot position monitor; (4) proper functioning of the imaging system used for patient setup; (5) seamless communication between the electronic medical record (EMR), Patient Positioning Image and Analysis System (PIAS), and treatment delivery system; and (6) proper functioning of all mechanical and safety aspects of the treatment machine before patient treatment. Our scanning beamline is capable of delivering 94 different energies. Because it is nearly impossible to check the dosimetry features of proton PBS for all these energies daily, a smart QA program had to be developed. The dosimetric checks have three parts: range check, spot position check, and volume-dose check. The dosimetric checks are performed using the Keithley Tracker detector (Fluke Biomedical, Cleveland, OH). It consists of an array of five single parallel-plate ion chambers (Ø = 2.5 cm × 0.8 cm), which are separated by 10 cm and are arranged as a cross. The tracker is snapped into a jig placed tightly on the Hitachi tabletop, as shown in Fig. 6.1 .
All daily QA tasks are performed through our EMR and verify system MOSAIQ using a QA patient, thus providing the same data flow as treating a patient. When running the QA checks through MOSAIQ, the Hitachi Treatment Control System, Zenkei, is switched to treatment mode, providing the same conditions as real patient treatment.
X-ray, laser, and couch alignment check
There are two objectives for this test: testing communication and data flow as well as checking the functionality of the x-ray imaging system. In this procedure, a stored plan in MOSAIQ is sent to the Hitachi HMI (Hitachi machine interface) computer. This will initiate the MOSAIQ site setup task, which sends the two-dimensional (2D) orthogonal reference images from MOSAIQ to the Hitachi imaging system, which is called PIAS (Patient Positioning Image and Analysis System). In the case of actual patient treatment, the reference images are compared with a set of two setup verification x-ray images. In the case of the QA patient, the purpose of sending the reference image from MOSAIQ to PIAS is to ensure that two systems are communicating as expected. Fig. 6.2 shows the x-ray setup consisting of an acrylic jig and a Varian On-Board Imaging (OBI) cube that has a 2-mm metal sphere in its center. The imaging cube is tightly secured to the jig, which is also tightly snapped onto the treatment couch using a ball-and-bearing screw system. This setup ensures reproducible placement of submillimeter accuracy of the center of the x-ray imaging cube. The couch is then moved to its expected calibrated coordinates ( x, y, and z ) using the Hitachi couch control pendant. This brings the metal sphere into the gantry isocenter, and the room lasers should be aligned to the crosshair in the cube if no change has taken place in the couch calibration and laser alignment. If a misalignment outside the 1-mm tolerance is observed, the cause of the misalignment is investigated, and corrective actions have to be taken before the patient treatment can start. A major reason for misalignment has been found to be a collision between the treatment head and the couch that affects the couch positioning calibration.

During routine daily QA, the location of the center of the imaging cube is compared with the center of the x-ray system using two orthogonal x-rays. The daily tolerance level for this test is 1 mm, which is the radius of the sphere. The PIAS system has a pixel size of 0.3 mm, but it allows shifts in increments of 0.1 mm (therefore, some shifts do not move the image). If the tolerance is exceeded, but within 2 mm, the covering medical physicist will be notified, and further tests will be required at a later time. If those tests confirm the deviation, a Hitachi engineer will have to recalibrate the couch coordinates. As a side note: the absolute couch coordinates are actually more important for correct QA setup to get accurate dose readings (see subparagraphs later) because if the table origin has shifted, the setup of the ionization chamber will not be correct. For patient setup, however, this is will not be a problem because the patient’s daily position is shifted according to the result of the x-ray and is not based on absolute couch coordinates. The daily shifts are recorded, and the two orthogonal images are sent from the PIAS system via couch pendant back to MOSAIQ. The correct data transfer of those images is part of the daily QA check. In addition, safety tests are performed every day. This includes the check of the audio system, video-TV system, the room search audio warning signal, the radiation monitor (inside/outside), the beam pause button, as well as the door interlock.
Proton pencil beam range check
The way the range check is performed has changed over time, but it can be divided into two periods: before 2016 and after 2016. The measurement devices and the idea behind the measurement remained the same: A different energy spot pattern has been used on each weekday. The corresponding proton pencil beam ranges vary from 28.8 to 5.1 cm. The amount of buildup (Solid Water, Gammex, RMI) is fixed for a particular weekday for the proton beam checked on that day.
Range check before 2016
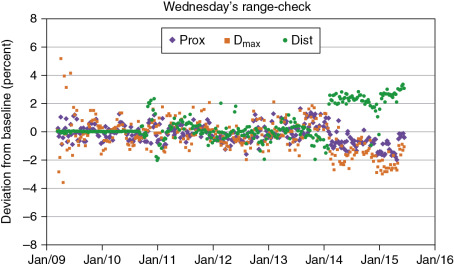
The original range check was a convolution of positioning as well as dose output. Thus dose readings were obtained, but not actual ranges. This test consisted of that monoenergetic spots that are centered to the positions of the ion chamber. Their energies were selected in such a way that dose values at a depth close to the Bragg peak and at two more depths, one proximal to the Bragg peak and other distal to Bragg peak, were measured. The proximal dose and D max were an average of two chamber readings, whereas the distal one was only from one ion chamber. The method was able to detect output changes, setup shifts, and range changes (see the green symbols in Fig. 6.3 from February 2014 to December 2015).
Range check since 2016
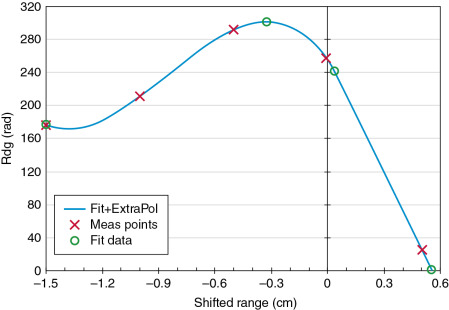
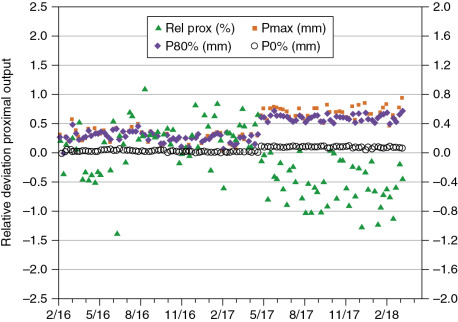
Similar to the procedure used before 2016, each weekday, a different set of energies and a different amount of buildup are used. However, the revised range check now uses five different energies daily compared with three energies before. In addition, the spots are not delivered on a single point over the ion chamber as was done before 2016, but instead on a 3 × 3 cm 2 square using optimized weights in such a way that the dose within this square is uniform. Thus this new pattern makes the dose reading not sensitive to any phantom setup variation. The five monoenergetic energies resulting in different dose readings since the buildup remain constant for each 3 × 3 cm 2 square delivery, and the measurement depth is always close to the Bragg peak. An example of this test is shown in Fig. 6.4 . The first derived data point is used as a verification of the output check. The tolerance for this is 3%. Then, from the first four dose readings, a third-order polynomial fit is performed, connecting all four measured points with a line. This polynomial fit creates a maximum value that can be used to derive its position (second green circle) as well as the maximum dose value. From the dose maximum, the 80% dose value (third green circle) and the 0% dose values (fourth green circle) are estimated by interpolation between the fourth and fifth measured dose values.
The new method allows measuring the ranges indirectly by deriving them from charge readings. The trend of those measurements is shown in Fig. 6.5 . The output has been within 1% over more time shown. The changes in the positions Pmax, P80%, and P0% have remained constant over the last 2 years, being within 0.6 mm of the baseline values. However, in May 2017, a noticeable jump in the trend was observed. This was caused by the installation of a new primary dose monitor whose water-equivalent thickness differed from the one it replaced by 0.2 mm. Because the change was rather small, the baseline data were not changed.
Spot position accuracy check
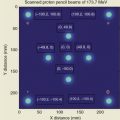
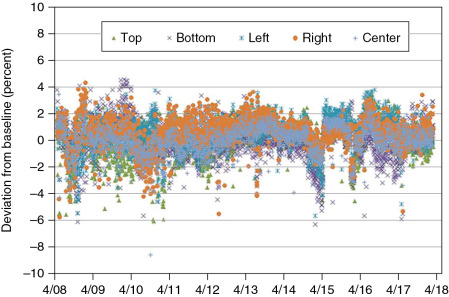
For this test, five monoenergetic spots are delivered at the central axis and at ±10 cm along the x -axis and along the y -axis. The highest available energy of 221.8 MeV is used because it provides the smallest spot size available for our scanning proton pencil beam. This spot size, however, is increased by 15% because of the use of a 20-cm solid water buildup, which is used to increase the dose reading by more than 50% to about 112 cGy. The spot position check has been performed since 2008 on every treatment day, and its baseline value was not changed until May 2017. The change was necessary because of the replacement of the primary dose monitor, which was built using thinner copper foils and thus resulted in a reduced spot size of about 10%. This change in spot shape increased the dose reading by 7% after replacement of the hardware. This system is capable of detecting both spot size changes as well as spot position change, as shown in Fig. 6.6 and Table 6.2 . Although the overall deviations in Fig. 6.6 are fairly constant, there are, however, some jumps, for example, October 2010, February 2011, August 2012, August 2013, March 2015, and February 2016. Most of those deviations are attributed to misalignment of the absolute couch coordinates after a collision between nozzle and couch pedestal, resulting in a drop of dose value because the detector is not anymore located at the maximum dose value. This is corrected by recalibrating the couch by the Hitachi engineer.
| Chamber Position | |||||
|---|---|---|---|---|---|
| Top | Bottom | Left | Right | Center | |
| Average | 0.1% | 0.0% | 0.3% | 0.5% | 0.0% |
| STD | 1.3% | 1.4% | 1.2% | 1.2% | 1.1% |
| Max | 3.5% | 4.6% | 3.8% | 4.3% | 3.6% |
| Min | −6.1% | −6.3% | −5.7% | −5.8% | −8.6% |
Volumetric dose check
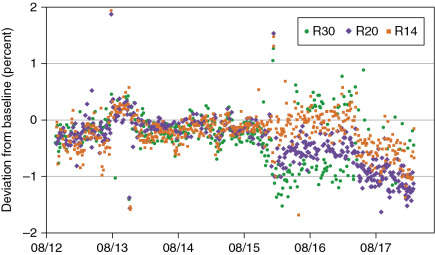
The volumetric dose check was initially done as part of the weekly dose output check using a cube-like water tank. However, because this required an additional setup, we decided in 2012 to use the same tracker detector (see previous paragraphs) for this test as well. We used three different volumetric spot scan patterns (all using a field size of about 10 × 10 cm 2 and a spread-out Bragg peak [SOBP] of 10 cm) with maximum ranges of 30.6, 20.0, and 14 cm. The first pattern is our standard calibration file that delivers 1 cGy/monitor unit (MU) as described in the paper by Gillin et al. Other files are derived from different versions of the Eclipse treatment planning system (TPS). Every day, one volumetric spot pattern file is used for the volumetric dose check, and over the course of the week, each pattern is delivered at least once. Fig. 6.7 below shows the deviation in the daily volumetric dose check results. All data points are within ±2%. However, there were some outliers in August and December 2013, when the dose monitor cable was changed. In addition, there were two dose monitor exchanges, one in January 2016 and one in May 2017. The first change resulted in a different energy response, especially for the R30 file (purple symbols) that now exhibits a larger fluctuation, as well as an offset to the R20 file (yellow symbol). Again, the baseline data were not changed over the 5-year period.
Weekly machine quality assurance checks
As part of the weekly machine QA check program, all measurements from daily QA are reviewed by a board-certified medical physicist. In addition, a couch rotation isocentricity check is also performed once a week as described below.
The Hitachi couch rotation axis is located away from the gantry rotation plane. An isocentric couch is emulated by translating in two axes ( x and y ) and rotation of the couch head. This requires a fine interplay of all three rotations (and their motors) to achieve an isocentric rotation. Any collision between the gantry head and the couch can result in a failing isocentric rotation. Because this is a sensitive parameter, this test is performed weekly. The test requires the gantry to be at 0 degrees and the OBI cube (see Fig. 6.2 ) to be aligned at the x-ray isocenter. Then the couch is rotated to 90 and 270 degrees, and an x-ray image is taken. The deviations in the x and y directions of the cube’s radiopaque steel ball called BeeBee (BB) with the couch are recorded. The tolerance for deviation is ±1 mm.
Monthly quality assurance
The goal of the monthly QA is the same as the daily QA, namely, to verify constancy of dosimetric data, x-ray imaging system alignments, and safety checks. Unlike the daily QA, the monthly QA is performed by a board-certified physicist, and it uses different detector systems: IBA Matrixx 2D ion chamber array and EBT3 film to complement the daily QA checks. The original monthly QA program was derived from the program for the passive scattering proton beamlines at the PTC that went into operation 2 years before the scanning proton beam gantry became clinical. The monthly QA program consists of mechanical checks, gantry isocentricity and couch isocentricity checks using an x-ray imaging system, together with the PIAS system, as well as x-ray versus radiation isocenter check and dose output as a function of gantry angle.
Mechanical quality assurance checks
The couch translation is checked by moving it to predefined positions (−10, −3, 0, +3, +10 cm) in x, y, and z directions. The position of the laser is measured using a ruler, and the deviations from the expected shift are recorded. The tolerance is less than 1 mm, which was always the case during the time of operation of the scanning beam gantry. The movable snout of the PTC is checked similarly using a ruler and laser. The snout position is set to 38, 23, and 8 cm, and the actual position is recorded. The deviation was always within 1 mm of the expected value. In addition to the gantry angle, the six-dimensional couch, as well as the snout rotation, is measured using a spirit level.
Gantry isocentricity check with x-ray imaging system
For this check, the jig shown in Fig. 6.2 is used to set up the Varian OBI cube. The table is moved to the expected reference coordinates. Then a pair of orthogonal x-rays are taken at the reference gantry angle used for patient setup of 0 degrees. There should be no additional couch shift required unless a collision between gantry and table occurred or work was performed on the x-ray imaging system. The couch location is recorded; the gantry is rotated to 90, 180, and 270 degrees; and x-ray images are repeated after the table mechanical couch adjustment was applied. The mechanical isocenter adjustment was implemented by Hitachi in the design phase of the PTC to meet the requirement of mechanical isocenter being within 0.5 mm. This could only be achieved by making software corrections to the couch called mechanical couch adjustments. The tolerance of the deviation of the isocenter position with the gantry angle is ±1 mm.
Couch rotation isocentricity check
This test is also carried out as part of the monthly QA following the same procedure described in “Weekly Machine Quality Assurance Checks” in this chapter. This is an independent check of the same check done once in a week.
Patient position image analysis system shift calculation accuracy check
The PIAS software allows a couch shift of up to 3 cm determined from the analysis of the acquired x-ray images by the software. This test is to verify whether an intended shift of 3 cm is actually mechanically performed by the couch movement control system as well as whether the calibration of the PIAS system has not changed. After the BB in the Varian OBI cube is aligned with the PIAS crosshair, the couch is shifted in all three directions by a specific distance under 3 cm, and an orthogonal x-ray image set is acquired. The shift to bring the BB back to the center of the PIAS crosshair is determined and compared with the applied couch shift. The obtained shift is always about 1 mm more compared with the expected shift because the image acquisition of the x-ray panel is 2D, but the shift of the BB is done in 3D, and the cube is shifted away, thus resulting in an increased value.
Radiation versus mechanical isocenter coincidence check
To check the coincidence between radiation isocenter and x-ray imaging system isocenter, a spot pattern is delivered to the isocenter location into the aligned Varian OBI QA cube described in “Gantry Isocentricity Check with X-Ray Imaging System” in this chapter. Thus the metal BB of the Varian cube is located at the x-ray isocenter, and the spot penetrates the cube and leaves a dose variation on the radiographic EBT3 film (see Fig. 6.8 ). The test is repeated for all cardinal angles. The films are scanned using a flatbed scanner Epson Expression 10000XL, and films are analyzed using IBA OmniPro software. The BB should be within 1 mm of the radiation isocenter. However, one should remember that the spot delivery is performed by deflecting the beam using magnet fields; thus, the actual spot position can change from each spill. To determine the actual location of the delivery, we use the spot analysis tool, which is described in papers by Li et al. and Mackin et al., in our QA software called HPlusQA to determine the deviation of the delivered spot position from the planned spot positions, as shown in Fig. 6.9 . A comparison of the actual delivered spot positions with the film data provides a more meaningful comparison of whether the difference of radiation and x-ray imaging system isocenter locations is within tolerance.

