and height are dynamic and anticipated to change as part of a child’s normal growth and development. Moreover, unlike other growth parameters, BMI does not simply increase from birth to adulthood. In fact, BMI is typically expected to decrease beginning in the second year of life, reaching a nadir at the age of 5 to 6 years, and then increase steadily throughout later childhood and adolescence. The vertex of this v- or u-shaped pattern in BMI trajectory is termed “adiposity rebound,” and children who experience adiposity rebound prior to 4 years of age are at increased risk of obesity later in life.4
are publicly available (https://www.cdc.gov/healthy-weight/bmi/calculator.html); many electronic medical records also contain automated functions for calculating BMI percentiles for pediatric patients.
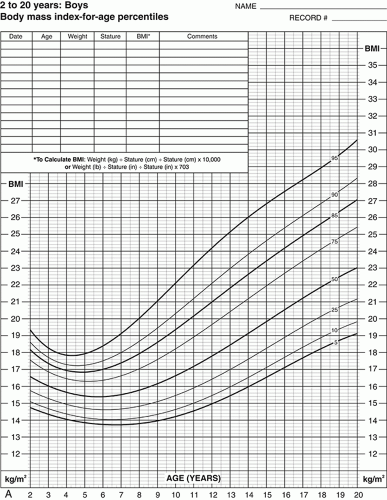 FIGURE 11.1 2002 Centers for Disease Control and Prevention body mass index-for-age growth charts. A, Boys. B, Girls. (Reprinted from Centers for Disease Control and Prevention. Clinical Growth Charts. https://www.cdc.gov/growthcharts/clinical_charts.htm#Set1) |
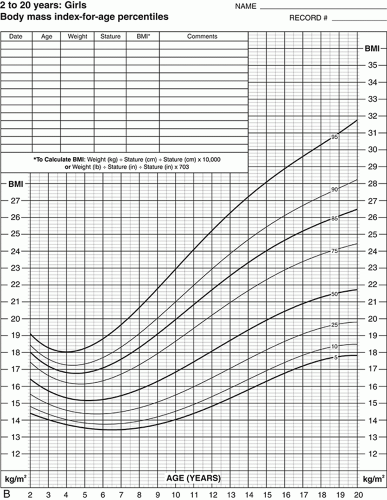 FIGURE 11.1 2002 Centers for Disease Control and Prevention body mass index-for-age growth charts. A, Boys. B, Girls. (Reprinted from Centers for Disease Control and Prevention. Clinical Growth Charts. https://www.cdc.gov/growthcharts/clinical_charts.htm#Set1) Cond’d |
of the age- and sex-appropriate 95th percentile or an absolute BMI ≥35 kg/m2) and Class 3 (BMI ≥140% of the 95th percentile or an absolute BMI ≥40 kg/m2) to coincide with adult definitions, as well as criteria for MBS in adolescents.1,2,6 Figure 11.2 contains specialized growth charts that can be used to determine pediatric obesity severity and class.5
TABLE 11.1 Classification of Pediatric Body Mass Index Categories | ||||||||||||||||||||||||||||||
|---|---|---|---|---|---|---|---|---|---|---|---|---|---|---|---|---|---|---|---|---|---|---|---|---|---|---|---|---|---|---|
| ||||||||||||||||||||||||||||||
T2D, cardiovascular disease, and premature death in adulthood.3,5,10 The risk for the development of many weight-related conditions in childhood (Figure 11.4) increases with obesity severity. Furthermore, pediatric obesity is associated with significant reductions in quality of life.11 As a result of obesity and the weight-comorbidities, a decline in life expectancy is projected, with today’s youth living shorter lives than their parents.12 Thus, the development of skills required for the compassionate and comprehensive care of youth with overweight and obesity, including an understanding of the complexities of the disease and evidenced-based treatment recommendations, is critical for all HCPs who care for children.
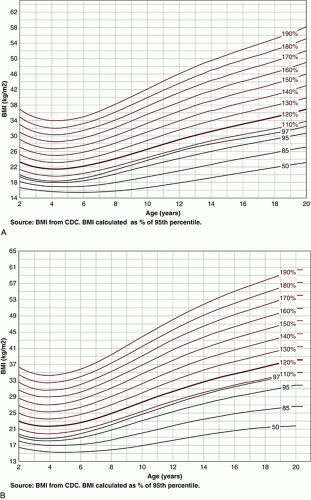 FIGURE 11.2 Modified Centers for Disease Control and Prevention (CDC) body mass index (BMI) growth curves for severe obesity in boys (A) and girls (B). (Reprinted with permission from Kelly AS, Barlow SE, Rao G, et al. Severe obesity in children and adolescents: identification, associated health risks, and treatment approaches. A scientific statement from the American Heart Association. Circulation. 2013;128:1689-1712.) |
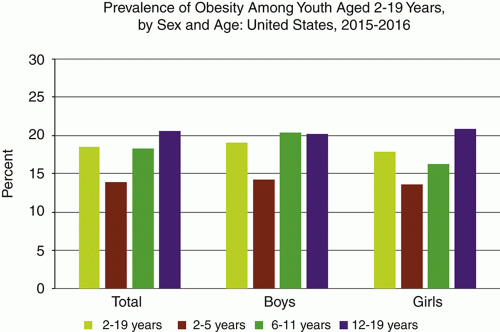 FIGURE 11.3 Prevalence of obesity among youth aged 2 to 19 years, by sex and age: United States, 2015-2016. (Adapted from Hales CM, Carroll MD, Fryar CD, Ogden CL. Prevalence of Obesity Among Adults and Youth: United States, 2015-2016. NCHS Data Brief. 2017;(288):1-8. Data from the National Health and Nutrition Examination Survey (NHANES).) |
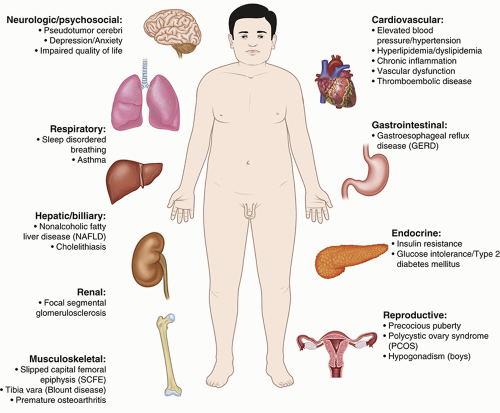 FIGURE 11.4 Health impact of obesity on children and adolescents. |
Neurodevelopmental abnormalities (e.g., developmental delay, intellectual disability, or behavioral concerns)
Phenotypic features (e.g., short stature, dysmorphic physical features, retinal dystrophy, deafness)
Associated endocrinopathies (e.g., hypogonadotropic hypogonadism leading to delayed puberty)
Significant hypotonia and feeding disorders at birth
Poor weight gain and failure to thrive during the first 2 years of life
Developmental delay and short stature and/or decreased growth velocity
Almond-shaped eyes, a thin upper lip, and small hands and feet (Figure 11.5)
with PWS should collaborate with a pediatric or adult endocrinologists as well as other specialists to ensure comprehensive care.
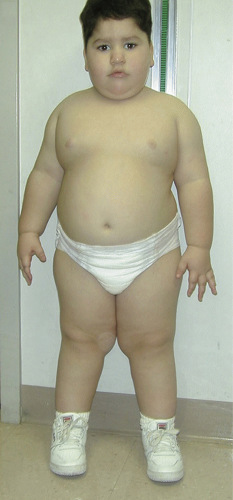 FIGURE 11.5 Typical physical features of child with Prader-Willi syndrome. Physical features associated with Prader-Willi syndrome (PWS) include severe obesity, short stature, almond-shaped eyes, a thin upper lip with a down-turned mouth, small hands and feet, and straight borders of the inner legs. (Reprinted from Angulo MA, Butler MG, Cataletto ME. Prader-Willi syndrome: a review of clinical, genetic, and endocrine findings. J Endocrinol Invest. 2015;38(12):1249-1263.) |
Progressive visual loss as a result of a retinal disorder known as rod-cone dystrophy
Dysmorphic extremities including polydactyly, syndactyly, and brachydactyly (Figure 11.6)
Renal tract abnormalities including polycystic kidney disease
Learning disabilities, developmental delay, or intellectual disability
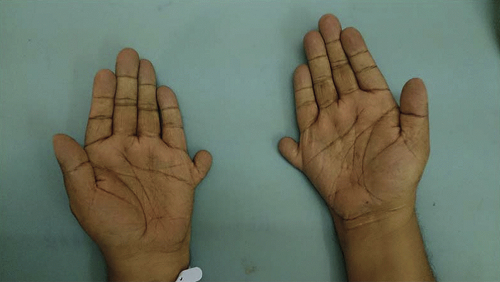 FIGURE 11.6 Brachydactyly and polydactyly in Bardet-Biedl syndrome. Individuals with Bardet-Biedl syndrome (BBS) may have dysmorphic hands and feet, including extra (polydactyly) or short (brachydactyly) digits. (Reprinted from Madireddi J, Acharya V, Suryanarayana J, Hande HM, Shetty R. Bardet-Biedl syndrome: multiple fingers with multiple defects. BMJ Case Rep. 2015;2015:bcr2015211776.) |
associated with MC4R mutations, youth with obesity but without MC4R mutations may also manifest similar but less prominent growth acceleration and hyperinsulinemia.21 Given the lack of definitive characteristics besides early-onset, severe obesity, the clinical identification of individuals with MC4R mutations may be challenging without genetic testing (see below). At this time, the mainstay of treatment for patients with heterozygous MCR4 mutations is comprehensive lifestyle modification, with the potential addition of weight loss surgery.22 The FDA recently approved setmelanotide, a selective MCR4 agonist, for the treatment of rare genetic mutations upstream of MCR4. Although treatment of MC4R mutations was not included in the initial FDA approval, the agent’s role in individuals with minor MC4R defects is promising and warrants further investigation.23
An attenuated height velocity (or a height that is shorter than anticipated according to genetic and familial potential).
Clear signs or symptoms suggestive of an endocrine disorder beyond weight gain.
Establishing rapport with the patient and family.
Identifying any underlying etiologies contributing to excess weight gain.
Screening for the presence of weight-related comorbidities.
Age-appropriate assessment of dietary, physical activity, sedentary behaviors, and sleep patterns.
Collaboratively developing and implementing an age-appropriate, family-based treatment plan that accounts for the patient/family’s readiness to change, unique values, and goals.
intellectual disabilities, and/or behavioral challenges. Youth with attention-deficit hyperactivity disorder (ADHD) are also at increased risk of obesity, particularly those not receiving pharmacotherapy.32 For youth with a history of anxiety, depression, and other mood disorders, the clinical interview should also include a history of current and previous treatments and address both behavioral therapies and medication use. A complete review of systems (including snoring/sleep disturbances, headaches, abdominal pain, menstrual irregularities, hirsutism, hip/knee/leg pain, polyuria, polydipsia, depressed mood, and anxiety) should be obtained to assist HCPs in identifying any previously unidentified weight-related comorbidities and concerns.
several decades, and mounting cross-sectional and longitudinal studies support a relation between SSB intake and weight gain during childhood and adolescence.35 Moreover, pediatric intervention studies have demonstrated that the elimination of calories from SSB leads to reductions in BMI.35 Thus, SSB intake represents a key therapeutic target when the patient and family are ready to make such changes.
TABLE 11.2 Pediatric Dietary and Physical Activity Questionnaire | ||||||||||||||||||||||||||||||||||||||||||||||||||||||||||||||||||||||||||||||||||||||||||||||||||||||||||||||||||||||||||||||||||||||||||||||||||||||||||||||||||||||||||||||||||||||||||||||||||||||||||||||||||||||||||||||||||||||||||||||||||||||||||||||||||||||||||||||||||||||||
|---|---|---|---|---|---|---|---|---|---|---|---|---|---|---|---|---|---|---|---|---|---|---|---|---|---|---|---|---|---|---|---|---|---|---|---|---|---|---|---|---|---|---|---|---|---|---|---|---|---|---|---|---|---|---|---|---|---|---|---|---|---|---|---|---|---|---|---|---|---|---|---|---|---|---|---|---|---|---|---|---|---|---|---|---|---|---|---|---|---|---|---|---|---|---|---|---|---|---|---|---|---|---|---|---|---|---|---|---|---|---|---|---|---|---|---|---|---|---|---|---|---|---|---|---|---|---|---|---|---|---|---|---|---|---|---|---|---|---|---|---|---|---|---|---|---|---|---|---|---|---|---|---|---|---|---|---|---|---|---|---|---|---|---|---|---|---|---|---|---|---|---|---|---|---|---|---|---|---|---|---|---|---|---|---|---|---|---|---|---|---|---|---|---|---|---|---|---|---|---|---|---|---|---|---|---|---|---|---|---|---|---|---|---|---|---|---|---|---|---|---|---|---|---|---|---|---|---|---|---|---|---|---|---|---|---|---|---|---|---|---|---|---|---|---|---|---|---|---|---|---|---|---|---|---|---|---|---|---|---|---|---|---|---|---|---|---|---|---|---|---|---|---|---|---|---|---|---|---|---|---|
| ||||||||||||||||||||||||||||||||||||||||||||||||||||||||||||||||||||||||||||||||||||||||||||||||||||||||||||||||||||||||||||||||||||||||||||||||||||||||||||||||||||||||||||||||||||||||||||||||||||||||||||||||||||||||||||||||||||||||||||||||||||||||||||||||||||||||||||||||||||||||
Related posts:

Stay updated, free articles. Join our Telegram channel

Full access? Get Clinical Tree


