Figure 1.1
Global prevalence of diabetes (Reproduced with permission from the International Diabetes Federation [1] ©IDF)
1.2 Diagnostic Criteria for Diabetes
The diagnostic criteria from the World Health Organization (WHO) and the American Diabetes Association (ADA) are shown in Table 1.1 [3, 4]. Glycated hemoglobin (HbA1c) concentration of ≥48 mmol/mol (6.5 %) can be used for the diagnosis of diabetes. Patients without symptoms of hyperglycemia require two different tests (e.g., fasting plasma glucose and HbA1c) with concordant results or repeat testing on another day for confirmation.
Table 1.1
Diagnostic criteria for diabetes
Impaired fasting glucose and impaired glucose tolerance (WHO/IDF) | Prediabetes (ADA) | Diabetes mellitus (WHO/IDF and ADA) | |
|---|---|---|---|
HbA1c (%) | – | 5.7–6.4 % (39–48 mmol/mol) | ≥6.5 % (48 mmol/mol) |
Fasting plasma glucose (mmol/L) | 6.1–6.9 | 5.6–6.9 | ≥7.0 |
OGTT 2-h plasma glucose (mmol/L) | 7.8–11.0 | 7.8–11.0 | ≥11.1 |
Random glucose (mmol/L) | – | – | ≥11.1 with classic symptoms |
The WHO define impaired glucose tolerance as a 2-h blood glucose between 7.8 and 11.0 mmol/L on oral glucose tolerance test (OGTT); “impaired fasting glucose” is defined as fasting plasma glucose between 6.1 and 6.9 mmol/L. ADA criteria describe a diagnosis of “prediabetes” in which glucose tolerance, fasting glucose, or both are impaired. This also includes patients with HbA1c 39–46 mmol/mol (5.7–6.4 %). These conditions are associated with increased risk of type 2 diabetes and cardiovascular disease. Figure 1.2 illustrates the natural history of impaired glucose tolerance progressing into type 2 diabetes and the mechanisms involved [5, 6]. Approximately 25 % of people will develop diabetes within 5 years and, while lifestyle interventions can reduce the risk of disease progression, there is no international consensus regarding screening and therapies for patients with prediabetes.
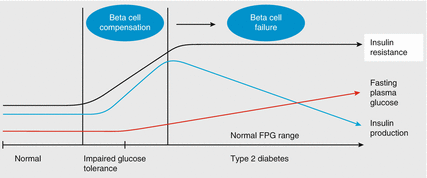

Figure 1.2
The natural history of type 2 diabetes. The key aspects in developing type 2 diabetes are insulin resistance, decreased insulin production, and increased blood glucose. With impaired glucose tolerance, beta cell compensation occurs, caused by loss of beta cell sensitivity to glucose and progressive beta cell failure. This contributes to delayed insulin secretion in response to oral glucose. FPG fasting plasma glucose (Adapted from Bailey [5] and DeFronzo and Ferrannini [6])
1.3 Glucose Homeostasis
Glucose homeostasis is normally maintained by a balance between glucose entering the bloodstream from intestinal absorption and hepatic glucose production, versus the uptake and metabolism of glucose by peripheral tissues. In the prandial state, pancreatic β-cells are stimulated to secrete insulin and glucagon secretion from alpha cells is reduced. This causes increased glucose uptake into insulin sensitive tissues namely heart, skeletal muscle, and adipose tissue. Hepatic glucose production is reduced and anabolic metabolism is promoted. In the fasting state, insulin levels are reduced and glucagon secretion is increased. Hepatic glucose production through glycogenolysis and gluconeogenesis maintains glucose levels.
The kidneys maintain homeostasis throughout by filtering and reabsorbing all glucose ensuring that no glucose is lost in the urine. 90 % of filtered glucose is reabsorbed by the high capacity sodium-glucose linked transporter 2 (SGLT2) in the convoluted segment of the proximal tubule [7]. The remaining 10 % is reabsorbed by the SGLT1 transporter in the straight arm of the descending proximal tubule.
1.4 Pathogenesis of Type 2 Diabetes
Type 2 diabetes is a complex heterogeneous disorder characterized by pancreatic β-cell dysfunction and insulin resistance. The relative contribution of each factor varies between individuals. Insulin resistance in muscle is usually the first abnormality detected [8]. Initially this signals β-cells to produce more insulin to maintain glucose homeostasis [9]. However, progressive β-cell dysfunction develops with loss of pulsatility of insulin secretion, abnormal insulin formation, loss of sensitivity to glucose stimulation, and delayed insulin secretion. β-cell loss accompanies β-cell failure and insulin production becomes inadequate, resulting in hyperglycemia. Hyperglycemia itself contributes to further β-cell dysfunction and a vicious cycle occurs. Insulin resistance is well established when impaired glucose tolerance develops (Fig. 1.2) and further decline in β-cell function leads to the development of type 2 diabetes.
The neurohumoral feedback mechanisms between β-cells and insulin sensitive tissues (heart, skeletal muscle, and adipose tissue) are not fully understood so the precise mechanism by which insulin resistance causes β-cell failure remains unknown [9]. Obesity is a major cause of insulin resistance and is associated with inflammation of adipose tissues and excess fatty acid secretion, also known as lipotoxicity which causes β-cell dysfunction. Other pathophysiological mechanisms contributing to β-cell dysfunction are islet amyloid deposition and the lack of ability to regenerate β-cells in adults [10, 11].
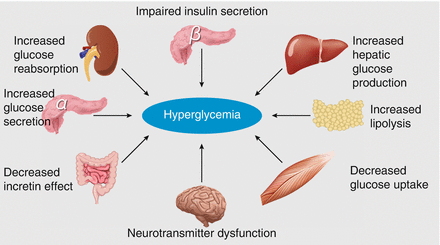
Figure 1.3 illustrates the multiple pathogenic processes contributing to hyperglycemia [7]. Hepatic glucose production is increased, skeletal muscle glucose uptake is reduced, and glucagon secretion is increased. Incretins (glucagon-like peptide [GLP-1] and gastric inhibitory polypeptide [GIP]) are insulin secretagogues released from intestinal cells in response to feeding. In type 2 diabetes, there is impaired release of incretins, which may be a secondary process rather than primary abnormality. Additionally, in the kidneys there are increased levels of SGLT2 receptors in patients with diabetes, causing increased glucose reabsorption. Normal homeostatic control is lost as increased glucose levels are absorbed into the blood and excess glucose is excreted into the urine. Gluconeogenesis in the renal cortex may further contribute to hyperglycemia [12]. There is also evidence of central neurotransmitter dysfunction with studies showing reduced inhibition within hypothalamic appetite regulation centers [7]. Research aiming to get a better understanding of the various mechanisms causing hyperglycemia and how they interact will potentially aid the identification of suitable therapeutic targets for drug development.
