Fig. 16.1
In FD-OCT, each depth scan is performed by sampling the interference pattern in optical frequency space, either with a spectrometer and a broadband light source (a) or with a photo detector and a tunable narrowband light source (b). In both cases, the reference mirror remains at a fixed position
Basic Principles
Optical coherence tomography is an interferometric technique that detects reflected or backscattered light from tissue. OCT probes the sample with a beam of light and lets the reflections interfere with a reference beam originating from the same light source. From the resulting interference signal, one can derive the reflectivity profile along the beam axis. This one-dimensional depth scan is called A-scan, in analogy to ultrasound imaging. OCT systems perform many adjacent A-scans in order to create two- or three-dimensional images of the sample. The scan speed allows video-rate imaging of three-dimensional volumes.
A-scans can be acquired either in the time domain (TD) or in the frequency domain (FD). TD-OCT systems (Fig. 16.2) were the first to be implemented [6]. These perform the depth scan based on low-coherence interferometry (LCI) which had previously been applied for one- dimensional length measurements of human eyes in vivo [9]. By using light with broad spectral bandwidth and thus low-coherence length, only backreflections from the sample with a round-trip path approximately equal to the reference path can interfere with the reference beam. This condition creates a spatial gate as wide as the coherence length of the light that selectively interrogates the backreflection from a certain depth within the sample. This coherence gate is shifted along the probing beam axis by changing the length of the reference path. Adjacent structures can be separated in a depth profile if they are further apart than the width of the coherence gate. Thus, the lower the temporal coherence of the probing light is, or the broader the bandwidth, respectively, the higher is the depth resolution.
Fig. 16.2
OCT and optical coherence microscopy (OCM) close the gap between high-resolution optical microscopy techniques (e.g. confocal microscopy) and techniques with long penetration depth (e.g. ultrasound imaging)
An FD-OCT system acquires A-scans with a fixed reference path by measuring the spectral response of the interferometer [10]. The information is then encoded as an interferogram in optical frequency space, a sum of oscillations with different periods corresponding to reflections from different depths. A Fourier transform of this interferogram reveals the reflectivity profile of the sample. The same relation between bandwidth and depth resolution as in TD-OCT is also valid for FD-OCT.
Two basic approaches exist for implementing FD-OCT. One can illuminate the interferometer with broadband light and separate the spectral components with a spectrometer at the output [11, 12] (Fig. 16.3a). This method is termed spectral domain–OCT (SD-OCT). Alternatively, one can probe with different optical frequencies sequentially and measure the power at the output with a single photo detector [13–15] (Fig. 16.3b). With a tunable narrowband light source, one performs a sweep over a broad range of optical frequencies, which led to the term swept source–OCT (SS-OCT).
Fig. 16.3
Typically, an OCT system is based on a Michelson interferometer that directs a fraction of the light to the sample and the remaining part to a reference mirror. The backreflections from both arms interfere on a photo detector. In TD-OCT, the depth scan is performed by translating the reference mirror
Optical coherence tomography is often described as the optical analogue to ultrasound, as it probes the sample with light instead of sound and maps the reflectivity as a function of depth. The main strength of OCT is the depth resolution or axial resolution which is linked to the light source spectral shape. Typically, the axial resolution is around 5–10 μm in tissue, even though depth resolution down to 1 μm or less is possible [16–18].
Most optical microscopy techniques achieve high axial and transverse resolution with a high numerical aperture (NA) objective [19]. In contrast, OCT gains axial resolution from the coherence gate, and one uses typically a low NA objective that provides a long depth of focus covering the entire imaging depth range. Hence, the transverse resolution is usually moderate (several 10 μm). However, one can implement optical coherence microscopy (OCM), where so-called en face images are acquired in a plane transverse to the probing beam [20]. OCM combines the high spatial resolution of confocal microscopy with the depth-selective coherence gate of OCT achieving high-resolution imaging transversely and longitudinally.
The penetration depth into scattering samples is limited, 2–3 μm typically for skin at 1.3 μm centre wavelength, which is nevertheless higher than what other high-resolution optical techniques, e.g. confocal microscopy [19], can achieve.
The choice between SD-OCT and SS-OCT depends mainly on the operating wavelength range [21]. For wavelengths below 1 μm, SD-OCT is favoured because silicon-based line cameras with sufficient pixel number and high read-out speed are readily available. Higher wavelengths require InGaAs-based cameras that are more expensive and not yet as technologically advanced. Therefore, above 1 μm SS-OCT is preferred, which is then the preferred choice for future systems applied in dermatological OCT. Operating at wavelengths in the range between 1 and 1.5 μm facilitates highest penetration into biological tissues [22]. Note, however, that operation at higher centre wavelengths might reduce the axial resolution due to increased demand for source bandwidth. In recent years, FD-OCT has become the preferred realisation due to its significantly higher imaging speed. FD-OCT allows for very high A-scan rates, because it requires no mechanical scanning of the reference path length. The scan speed allows video-rate imaging of three-dimensional volumes.
Practical Considerations and Applications
OCT Imaging of Normal Skin
The skin is unfortunately not an ideal optical medium. It is an optically complex, variable and multilayered optical structure that poses many problems to imaging. The penetration depth of OCT is highly tissue dependent and is typically limited to a maximum of 2 mm. OCT can reliably identify epidermis and the dermo-epidermal junction [23–25]. It is also able to identify the normal regional differences [24]. In glabrous skin, the stratum corneum presents as a thick hyporeflective granular-textured layer below a hyperreflective border of the skin surface. OCT images from glabrous skin show eccrine sweat gland ducts as hyperreflective coiling structures penetrating the stratum corneum (Fig. 16.4a). In comparison, follicular skin has distinct morphological differences. In follicular skin the stratum corneum layer is not defined and there are no identifiable eccrine sweat gland ducts. Furthermore, hair follicles and sebaceous glands tend to reduce the quality of the OCT images, and therefore, the follicular dermo-epidermal junction is not always as defined as in glabrous skin (Fig. 16.4b).
Fig. 16.4
Normal skin (a) demonstrates the OCT morphology of the normal fingertip skin. The stratum corneum is thick (black double arrows) and the spiral-shaped sweat ducts are seen penetrating the layer (white arrows). (b) OCT image of the skin of the lower arm – the stratum corneum is too thin to be imaged here, but the epidermis is easily delineated (red lines). OCT image recorded with an OCT system from Michelson Diagnostics
OCT Imaging of Non-melanoma Skin Cancer
Non-melanoma skin cancer (NMSC) has been a natural focus for applied OCT research and it has been widely investigated [3, 25, 28–41]. The studies have mainly focused on actinic keratosis (AK) and basal cell carcinoma (BCC). Squamous cell carcinoma (SCC) has predominantly been examined on oral mucosal surfaces [42, 43], although a few SCC skin lesions have recently been examined with OCT [8, 44]. The changes described in SCC appear quite similar to those seen in BCC, but SCC tends to be more hyperkeratotic.
The studies on NMSC indicate that the characteristic layering of normal skin [23, 24, 26] found in OCT is lost in NMSC [3, 7, 29, 32, 35–37, 45]. Loss of normal OCT architecture may also be seen in various benign lesions [46]; however, other OCT characteristics of malignant lesions have been found. In AK lesions these include focal thickening of epidermis [29, 47], hyperreflective streaks and also signal-poor irregular bands in the epidermis corresponding to keratin deposits [7, 44, 46, 47] (Fig. 16.5). OCT images of BCC lesions show dark rounded areas sometimes surrounded by white halo corresponding to islands of carcinoma basal cells and surrounding stromal tissue. In lesions with necrotic areas, the necrosis can be visualised as well-circumscribed black, i.e. signal poor, areas [7, 37, 44–46] (Fig. 16.6).
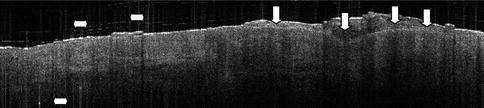
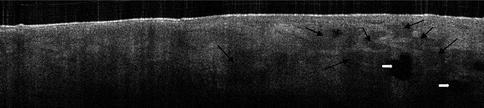
Fig. 16.5
An actinic keratosis lesion on the scalp. The thick dysplastic epidermis is shown (vertical white arrowheads) and the epidermis itself has lost the clear-cut layering. Hyperkeratosis tends to induce vertical white artefacts in the OCT image (horizontal arrowheads). OCT image recorded with an OCT system from Michelson Diagnostics
Fig. 16.6
Basal cell carcinoma on the forehead. The lobular pattern of basal cell carcinoma islands is recognised in the OCT image as grey rounded areas (black arrowheads). Necrosis is also seen as black well-defined areas (white arrowheads). OCT image recorded with an OCT system from Michelson Diagnostics
One advantage of OCT is that it provides cross-sectional high-resolution skin images, thus making it possible to directly compare obtained images to standard histopathology images. Several studies have suggested high correlation between OCT images and histopathology in BCC lesions [1, 30, 32, 33, 37, 45]; however, BCC subtypes could not be identified in OCT images [37, 40]. This also means that OCT may be of use in identifying residual tumour tissue in Mohs micrographic surgery [48].
In spite of the high correlation between OCT and histopathology, image quality of NMSC lesions does vary and some lesions appear blurred and poorly delineated. A study examined histological characteristics of BCC lesions associated with good OCT image quality [49]. The study finds that the presence of solar elastosis makes for higher-quality OCT images, while inflammatory infiltrates significantly impair OCT imaging of BCC lesions. Reassuringly, neither ulceration nor hyperkeratoses seemed to impair OCT imaging of BCC significantly.
OCT Imaging of Malignant Melanomas (MM)
Because melanin is a strong scatterer of light and because malignant melanomas are usually pigmented neoplasms, MM imaging by techniques based on the penetration of light has proven more difficult to obtain. In ophthalmology, the use of OCT was studied in choroidal melanomas [50, 51], but only a few studies have investigated the use of OCT in melanocytic skin lesions [52–54]. Because cellular features cannot be visualised with OCT, disease diagnosis must rely on change in the skin morphology [1, 54]. In OCT images the most striking architectural feature of MM is the presence of vertical icicle-shaped structures, corresponding to dense infiltrates of tumour cells and lymphocytes [53]. In Fig. 16.7, a dysplastic compound naevus has been OCT imaged compared to histology. The dysplasia is however difficult to acknowledge in the OCT image.
Fig. 16.7
Compound dysplastic naevus with atypical features. In (a), the well-defined elongation of rete ridges and melanocytes is marked by black arrows. In (b), the subtle variation in nuclear cytology and finely dispersed cytoplasmic melanin particles, arranged predominantly not only in nests but also as solitary units, along the dermo-epidermal junction, is seen. Some of the melanocytes contain enlarged and pleomorphic nuclei. Some intraepidermal nests are horizontally elongated with bridging of rete ridges (Courtesy of Professor Dan Siegel. OCT image recorded with an OCT system from Michelson Diagnostics)
Indications and Contraindications
OCT provides high accuracy in distinguishing lesions from normal skin [29, 46, 47, 55], which is of great importance in identifying tumour borders. In differentiating normal skin from lesions, a sensitivity of 79–94 % and specificity of 85–96 % were found for OCT. Discrimination of AK from BCC was not possible in this study [46]. Diagnosis of AK ranged in sensitivity from 73 to 100 % and the specificity from 65 to 70 % [29, 47].
Accurate measurements of tumour thickness may be more difficult to acquire in thick tumours that stretch beyond the 2 mm penetration of the OCT signal [56]. OCT measurements, however, seem more precise and less biased than high-frequency ultrasound thickness measurements of thin AK and BCC lesions [7]. Thin carcinomas and AK are of particular interest to non-invasive imaging as they are already amenable to treatment with non-invasive therapies such as photodynamic therapy (PDT), topical fluorouracil and topical imiquimod [57]. Also, OCT may be useful as a non-invasive monitoring tool during treatment. OCT-guided PDT is one of the promising approaches to discriminate tumour margins [8], and OCT could potentially allow for more precise individual adjustments of topical and nonsurgical therapies. This aspect of OCT is currently being studied.
In order to improve OCT image quality and expand the potential of OCT, technical developments are necessary. Several possibilities exist for developing OCT. Newer OCT modalities include the use of speckle reduction, polarisation-sensitive (PS) OCT, en face OCT, OCT elastography and wavelength-dependent OCT. Also, combining OCT with other functional information such as Raman spectroscopy, multimodal photoacoustic and optical coherence tomography PAT-OCT [58] or Doppler could make OCT images more informative [39, 45, 46, 58–63]. Finally, the introduction of image analysis as speckle reduction and machine learning algorithms may provide a more precise classification of AK and BCC lesions than relying on the human eye alone [2, 64].
In distinguishing MM from benign naevi, a general architectural disarray and unclear dermo-epidermal junction have been suggested as important OCT features [53]. Sensitivity and specificity studies have not been performed, and the full potential of OCT in MM diagnosis therefore remains to be described.
OCT is capable of real–time imaging and, using nonionising near-infrared light, safe for repeated examinations. Hence, it is a valuable complement to other clinical tomography modalities like ultrasound imaging, magnetic resonance tomography or X-ray computed tomography (Fig. 16.1).
Related posts:

Stay updated, free articles. Join our Telegram channel

Full access? Get Clinical Tree


