- Obesity is characterized by an excess of body fat mass and is defined by a body mass index equal to or greater than 30 kg/m2. Its prevalence has increased considerably over the past decades in all parts of the world and currently affects 15–30% of the adult populations in Western countries.
- Overweight and/or obesity represents by far the most important modifiable risk factor for type 2 diabetes mellitus (T2DM). An abdominal type of body fat distribution is also closely associated with T2DM, particularly in the lower body mass index categories.
- Both obesity and T2DM have a strong genetic background. The known susceptibility genes for obesity mainly affect central pathways of food intake, whereas most risk genes for T2DM compromise β-cell function.
- Important environmental factors contributing to the development of obesity include energy-dense diets including large portion sizes and permanent availability of foods, lack of physical activity and low socioeconomic status.
- An expanded adipose tissue impairs insulin action and causes insulin resistance in muscle, adipose tissue, liver and possibly other organs.
- Obesity is also characterized by subacute chronic inflammation in adipose tissue because of an impaired paracrine–endocrine function of adipose tissue, but also by mitochondrial dysfunction, local hypoxia and other still poorly understood disturbances at the cellular level.
- Weight loss in obese individuals is followed by rapid amelioration of all metabolic disturbances including chronic inflammation and insulin resistance. These improvements are brought about by caloric restriction rather than the macronutrient composition of the dietary intervention.
- Bariatric surgery is the most powerful approach to treat morbid obesity and may lead to a marked improvement of the metabolic disturbances if not the resolution of T2DM.
Introduction
Obesity is defined as a common chronic disorder of excessive body fat and has become a global epidemic which is present not only in the industrialized world but also in many developing and even in underdeveloped countries. At present, the prevalence of obesity (defined as body mass index [BMI] ≥30kg/m2) is in the range 15–30% in the adult populations in Europe, North America and in many Arabic countries, with an unequivocal trend for further increases [1]. This condition increases the risk of developing a variety of adverse consequences to human health ranging from metabolic disturbances including type 2 diabetes mellitus (T2DM) and cardiovascular complications to disorders of the locomotor system and many types of cancer [2]. In addition, obesity impairs the subjective quality of life in affected people and can reduce life expectancy [3]. Although there is a very specific close relationship between excessive body weight and the risk of diabetes, the presence of obesity may induce many other disturbances that may aggravate the diabetic state.
Definition of obesity and the body fat distribution pattern
The diagnosis and classification of obesity is usually based on the BMI. This simple anthropometric index can be calculated from body weight and height, is independent of body height and correlates reasonably well with body fat mass (r = 0.4–0.7). The current classification of body weight according to the World Health Organization (WHO) is presented in Table 14.1. A BMI greater than 30 kg/m2 is considered to be the central formal criterion for the definition of obesity which is further subdivided into three classes depending on the severity of excessive body fat. The BMI range of 25–29.9 kg/m2 represents the category of overweight or pre-obesity which requires additional criteria to assess the concomitant health risks. In Western countries, 30–50% of the population fall into the category of overweight [1].
Table 14.1 Classification of human obesity based on body mass index (BMI) classification (kg/m2). Resproduced from World Health Organization [1] with permission.
| Claffication | kg/m2 |
| Underweight | <18.5 |
| Normal weight | 18.5–24.9 |
| Overweight | ≥25.0 |
| Obesity | |
| grade I | 30–34.9 |
| grade II | 35–39.9 |
| grade III | ≥40 |
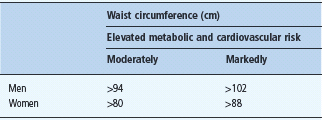
Not only the extent of excessive body fat mass, but also the anatomic location of the body fat mass determines the risk for metabolic and cardiovascular complications. This is particularly important for the category of moderate overweight and even in the upper normal range of BMI. At a defined BMI, the pattern of fat distribution can vary substantially. This has been most impressively shown using computed tomography (CT) or magnetic resonance imaging (MRI) scans which are the only imaging techniques to provide a direct assessment of the size of the intra-abdominal visceral adipose tissue. For practical means, waist circumference measured mid way between the lower rib margin and the upper iliac crest is used as a simple anthropometric measure to assess the fat distribution pattern. This variable has been used in many cross-sectional and longitudinal studies; therefore, the threshold levels demonstrated in Table 14.2 are now well based on human data sets concerning associated health risks. The waist circumference is closely correlated with BMI but cannot discriminate between subcutaneous and intra-abdominal fat depots.
Table 14.2 Classification of fat distribution pattern, threshold values for the moderately and markedly elevated risk for metabolic and cardiovascular diseases.
Obesity is the most potent risk factor for type 2 diabetes
A large body of clinical data consistently demonstrates a close relationship between body fat mass and the risk of diabetes. It is noteworthy that in contrast to other obesity-associated metabolic disturbances, the diabetes risk already increases in the upper normal range of BMI. This has been shown for both men and women. In the prospective Nurses’. Health Study, women in the upper normal range with a BMI of 23.0–24.9 kg/m2 had a four- to fivefold increased risk of developing diabetes over a 14-year observation period compared with women with a BMI of <22kg/ m2. In women with a BMI of 29.0–30.9 kg/m2 the risk of diabetes was 27.6-fold higher than in the lean reference group. Almost two-thirds of newly diagnosed women with T2DM were obese at the time of diagnosis [4]. Similar observations were made for males in the Health Professionals’ Study [5]. Moreover, changes in body weight also predicted the risk of diabetes. Weight gain in women after the age of 18 of 11.0–19.9kg, which is the average range of weight change between adolescence and menopause in industrialized countries, was found to be associated with a 5.5-fold higher risk of diabetes compared with weight-stable women, whereas weight reduction of the same extent reduced the risk of diabetes by about 80% [4]. Very similar data were reported for men [5]. A recent analysis of the EPIC Potsdam cohort revealed that a weight gain of 1 BMI unit between the age of 25 and 40 years increased the relative risk of T2DM by 25% and had a greater effect than the same weight gain between 40 and 55 years of age [6]. It is also important to note that the duration of obesity has a strong impact on the risk of developing T2DM.
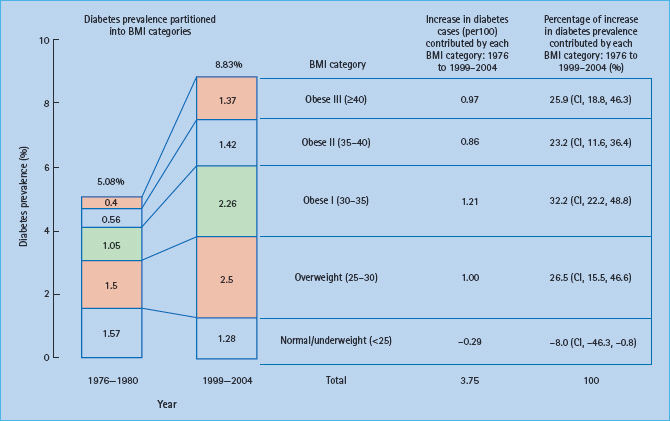
In a recent analysis of the relative contributions of different levels of overweight and obesity to the prevalence of diabetes between 1971–6980 and 2000–2004 in the USA it was found that the increase in total diabetes prevalence from 5.08% to 8.83% was largely caused by the increase in obesity. Of the increased number, 81% was attributed to the different classes of obesity (Figure 14.1). The authors concluded that the increase in diabetes prevalence over recent decades has disproportionately included persons with extreme levels of obesity [7]. Thus, obesity appears to be the main environmental driving force for the manifestation of T2DM.
Figure 14.1 Contribution of five body mass index (BMI) categories to the overall prevalence of diabetes. National Health and Nutrition Examination Survey (NHANES) samples of 1976–1980 and 1999–2004 were compared. Reproduced from Gregg et al. [7], with permission from Elsevier.
In addition to the level and the duration of obesity, the risk of developing diabetes is also potently influenced by the fat distribution pattern. In an early study in humans, an abdominal pattern of fat distribution was found to be an independent risk factor for T2DM [8]. Subsequent studies confirmed this observation in many age groups and ethnic populations. Particularly at low degrees of overweight, and even in the upper normal range, the fat distribution pattern strongly predicts the risk for diabetes and the metabolic syndrome. Therefore, waist circumference should be routinely assessed when estimating the risk of diabetes even in normal-weight subjects. In the clinical setting, it is striking to observe that the majority of subjects with diabetes, particularly those of middle age, show a visible preferential truncal accumulation of excess body fat. It is also interesting to note that similar observations were made for the association between BMI and cardiovascular disease. Among overweight and obese subjects, only those with an abdominal type of fat distribution are at increased risk of coronary heart disease as recently documented in the INTERHEART study [9].
Genetic predisposition for obesity and type 2 diabetes
It is well known from family, adoption and twin studies that obesity, like T2DM, has a strong genetic basis. In the classic adoption study by Stunkard et al. [10] there was no resemblance between the adult BMI of adopted Danish children and the BMI of the adopting parents, but a significant correlation to the BMI of the biologic parents, especially to the BMI class of the biologic mother. In a twin study of obesity, concordance rates for different degrees of overweight were twice as high for monozygotic twins as for dizygotic twins. This high heritability for BMI was seen at the age of 20 years and to a similar extent at a 25-year follow-up, suggesting that body fatness is under substantial genetic control [11]. There is also a very close correlation in monozygotic twins who were reared apart, also indicating a high heritability of the BMI trait. In a recent study of 5092 twins living in the London area, the authors estimated the heritability of BMI and waist circumference as 0.77, further supporting the strong effect of the genetic components irrespective of the force of the obesogenic environment [12].
During the last decade, a number of monogenic disorders that result in human obesity have been uncovered. These genetic disorders were only found in rare cases, however, usually children and adolescents with early onset of obesity. At present, a variety of homozygous and compound heterozygous mutations have been described in the leptin–melanocortin signaling pathway, some of them with functional consequences resulting in human obesity. Functional mutations in the melanocortin-4-receptor gene are considered to be the most frequent cause of monogenic obesity in children with a frequency of 2–4% of all obese cases. It is striking that these defects affect genes that are involved in the central control of food intake [13].
Recent genome-wide association (GWA) studies in large cohorts with BMI as phenotype reported common genetic variants on various chromosomes. These polymorphisms predisposing to obesity at the population level are also largely related to central pathways of food intake [14–16]. Thus, human obesity may represent a heritable neurobehavioral disorder that is highly sensitive to environmental conditions, especially an energy-dense palatable foods which are abundantly available in many societies [13]. Despite these remarkable advances in our understanding of the genetic factors related to obesity, the effect size of most of the novel “obesity genes” is rather modest. Only individuals who are homozygous for the high-risk allele of the FTO gene weigh on average 3 kg more than individuals with two low-risk alleles [14]. The gene is encoding a 2-oxoglutarate-dependent nucleic acid demethylase which is mainly expressed in the brain and in the arcuate nucleus of the hypothalamus [17]. Among the almost 20 gene variants found in GWA studies so far, variants near to the FTO and the MC4R gene appear to have the strongest effect size on body weight. All other recently discovered gene polymorphisms influence body weight by far less than 1 kg.
Thus, it is apparent from recent work that obesity represents a rather heterogeneous disorder in terms of genetic background and susceptibility to etiologic environmental factors. In addition, the risk for developing co-morbidities including T2DM may strongly depend on the individual genetic predisposition towards such diseases. In the case of T2DM, the lifetime risk of developing this disease is about 30% in the white North American population and similar in other ethnic groups [18]. It is currently assumed that only those obese subjects who exhibit a genetic failure of the pancreas to compensate for insulin resistance, which is a characteristic consequence of obesity, will develop T2DM [19]; even among severely obese subjects (BMI ≥40kg/m2) only 30–40% will develop diabetes throughout life. Thus, the development of T2DM requires the presence of “diabetes genes” which probably limit β-cell function.
Developmental programming of obesity and diabetes
A new component that may have a major role in the development of obesity and T2DM is the modification of gene expression by epigenetic mechanisms during fetal life. Although this is still a poorly defined phenomenon and it is rather unclear which mechanisms may underlie this association, there is some clue that epigenetics may also operate in this context. Observational studies suggest that infants of mothers with gestational diabetes are at increased risk of developing childhood obesity [20]. In another study, siblings born after the mother had developed gestational diabetes (i.e. exposed to diabetes in utero) have a much greater risk of T2DM in young adulthood than siblings not exposed to diabetes in utero (odds ratio 3.7; P = 0.02) [21].
Another interesting clinical observation is that excessive weight gain during pregnancy, independent of initial BMI, may also increase the risk of early development of obesity in the offspring [22,23]. It is speculated that both hyperglycemia and chronic overnutrition during pregnancy may cause fetal hyperinsulinemia, hypercortisolemia and hyperleptinemia. These hormonal changes may result in a persisting malprogramming of hypothalamic centers controlling energy homeostasis and metabolism, thereby increasing the lifetime risk for obesity and T2DM and possibly the risk for other adverse long-term health consequences [24]. The mechanisms mediating these effects are largely elusive, but it is speculated that epigenetic processes such as DNA methylation, histone modification and changes of the microRNA pattern are involved. Animal experiments suggest that this imprinting process may mainly affect central neuroendocrine pathways which may finally modify appetite regulation [24].
Pathophysiology of obesity
Irrespective of the strong genetic influence on body weight, there is also no doubt that the evolving worldwide epidemic of obesity is primarily a consequence of substantial changes in the environment and lifestyle (see Chapter 8). It is rather new to mankind that food is abundant in many countries and that physical activity is no longer a prerequisite for survival. These dramatic changes in environment and the subsequent changes in lifestyle have occurred within a few decades, a period probably too short to result in adaptations of the genetic background and biologic systems to optimize survival. To date, the relative contributions of the various environmental factors to the epidemic of obesity are hard to quantify in detail and there exist considerable differences between populations.
Humans, like other mammals, are characterized by a tight control of energy homeostasis allowing a stable body weight to be maintained. This setpoint of body weight can vary substantially among individuals and may also vary across lifetime. A complex regulatory system controls energy homeostasis which involves central pathways and peripheral components such as the size of adipose tissue which is sensed to the brain via the secretion of leptin. In addition, gut hormones, signals from the gastrointestinal nervous system and nutrients signal to the brain and induce a complex central integration according to the dietary intake and nutrient requirements of the organism. Central pathways are the anorexigenic leptin–melanocortin link and the orexigenic NPY–AgRP pathway. Many other factors such as insulin modify these signaling processes and thereby influence energy balance [25]. This complex and potent homeostatic system also serves to defend body weight against a critical energy deficiency but also against chronic overnutrition. Several adaptive systems are known to restore the initial body weight under such fluctuations of energy intake and expenditure. This may explain why obese humans exhibit a strong tendency to regain weight after intentional dietary weight reduction. The same tendency to return to initial body weight is observed after experimental overfeeding.
The role of energy homeostasis in the development of obesity has been elaborated by previous studies using indirect calorimetry to investigate the contribution of the resting metabolic rate (RMR) to the risk of obesity. In a study of Pima Indians, RMR was found to be a familial trait and to vary considerably across families [26]. In prospective studies in American Indians, a reduced rate of energy expenditure assessed in a respiratory chamber turned out to predict body weight gain over a 2-year follow-up period. This finding was confirmed in another group over a 4-year-follow-up period in the same paper, indicating that a low rate of energy expenditure may contribute to the aggregation of obesity in families [27]. At present, the genetic components for these differences in energy metabolism are still unknown.
Environmental factors promoting obesity and type 2 diabetes
It is now established that a complex gene–environment interaction determines the individual risk to develop obesity (Table 14.3). Even in societies with an abundance of affordable, highly palatable food there is a high variation in body weight across the populations ranging from lean individuals to extremely obese persons. Many other factors such as physical activity, education and socioeconomic status may also act as strong modifiers of body weight. After two to three decades of modern lifestyle the trend towards obesity appears to reach a plateau, as suggested by recent data from the USA and other Western countries. This observation also supports the concept that genetic and biologic factors contribute substantially to the susceptibility to develop obesity.
Table 14.3 Environmental factors promoting the development of obesity.
| Ready availability of food |
| High palatability of food |
| High energy density |
| Relatively low cost of foods |
| High consumption of sugar-sweetened beverages |
| Aggressive commercial food promotion |
| Low physical activity |
Despite the genetic predisposition it is widely accepted that the current worldwide epidemic of obesity is largely a consequence of dramatic changes in lifestyle and environment which emerged over the past 30–50 years. A dramatic change in eating habits and food selection took place, whereas physical activity decreased remarkably because of technologic development concerning transportation and workplaces. Although dietary abundance and sedentary lifestyles have multiple origins, both may equally contribute to a chronic positive energy balance which may result in energy storage in adipose tissue.
A rather novel phenomenon is the expansion of the fast-food culture characterized by high-fat, low-starch foods together with a high intake of sugar-sweetened beverages. In addition to having a high energy density, fast-food menus have large portion sizes. This combination has led to the assumption that frequent fast-food consumption is linked to body weight gain and maintenance of overweight and obesity in the population. Despite this popular explanation, there is rather limited evidence for this association in the scientific literature. Nevertheless, a recent systematic review of six cross-sectional and seven prospective cohort studies concluded that sufficient evidence exists, at least for the adult population [28]. In addition, a high intake of sugar-sweetened beverages is another part of the global fast-food culture. Another systematic review clearly concluded that a high intake of calorically sweetened beverages can be regarded as a determinant of obesity, although there was no support that this association is mediated via increased energy intake, suggesting that alternative biologic explanations should be also explored [29]. In view of the expansive growth of the fast-food industry in many countries this is a critical issue and may require more intense public discussion on the health consequences of this policy. According to a recent survey, people from the USA obtain one-third of their daily caloric intake from restaurant meals, and one-third of customers of chain restaurants in New York purchased meals containing more than 1000 calories [30]. Thus, there is a growing need to develop new public health policies to limit fast-food consumption and to facilitate a healthier food selection.
Another aspect in the context of high fast-food consumption which may further explain the elevated risk of obesity is the energy density of modern foods. There is convincing evidence that energy density of foods is a key determinant of caloric intake. From an evolutionary point of view, the human regulatory system for energy intake is adapted to starchy foods with low caloric content which requires large volumes to obtain sufficient energy. Today, most fast-foods have a high energy density which may favor a passive overconsumption of calories. A recent study showed that the average energy density of fast-food menus is approximately 1100 kJ/100 g, which is 65% higher than the average British diet (approximately 670 kJ/100 g) and more than twice the energy density of recommended healthy diets (approximately 525 kJ/100 g). It is 145% higher than in traditional African diets (approximately 450 kJ/100 g) which represent the levels against which human weight regulatory mechanisms have evolved. The authors concluded that the high energy density of many fast foods challenges human appetite control systems with conditions for which they were never developed [31].
Another determinant of the obesity epidemic may be the persistent trend over the last decades towards increasing portion sizes. A study from the USA demonstrated that the average portion size for many food items increased markedly between 1977 and 1998, with greatest increases for food consumed at fast-food restaurants and at home [32]. Similar trends have been documented in other countries. Experimental human studies have clearly established that both increasing the portion size and the energy density of food is associated with an increase in caloric intake and, in the long run, may therefore promote weight gain and obesity [33].
Finally, socioeconomic status is a strong determinant of obesity and of T2DM. In most countries there is a gradient between education and household income and the prevalence of obesity. A low socioeconomic status is associated with an unfavorable lifestyle including poor nutrition, low leisure-time physical activity and low health consciousness. This gradient is usually greater in females than males. Thus, the association between low household income and obesity may be mediated by the low costs of energy-dense foods, whereas prudent healthy diets based on lean meats, fish, vegetables and fruit may be less affordable for those of lower socioeconomic status [34].
Pathophysiologic links between obesity and type 2 diabetes
T2DM is characterized by an impaired insulin action or a defective secretion of insulin or both. Both defects are thought to be required for the manifestation of the disease and both are present many years before the clinical onset of the disease. To date, the mechanisms by which obesity increases the risk of developing T2DM are only partly understood and the evolving picture is getting more and more complex. The main adverse effect of obesity is on the action of insulin, particularly in liver, muscle and adipose tissue, but obesity also affects insulin secretion. Substantial advances have been made over recent years in our understanding how an excessive fat mass, but also chronic over-nutrition, may cause metabolic disturbances resulting in overt T2DM in those with a genetic predisposition for the disease.
Lipids and insulin resistance
The earliest hypothesis to explain the relationship between obesity and T2DM is the “glucose–fatty acid cycle” which is based on the observation of a competition between glucose and fatty acid oxidation in the heart muscle and was introduced by Randle et al. [35]. The increased supply of non-esterified fatty acids from expanded adipose tissue depots competes with glucose utilization, particularly in muscle, which represents the organ that oxidizes the largest proportion of glucose. The proposed mechanism is an inhibition of the glycolytic enzymes pyruvate dehydrogenase, phosphofructokinase and hexokinase. As a consequence, the rate of glucose oxidation is reduced and glucose concentrations rise. The concomitant increased fatty acid turnover is accompanied by an increased release of glycerol from adipose tissue which is reutilized for hepatic glucose production, further augmenting the imbalance of glucose metabolism. Increased hepatic glucose output is another early disturbance contributing to glucose intolerance.
In addition, it was reported that elevated free fatty acids can directly impair insulin action. Recent studies suggested that obese subjects and those with T2DM have a high intramyocellular lipid accumulation which is an important feature of the insulin-resistant state. Exposure of skeletal muscle to an excessive lipid supply may lead to intramuscular accumulation, not only of neutral fatty acids, but also of lipid-derived metabolites such as ceramide, diacylglycerol and fatty acyl coenzyme A (CoA). This lipid accumulation is associated with coincident disturbances in insulin action mediated by an activation of a serine–threonine kinase cascade leading to serine–threonine phosphorylation of insulin receptor substrate 1 (IRS-1) and IRS-2 which may cause an impairment of insulin signaling including an impaired activation of phosphoinositol-3 kinase and other downstream elements [36]. This condition is also caused and exacerbated by chronic overnutrition with a high dietary fat intake. Thus, the increased availability of fatty acids may be the single most critical factor in disturbing insulin action in obesity.
Lipids and β-cell function
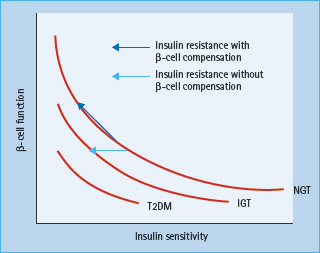
Obesity is characterized by an elevated insulin secretion and a decreased hepatic insulin clearance. Human studies suggested that the β-cell volume is increased by about 50% in healthy obese subjects, probably because of hypertrophy of existing β-cells. Insulin release and insulin sensitivity are closely reciprocally related in a non-linear manner (Figure 14.2). Failure of this feedback system is known to result in a progressive decline in β-cell function and to underlie the development of T2DM. In addition to glucose, long-chain fatty acids may also exert a stimulatory effect on insulin secretion from the pancreatic β-cells via generation of fatty acyl CoA and activation of protein kinase C [36]. Another effect of fatty acids on insulin secretion is via binding to the G-protein-coupled receptor GPR 40 on the β-cell membrane which may result in a subsequent increase in intracellular calcium and secretory granule exocytosis [37]. Although fatty acids are critical for normal insulin secretion, a chronic exposure of β-cells to excessive fatty acids is associated with marked impairment of glucose-stimulated insulin secretion and decrease in insulin biosynthesis [38]. Another mechanism by which elevated fatty acids may impair insulin secretion in response to glucose is via an increased expression of uncoupling protein 2 (UCP-2) in β-cells. UCP-2 was found to be upregulated under glucolipotoxic conditions and mitochondrial superoxide has been identified as a post-translational negative regulator of UCP-2 activity in islets [39].
Figure 14.2 Hyperbolic relation between β-cell function and insulin sensitivity. IGT, impaired glucose tolerance; NGT, normal glucose tolerance; T2DM, type 2 diabetes mellitus. Reproduced from Stumvoll M, Goldstein BJ, van Haeften TW. Type 2 diabetes: principles of pathogenesis and therapy. Lancet 2005; 365:1333–1346, with permission from Elsevier.
Related posts:

Stay updated, free articles. Join our Telegram channel

Full access? Get Clinical Tree


