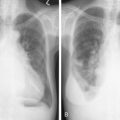
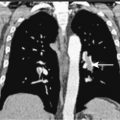
Nuclear medicine has long played a significant role in oncologic imaging, and the recent widespread clinical applications of positron emission tomography (PET) have further increased its importance. As the prototype of molecular imaging, nuclear medicine interrogates metabolic and physiologic processes, rather than anatomy, and provides important in vivo information regarding tumor metabolism. Molecular imaging with nuclear medicine can now be performed on hybrid systems that combine a nuclear medicine device such as a PET scanner or a SPECT (single photon emission computed tomography) scanner with a computed tomography (CT) scanner, providing unique functional and anatomic information in one setting and a very complementary assessment of tumor status. As outlined in Table 3.1 , nuclear medicine has proven effective in oncology in a number of roles spanning the course of the disease, including the characterization of a mass, staging, restaging, monitoring of therapeutic response, follow-up, various therapeutic applications, and the monitoring of toxicity to nontarget organs.
| Roles | Examples |
|---|---|
| Diagnosis | FDG-PET in evaluation of solitary pulmonary nodule |
| MIBG in suspected neuroblastoma | |
| Staging and restaging | Sentinel node |
| Bone scan | |
| FDG-PET | |
| Gallium-67 | |
| Assessment of therapeutic response | FDG-PET |
| Gallium-67 | |
| Surveillance | Bone scan |
| FDG-PET | |
| Therapy | Iodine-131 for thyroid cancer |
| Radiolabeled monoclonal antibodies for lymphoma | |
| Alleviation of pain in patients with skeletal metastases | |
| Monitoring of non–target organ toxicity | Wall motion study to monitor chemotherapy-induced cardiotoxicity |
Nuclear medicine studies are based on imaging the distribution of radioactive tracers, known as radiopharmaceuticals. Radiopharmaceuticals possess two general properties. First, they have some desired physiologic or pathophysiologic property, such as their ability to target tumor cells. Second, they contain a radioactive component (a radioisotope) that emits energy that can be captured by an imaging device such as a gamma camera or a PET camera. These emissions can be transformed into images that visualize the in vivo distribution of the radiopharmaceutical. Usually these two properties are conferred by two different components of the radiopharmaceutical. With the common bone scanning agent technetium-99m–methylene diphosphonate ( 99m Tc-MDP) for example, the physiologic property is provided by MDP, which is incorporated into areas of osteogenesis, a physiologic response to tumor invasion, whereas the radioactive component is provided by the radioisotope 99m Tc, which has a half-life of 6.03 hours and emits imaging-amenable gamma photons at an energy of 140 keV. Sometimes both properties are provided by the same component, for example iodine-131 ( 131 I), administered as sodium iodide (NaI). Iodine-131 possesses the desired physiologic property of being incorporated into well-differentiated thyroid cancer cells, and it emits gamma photons (365 keV) that allow for in vivo imaging, as well as beta particles (maximum 606 keV) that allow systemic radiation therapy to be performed. Table 3.2 summarizes some common radiopharmaceuticals used in oncologic applications. Nuclear medicine images may be acquired with gamma-emitting radiotracers on stationary cameras, resulting in a 2D planar image, or on cameras slowly rotating around the patient, resulting in 3D tomographic data sets, form of acquisition is known as SPECT. Whereas the planar nuclear medicine image is analogous to the familiar x-ray radiograph, SPECT is analogous to x-ray CT. In PET, the process is different. The radioactive decay of PET radiotracers does not directly yield imaging-amenable photons, but rather the emission of a positively charged subnuclear particle, a positron. The positron collides with a nearby electron, resulting in the annihilation of both particles and the emission of two 511-KeV photons at 180 degrees to one another. It is these photons that are detected by the PET scanner. PET scanners typically consist of stationary rings of small detector elements arranged in a cylindrical geometry around the patient, simultaneously detecting the photons emitted in all directions, yielding a 3D data set of the distribution of the radiopharmaceutical throughout the patient.
| Radioisotope | Half-Life | Energy (keV) | Radiopharmaceutical | Clinical Applications |
|---|---|---|---|---|
| Technetium-99m | 6.03 hr | 140 | 99m Tc-MDP | Bone scan |
| 99m Tc-sulfur colloid | Sentinel node | |||
| Iodine-131 | 8.06 days | 364 | 131 I | Thyroid cancer scan and therapy |
| 131 I-MIBG | Neuroendocrine tumor imaging and therapy | |||
| Iodine-123 | 13.0 hr | 159 | 123 I | Thyroid cancer scan |
| 123 I-MIBG | Neuroendocrine tumor imaging | |||
| Gallium-67 | 78.1 hr | 93,184, 296 | 67 Ga citrate | Lymphoma |
| Indium-111 | 67 hr | 172, 247 | 111 In-pentetreotide | Neuroendocrine tumor imaging |
Bone Scan
The whole-body bone scan is one of the most commonly performed nuclear medicine cancer imaging procedures. It has been established as a sensitive technique for diagnosing and monitoring osseous metastases. Although a variety of radiopharmaceuticals have been used for bone scanning, the vast majority are performed today using a diphosphonate such as methylene diphosphonate labeled with 99m Tc ( 99m Tc-MDP). These agents are incorporated into bone undergoing osteogenesis, which, in the setting of a focal osseous insult such as neoplasm, fracture, or osteomyelitis, is usually substantially increased.
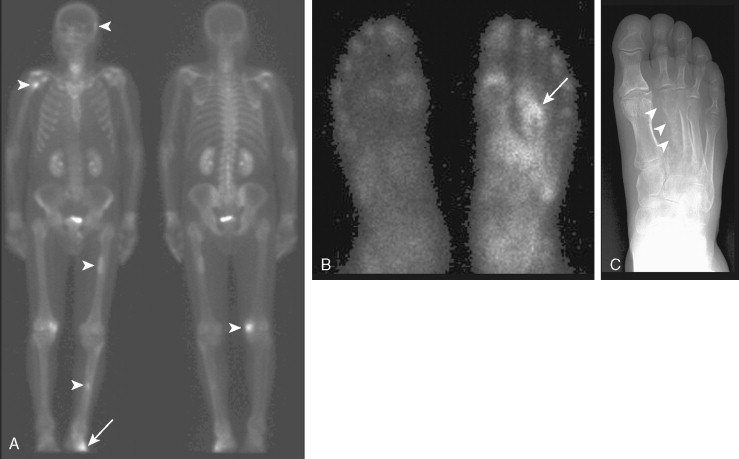
Typically, osseous metastases begin in the axial skeleton, a reflection of the preferential blood flow and predominance of red marrow, a favorable site of hematogenous metastases. Metastases are generally random in distribution and configuration ( Fig. 3.1 ). As the disease progresses, metastatic involvement expands to the appendicular skeleton and discrete lesions yield to a confluence of metastases. Occasionally an atypical distribution is seen with metastases primarily occurring in the appendicular skeleton ( Fig. 3.2A to C ). This initial spread to the distal skeleton is more commonly seen in the setting of primary tumors such as lung, breast, and renal cell carcinomas.
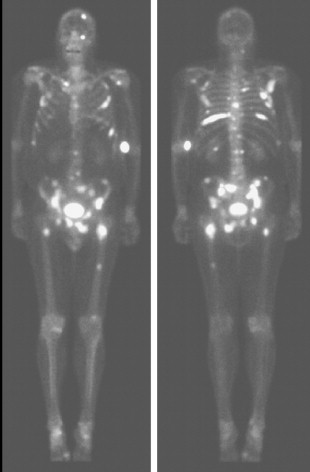
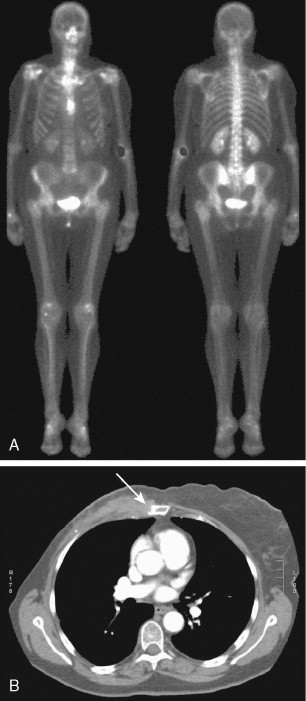
Another atypical pattern is the solitary metastasis. Only 50% of solitary lesions are metastases, even in patients with known malignancy. An area of particular interest is the sternum in patients with breast cancer. Mild to moderate uptake in the sternomanubrial joint is a common variant. However, uptake that is intense or asymmetrical should be considered suspicious and correlated with CT ( Fig. 3.3A, B ). Some of these sternal lesions may derive from a lymph node metastasis within the internal mammary lymph node chain or from soft tissue recurrence and subsequent bone invasion.
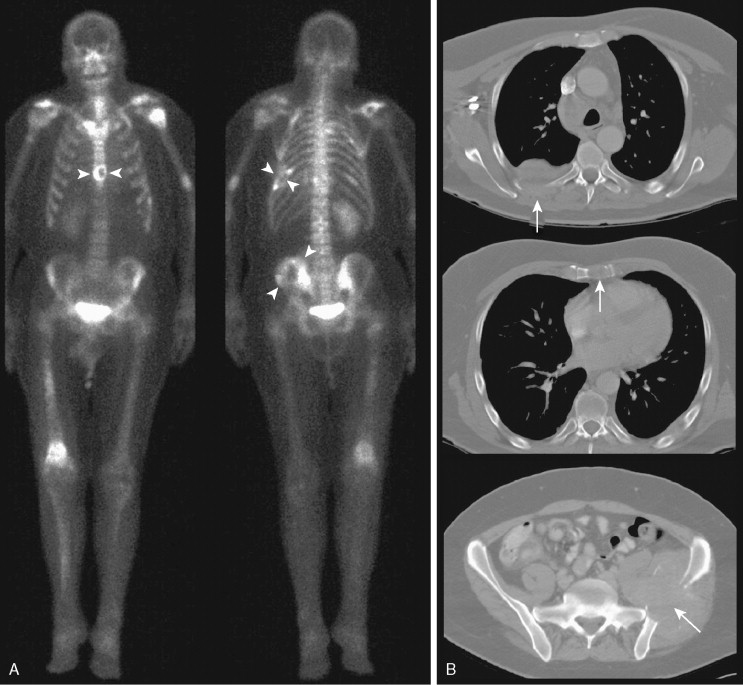
As defined radiographically, metastases may be lytic, sclerotic, or mixed. Purely sclerotic lesions are less common and typically occur in metastases from prostate cancer, some breast cancers, and carcinoid tumors. Regardless, most metastases are evident on bone scanning. Even lytic lesions, which result primarily in bone destruction, lead to bone repair and osteogenesis, resulting in some increased uptake on the bone scan ( Fig. 3.4A, B ). Cases of lytic metastases causing purely “cold” lesions on bone scans are rare and are most frequently seen in multiple myeloma.
With disease progression, osseous metastases become much more numerous and more confluent. This results in increased uptake within innumerable metastases, so that the presence of individual lesions becomes less obvious. This markedly increased uptake of radiopharmaceutical in the skeleton leads to decreased uptake within other organs, including urinary collecting systems and peripheral soft tissues. This pattern has been described as a “superscan.” Paradoxically, because there are fewer discrete lesions ( Fig. 3.5A to E ), this pattern of disease progression may incorrectly be perceived as improvement. A clue to the presence of a superscan is the relatively reduced uptake in the kidneys and soft tissues. Correlation with prior bone scans can be very helpful.

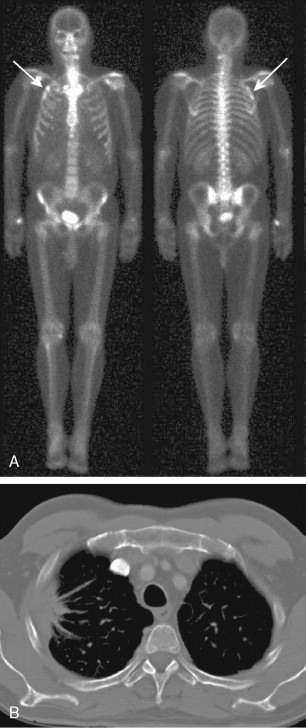
Metastases often involve the ribs. However, rib fractures are common and can be mistaken for metastases. Punctate uptake in several ribs in a linear distribution is highly suggestive of fractures, particularly in the absence of other suspicious lesions, and the clinical history may confirm a recent fall. Appearances suggestive of metastases include random distribution and elongated foci. An exception is in the setting of lung cancer, where direct invasion of contiguous ribs overlying the tumor can result in uptake within adjacent ribs in the absence of distal metastases ( Fig. 3.6A, B ). Again, correlation with the clinical history and other radiographic studies is important in evaluating any finding on bone scan.
In addition to its value in staging, the bone scan is used to follow response to therapy and for long-term surveillance. A reduction in the number and/or in the intensity of uptake of the tracer in known lesions implies improvement, while an increase in the intensity of uptake and/or in the number of lesions generally indicates progression. However, soon after hormonal therapy or chemotherapy, a successful tumor response may paradoxically appear as a worsening bone scan with more intense uptake seen in known lesions and new lesions, a phenomenon known as “flare.” This occurs because the bone scan does not directly image tumor viability but instead the osseous response to the tumor. In the setting of bone healing, an osteoblastic reaction will appear as an area of increased uptake of the tracer. New lesions may be appreciated in the context of flare, because they were previously small and/or lytic but become more prominent in the context of bone healing. It may be challenging to differentiate the flare phenomenon from true progression strictly based on the bone scan, but the clinical history and timing of the new therapy relative to that of the bone scan may help raise this possibility, particularly when the patient is in no pain and other tumor markers are decreasing. A repeat bone scan a couple of months later will confirm the healing with subsequent decrease in the intensity of tracer uptake and in the number of lesions. Additional radiologic features that may favor flare are transition of formerly lytic lesions to a sclerotic appearance on plain radiographs or CT, and reduction in the size of other nonosseous (soft tissue) metastases.
An interesting bone scan finding in the setting of malignancy is seen in the case of hypertrophic osteoarthropathy. This systemic phenomenon results in increased uptake in the cortices of the long bones, i.e., the “tram track” appearance ( Fig. 3.7A, B ). This results from the production of humoral factors and does not represent local neoplastic involvement.

Although the main use of the bone scan in oncology is in the evaluation of metastases from nonosseous tumors, it is also useful in the staging of primary bone malignancies ( Fig. 3.8A, B ). The bone scan is of limited utility in the assessment of the likelihood of malignancy in the primary lesion, because the degree of uptake on the bone scan is not necessarily indicative of aggressiveness. In this setting the extent of local primary tumor involvement is better assessed with magnetic resonance imaging (MRI).

Finally, it should be noted that focal uptake on a bone scan is not necessarily indicative of metastases. Common mimics include focal uptake at the site of osteomyelitis, degenerative/arthritic changes, fractures, and Paget’s disease ( Fig. 3.9 ). Recognition of common patterns substantially increases specificity, and correlation with clinical history and anatomic imaging can be diagnostic.

Positron Emission Tomography
Initially used as a research tool, PET has definitely transitioned to widespread clinical use in oncology and indeed has now become the standard of care in many oncologic applications. PET radioisotopes decay by emission of a positron (β + particle). The positron travels a short distance (0.22 mm for fluorine-18 [ 18 F]) and then interacts with an electron, resulting in the annihilation of both particles and the release of two high-energy gamma photons emitted at 180 degrees to one another that are captured by a PET scanner. The imaging of these annihilation photons results in better sensitivity, spatial resolution, and quality of the images compared with standard gamma camera–based nuclear medicine techniques. In addition, the use of positron-emitting isotopes has yielded an expanded repertoire of imaging radiopharmaceuticals, including the glucose analog 2-deoxy-2-[ 18 F]fluoro- d -glucose ( 18 F-FDG), by far the most widely used PET radiopharmaceutical. Malignant tumors have an increased rate of aerobic glycolysis compared with normal tissues, and 18 F-FDG is taken up into tumor cells due to increased glucose transporters such as GLUT-1, increased hexokinase, and decreased glucose-6-phosphatase, resulting in the retention of 18 F-FDG in many tumor types. The rate of uptake of 18 F-FDG by tumor cells is proportional to their metabolic activity.
Although 18 F-FDG is the predominant PET radiopharmaceutical, other 18 F-labeled tracers are or could be available soon. These include 18 F-fluoride for imaging skeletal metastases, 18 F-choline to image prostate cancer, 18 F-fluorothymidine to measure cell proliferation, 18 F-DOPA for imaging of primary and metastatic neuroendocrine tumors as well as low-grade brain tumors, 18 F-fluoroimidazole to assess tumor hypoxia, and others ( Table 3.3 ). Of note, other positron-emitting radionuclides such as oxygen-15, nitrogen-13, and carbon-11 can also be used for PET imaging. However, their short half-lives (20 minutes or less) require an on-site cyclotron facility. With its half-life of approximately 110 minutes, 18 F can be produced in off-site cyclotron facilities and easily distributed to imaging centers located within a few hours of traveling distance from the cyclotron facility. The recent production of hybrid scanners combining multislice CT scanners with PET devices, which allow acquisition and display of anatomic and physiologic images in one setting, has further enhanced and expanded the utility of PET imaging.
| Radioisotope | Half-Life (min) | Energy (keV) | Radiopharmaceutical | Tumor or Function Assessed |
|---|---|---|---|---|
| Fluorine-18 | 109 | 511 | 18 F-fluoride | Bone |
| 18 F-FDG | Glucose metabolism | |||
| 18 F-choline | Prostate cancer | |||
| 18 F-DOPA | Neuroendocrine and brain tumors | |||
| 18 F-fluorothymidine | Cell proliferation | |||
| 18 F-fluoromisonidazole | Hypoxia | |||
| Carbon-11 | 20.3 | 511 | 11 C-methionine | Protein synthesis |
| 11 C-choline | Cell membrane metabolism | |||
| Oxygen-15 | 2 | 511 | H 2 15 O | Blood flow |
| Nitrogen-13 | 9.97 | 511 | 13 N-ammonia | Regional blood flow |
| 13 N- l -glutamate | Osteogenic sarcoma |
The application of 18 F-FDG and PET (FDG-PET) to the management of oncology patients has resulted in an overall change in patient management in 30% of patients across all cancers. The Centers for Medicaid and Medicare Services (CMS) have recognized the utility of FDG-PET in the management of patients with cancer and have approved reimbursement for the initial and subsequent treatment strategies of patients with many malignancies, including lymphomas; non–small cell lung, esophageal, colorectal, breast, ovary cervical, head and neck, and thyroid cancers; melanoma; and multiple myeloma; and for the characterization of solitary pulmonary nodules (SPNs). CMS is also supporting other indications under a Coverage with Evidence Development program (CED). Cancer imaging with FDG-PET is now one of the most dynamic and rapidly growing areas of contemporary clinical imaging.
A major application of FDG-PET is in lung cancer, including the evaluation of SPNs ( Fig. 3.10A, B ). In distinguishing benign from malignant SPNs, PET has shown 96.8% sensitivity, generally obviating the need for biopsy, and is considered a cost-saving as well as cost-effective method for the characterization of indeterminate pulmonary nodules, resulting in a decrease in the number of unnecessary biopsies. The negative predictive value of FDG-PET in the SPN evaluation is much higher (greater than 95%) than its positive predictive value, as 18 F-FDG uptake is also seen in a variety of inflammatory and infectious conditions resulting in a lower specificity (77.8%). Therefore, 18 F-FDG uptake in a SPN does require further workup. Another application of FDG-PET in lung cancer is staging. With respect to locoregional staging, FDG-PET has proven more accurate than CT in staging the mediastinum ( Fig. 3.11A to C ). This modality is also very helpful in assessing distant metastases because of its whole-body imaging capability. This whole-body imaging capability in one setting is a theme that carries across many cancer types.


Stay updated, free articles. Join our Telegram channel

Full access? Get Clinical Tree


