Norton-Simon Hypothesis
Patrick G. Morris
Teresa A. Gilewski
Larry Norton
All modern medical science is based on pathophysiology, the study of the structure and function of normal organs and how that physiology is disturbed by disease states. Neoplastic diseases can occur in any part of the human body, rendering oncology one of the truly integrating fields of medicine. In contrast to other medical fields, however, the disturbing influence is not the intrinsic dysfunction of the organs themselves or the behavior of a foreign invader—viral, bacterial, or parasitic— but rather the proliferation of that organ’s—or, in the case of metastases, that body’s—normal cells. Hence, the science of oncology is fundamentally the science of cell proliferation.
For this reason, it is not surprising that much of contemporary basic science in oncology concerns the physiology of mitosis. The biology of growth factors and their receptors, signal transduction, gene regulation, DNA replication and repair, mitotic checkpoints, telomere function, microtubulin, and many other topics concerned with cell division are among the most active and rapidly growing areas of laboratory investigation. Coupled with studies of apoptosis, such activities are providing new insights into normal and neoplastic growth with demonstrable clinical implications. Yet clinical oncologists need a different understanding of cell population growth than do cell biologists. Most obviously, oncologists are confronted with tumor masses, or collections of masses, whose behavior is often greater than the sum of their cellular parts. Moreover, oncologists are concerned with kinetics, time course of mass expansion, and shrinkage, which is the natural consequence of abnormal proliferation and its perturbation. A group of kinetic questions of particular relevance to the clinician concern the relationship between a tumor’s growth pattern and its response to anticancer drugs that are intended to disturb mitosis. That is, does drug resistance emerge rapidly between the time that the cancer is diagnosed and the time of initiation of chemotherapy? Can prognosis be improved by shrinking a tumor mass before surgical removal? What is the optimal scheduling of non-cross-resistant chemotherapies? Is combination chemotherapy always desirable? What is the relationship between drug dose and the rate of tumor regression? These and many other questions recall the behaviors of populations of cancer cells over time. Such behaviors constitute a class of biomathematical functions called growth curves.
The field of growth curve analysis approaches the clinically relevant issues mentioned earlier by examining the rates of change of cell number over time in the unperturbed and the perturbed (e.g., therapeutic) environments. This field is closely allied with the field of cellular cytokinetics, using such techniques as tritiated thymidine labeling, flow cytometry, and assays of apoptosis, because the kinetics of cellular proliferation underlie the kinetics of tumor growth. Yet an important semantic distinction must be made here: Proliferation refers to mitosis and apoptosis of cells, whereas growth refers to the changing mass of a population. As discussed later, they are not equivalent. Nevertheless, cellular proliferation and the pattern of tumor growth both relate to such meaningful biologic characteristics of a cancer as its tendency to invade, to metastasize, to be lethal, and to respond to drug therapy.
A concept fundamental to cell physiology as well as cellular kinetics is that cell proliferation is itself, via errors in DNA homeostasis, the cause of tumor heterogeneity.1 Cell proliferation also generates tumor growth. Hence, the mathematical growth curves that summarize clinical course also relate to the rate of emergence of gene and chromosomal changes toward increased metastatic potential and drug resistance. Understanding the fundamentals of growth curves, therefore, may provide important clues regarding better treatment, improved prognostication, and, ultimately, effective cancer prevention.
EXPONENTIAL GROWTH AND THE SKIPPER-SCHABEL-WILCOX MODEL
The Skipper-Schabel-Wilcox growth curve model, also called the log-kill model, was the first, the most important, and still the most influential concept in the biomathematics of modern oncology.2,3 Its implications are so broad and so profound that it is hard to overestimate its impact on cancer medicine. Such basic ideas as multicycle chemotherapy, combination chemotherapy, the importance of the measurement of partial and complete remission rates and durations, and the association between cytotoxicity and survival prolongation arose in an intellectual environment dominated by Skipper’s concept of tumor growth. Yet these many years after the conception of the model, we still do not understand its basis in cell biology. This indicates how far we have yet to go in connecting our basic understanding of cell function with our appreciation of the phenomenology of growth.
The log-kill model was formulated from observations of leukemia L1210 in BDF1 or DBA mice. This tumor grows by a pattern called exponential until it reaches a lethal tumor volume of 109 cells, equivalent to 1 cc in volume.4 The biologic fact is that 90% of the leukemia cells divide every 12 to 13 hours. The 90% figure is an example of a growth fraction. This percentage does not change appreciably as leukemia grows from a tiny number of cells to a number close to the lethal volume. As a result of this constancy in growth fraction, the doubling time is
always constant. Indeed, exponential growth is defined as growth with a constant doubling time. This means that it takes approximately 11 hours for 100 cells to double into 200 cells. Similarly, it takes 11 hours for 105 cells to grow into 2 × 10⁵ cells or for 107 cells to grow into 2 × 10⁷ cells. This pattern applies not just to doubling but also to any constant fractional increase. That is, because it takes 40 hours for 103 cells to grow into 104 cells, an increase of a factor of 10, it takes 40 hours for 107 cells to grow into 108 cells.
always constant. Indeed, exponential growth is defined as growth with a constant doubling time. This means that it takes approximately 11 hours for 100 cells to double into 200 cells. Similarly, it takes 11 hours for 105 cells to grow into 2 × 10⁵ cells or for 107 cells to grow into 2 × 10⁷ cells. This pattern applies not just to doubling but also to any constant fractional increase. That is, because it takes 40 hours for 103 cells to grow into 104 cells, an increase of a factor of 10, it takes 40 hours for 107 cells to grow into 108 cells.
Exponential growth, with its constant doubling time and its constant fractional increase time, has been attractive to clinicians because, were it to apply in nature to human cancer, it would have concrete clinical implications.5 Although doubling time can be measured in any tumor that doubles in size over a period of observation, this does not mean that the doubling time so measured is constant. Nevertheless, doubling times have been measured for many histologic types of cancer.5 One of the key observations in this regard is that the results of such measurements are heterogeneous among cancers of the same type and among cancers of different types. Despite such heterogeneity, some interesting patterns can be noted. For example, the human cancers that respond best to drug therapy, such as testicular cancer and gestational choriocarcinoma, tend to have doubling times on the short side, that is, <1 month. Less responsive cancers, such as squamous cell cancer of the head and neck, seem to double over approximately 2 months. The unresponsive cancers, such as colon adenocarcinoma, have longer doubling times, 3 months or longer. This observation— and the observations of L1210 that preceded it—supported the notion that chemotherapy damages dividing cells as its primary mode of action. That is, because shorter doubling time implies higher growth fraction, perhaps coupled with low spontaneous death fraction, in a cancer with a shorter doubling time more cells should be at risk for cytotoxic damage.
Since the time of the formulation of the log-kill model, little has happened to dispel the concept that the quantitative measure of cellular proliferation, the mitotic rate, and the quantitative measure of cancer cell death in response to therapy, the cell-kill rate, are positively associated. However, another side to this issue is the rate of emergence of cancer cells that are biochemically resistant to anticancer therapy. Growth is only partially related to cell proliferation; it is also dependent on cell loss, largely by apoptosis. (The influence of histologic architecture on the growth rate is discussed separately.) Tumors with higher rates of cell loss tend to have slower growth rates than tumors that have similar proliferative rates but lower cell loss fractions. The combination of a high cell-production rate and a high cell-loss rate results in a large number of mitoses per unit of time. The probability of mutation correlates with the mitotic rate. Hence, the combination of a large growth fraction and a large death fraction would be expected to produce a high rate of genetic change toward drug resistance. A mathematical formulation of this concept is discussed in the section Delbrück-Luria Concept. It is possible that the tumors that have short doubling times have good response rates to chemotherapy not because (or not just because) of their large growth fractions but because (or also because) of relatively small cell-loss fractions. This would limit the number of mitoses per unit of time in these tumors, and hence, limit the emergence of clones that are rendered drug resistant by acquired genetic alteration.
The discoverers of the log-kill phenomenon did not discover exponential growth, but they did make a fundamental observation regarding the way exponential tumors respond to therapy. The empiric observation is that if a tumor grows exponentially and is homogeneous in drug sensitivity, the fraction of cells killed by a specific chemotherapy regimen is always the same regardless of the initial size of the malignant population. This finding, never fully explained mechanistically but reproducibly true in exponential growth animal cancers, is the essence of the log-kill model.
The log-kill model means that if a drug treatment reduces 106 cells to 105, the same therapy would reduce 104 cells to 103. Examples of a one-log kill are 106 to 105 and 104 to 103, meaning a 90% decrease in cell number (log here refers to logarithm to the base 10). For many drugs, the log kill increases with increasing dose, so that higher drug dosages are needed to eradicate larger inoculum sizes of transplanted tumors.6,7 Let us examine the implications of this concept. Drug dose 3x can be thought of as drug dose 2x plus drug dose x. If another drug is given at dose y, and if the cell kill from y equals the cell kill from x, 2x plus y would be equivalent in terms of log kill to 3x. The superiority of 3x over x and of 2x plus y over x implies that if two or more drugs are used, the log kills are multiplicative. If a given dose of drug A kills 90 of the cells (a one-log kill) and a given dose of drug B kills 90, drug A given with drug B should kill 90 of the 10 cells left after B alone, resulting in a cell kill of 99%, called a two-log kill. If C also kills 90, A plus B plus C should result in a three-log kill (99.9%), and so on. By this line of mathematical reasoning, rooted fundamentally on the assumption of exponential growth, if enough drugs at adequate doses are applied against a tumor of sufficiently small size, less than one cell should be left, which is the definition of cure. This seminal concept was of major value in the history of the development of effective treatments for childhood leukemia.8 All modern combination chemotherapy owes its rationale to the idea of multiplicative log kills.
Application of Log Kill to More Complex Growth Curves
When log-kill concepts were first considered in the context of the postoperative adjuvant treatment for micrometastases, they generated much optimism.9,10 Micrometastases are very small collections of cancer cells, and very small solid tumors in the laboratory contain a higher percentage of actively dividing cells than larger examples.11,12 This is a violation of the assumptions of the log-kill model because the growth fraction of micrometastases is not the same as that of larger tumors, but greater. Yet, if chemotherapy preferentially kills mitotic cells, the fraction of cells killed in these small tumors should be great. Therefore, if the assumptions of the log-kill model are wrong, the error should be in the direction of underestimating the impact of chemotherapy against micrometastases. Small-volume tumors should be more easily cured by combination chemotherapy than even this optimistic model would have predicted. Hence, adjuvant chemotherapy should easily eradicate clinical cancer.
Clinical experience has not confirmed these optimistic predictions. For example, let us examine the postoperative adjuvant chemotherapy of early stage breast cancer. Such chemotherapy at conventional doses does reduce the probability of the development of obvious distant metastases and does result in improved survival, but this effect is relatively modest.13 What are the reasons for this divergence between theory and data? Is it because the chemotherapy duration is too short? The log-kill model allows for this possibility. To illustrate this, let us assume that a given drug treatment causes a one-log kill with each application. Six cycles of that treatment should reduce tumors of 106 cells to just one cell. For this reason, six cycles should cure tumors of <106 cells. Tumors of >106 cells would merely need more cycles to accomplish the desired result. Yet, the hard fact is that adjuvant chemotherapy programs of >4 to 6 months do not improve results in the treatment for primary breast cancer.13 Hence, the failure of the log-kill model to predict the modest effect of adjuvant chemotherapy cannot be explained by insufficient duration of treatment.
This latter conclusion presents an enigma. The log-kill model is unquestionably applicable to experimental cancers that grow exponentially. Yet, its application to human disease is unsatisfactory. To resolve this mystery, we need to examine the model more carefully. Two major assumptions implicit to the model are exponential growth and homogeneous sensitivity to a given chemotherapy. Regarding this latter assumption, the log-kill model does not work well if some cells in the tumor are biochemically refractory to the applied dose levels of the agents used. If such cells exist, once all sensitive cells are eliminated by a specified duration of treatment, more chemotherapy of the same type will not help.
Skipper and colleagues recognized that such resistance is often acquired by random mutation during a cancer’s growth history, at least in experimental systems chosen for drug sensitivity before the beginning of the experiment. That is, an aliquot of cancer cells is taken from a batch that is known to be sensitive to a given drug. That aliquot is grown in a recipient host but is found to be resistant to that drug at a certain time point after transplantation. Skipper and colleagues observed that the likelihood of the emergence of resistant clones was directly related to the time of growth. Hence, the only way to guarantee the absence of resistant cells would be to initiate therapy when the tumor is so small that recalcitrant mutants have not yet had time to develop. Drug-resistant cells are indeed found only rarely in small aliquots of Skipper’s transplantable mouse leukemia. In human terms, this concept would mean that resistant cells would have to arise spontaneously between the time of the carcinogenic event and the appearance of larger diagnosable tumors.
The power of this idea is evident. According to this thinking, to design universally effective drug therapies for all cancers we need only answer two questions: When does drug resistance arise in the time course of growth? How can we diagnose cancer early enough to catch the disease before this happens?14,15
Delbrück-Luria Concept
To approach answers to these two questions, we must consider quantitative models of the emergence of drug resistance. Drug resistance is a known fact in cancer therapeutics.16 The first theory concerning the rate of emergence of drug resistance derived from pioneering experiments in bacteriology by Luria and Delbrück in the 1940s. They discovered that different culture dishes of the same bacterial strain developed resistance to bacteriophage infection at different random times before exposure to the viruses.17 They could measure the percentage of cells that had randomly acquired such resistance by exposing each bacterial culture to the bacteriophage. The percentages varied from culture dish to dish even though all cultures started off with the same number of the same bacteria. They reasoned that cultures that had experienced a mutation earlier in their growth histories had more time to develop a high percentage of resistant bacteria.
The mathematics of this phenomenon can be explained as follows: If a bacterium mutates toward property × with probability x at each mitosis, the probability of the cell not developing property × in one mitosis is PX(0) = (1 – x). The probability of no mutations toward × occurring in y mitoses is (1 – x)y. If each mitosis produces two viable cells (i.e., the assumption of no cell loss), it takes (N – 1) mitoses for one cell to grow into N cells. Hence, the probability of not finding any bacteria with the property × in N cells is exp[(N – 1) × ln(1 – x)], which is approximately exp[-x(N – 1)] for small x. Should any cell loss be present, it would take >(N – 1) mitoses to produce N cells, and therefore the probability is <PX(0) = exp[-x(N – 1)].
Within a decade of Delbrück and Luria’s original observation in bacteria, Law18 found that this same mathematical pattern applied to the emergence of methotrexate resistance in L1210 cells. Drug (or, at least, antimetabolite) resistance was thus reasoned to be a trait that was acquired spontaneously at random times in the pretreatment growth of this cancer.
Time has not diminished the enthusiasm of scientists for this quantitative concept of acquired hereditable genetic alterations, although the spectrum of possible abnormalities continues to expand. Aneuploidy is an obvious consequence of genomic instability and, like drug resistance, should increase in probability as a function of the number of passages through S phase.19,20,21 Because the presence of a consequentially large cell-loss fraction should increase the number of passages through S phase in a cell population’s history, the probability of finding significant genetic alterations should increase under those conditions.
In a qualitative sense, the observations and reasoning of Delbrück, Luria, Law, and subsequent scientists had a profound influence on the genesis of the concept of combination chemotherapy22 which is, after all, the central theme of modern medical oncology. When asked to deal with a mature cancer, even at the time of first diagnosis, the therapist could well be faced with a disease heterogeneous in drug sensitivity. The probability of there being resistant clones would be increased by the combination of a high mitotic rate and a high apoptotic rate. In that case, the only hope for tumor eradication would rest with combinations of drugs, each drug hitting a sensitive clone within the tumor mass. This hope is based on the improbability that any one cell could spontaneously become resistant to many different drugs with different biochemical sites of action.23
Goldie-Coldman Model
The improbability of multiple drug-resistant cells was reexamined quantitatively in 1979 by Goldie and Coldman.23,24 They first considered simple conditions but later refined their model to include multiple sublines with double or higher orders of drug resistance and the presence of cell loss.25 Their fundamental conclusion can be illustrated by reference to the expression PX(0) = exp[-x(N – 1)] that we derived earlier: At a tenable mutation rate x = 10-6, the probability of no mutants in N = 105 cells is approximately 0.9, meaning that most low cell-loss tumor masses of 105 cells are free of drug-resistant cells. However, the probability of finding no drug-resistant mutants in 107 cells is only 4.5 × 10⁻⁵, meaning that it is almost certain that a 107 cell mass harbors at least one drug-resistant mutant. Hence, according to this model, a growth of two logs can transform a tumor from drug curable to drug incurable.
Although created to address the emergence of drug resistance, perhaps a better illustration of the power of this concept concerns a cell’s metastatic ability. Because normal cells cannot survive in an environment other than their natural one, the capability of metastasizing must be an acquired trait and therefore a reflection of genetic lability.26 In primary breast cancer, the most reliable predictor of axillary metastases is tumor size. Only 17% of invasive ductal lesions <1 cm in diameter are metastatic to the axilla, contrasted with 41% of lesions of 2 cm in diameter and 68% of tumors27 of 5 to 10 cm. The presence of axillary metastases, in turn, is the best predictor of eventual metastatic spread. For primary breast cancers that do not involve axillary lymph nodes, the probability of eventual distant metastases is also a function of tumor size. This probability increases sharply when the primary mass in the breast is found to be >1 cm in diameter.28 The volume of 107 cancer cells is approximately 0.01 cc if the whole mass is cancer and approximately 1.0 cc if only 1% is cancer, 99% being benign host tissues such as stromal cells, fibrosis, extracellular secretions, and blood and lymphatic vessels. A 1-cc spherical tumor, the critical size regarding prognosis in node-negative breast cancer, contains a volume of slightly >0.5 cc. This is right in the middle of the range of 0.1 to 1.0 cc described earlier for 107 cells. Hence, clinical observations regarding the probability of metastases fit the Goldie-Coldman model, although other explanations are possible, as described in the penultimate section of this chapter.
Clinical implications of the Goldie-Coldman model
As it relates to drug resistance, the Goldie-Coldman model has generated testable predictions. It predicts that a cancerous mass arising from a single drug-sensitive malignant cell has at most a 90% chance of being curable at 105 cells but almost no chance of being curable at 107 cells. Hence, even at the most liberal packing ratios of cancer cells to benign stroma, tumors >1.0 cc should always be incurable with any single agent. The logical development of this idea is that the best strategy is to treat a cancer when it is as small as possible, before its cells can develop resistance. Once treatment is started, as many effective drugs as possible should be applied as soon as possible to prevent cells that are already resistant to one drug from mutating to resistance to others.
These recommendations are equivalent to the intuitive principles underlying combination chemotherapy, which were originally constructed to deal with drug resistance present at the time of first diagnosis.29 However, Goldie and Coldman went beyond this to suggest a novel treatment plan. They recognized that sometimes many drugs cannot be used simultaneously at good therapeutic levels because of overlapping toxicity or competitive interference. They reasoned that in this case the drugs should be used in a strict alternating sequence. This hypothesis was based on several assumptions in addition to the general assumption that chemotherapeutic failure is because of drug resistance. (The following assumptions are concordant with the general mathematical concept of symmetry.) Imagine that a tumor is comprised of two cell populations, A and B, both of which are growing in a Gompertzian manner (Fig. 2.1). Here, we assume that the A cells (panel A, black line) are sensitive only to therapy A, the B cells (panel B, blue line) are sensitive only to therapy B, and the total tumor growth is a combination of A and B (panel C). The second assumption was that the rate of mutation toward biochemical resistance is constant in both sublines. That is, the A cells mutate toward resistance to A at the same rate as the B cells mutate to acquire resistance to B. The third assumption was that the growth pattern and growth rates of the two sublines were equivalent.30
Let us examine the assumptions, conclusions, and implications of this very important model. Is all chemotherapeutic failure rooted in absolute drug resistance? Much clinical experience challenges this concept. When lymphomas and leukemias recur after chemotherapy-induced remission, they frequently respond to the same chemotherapy again. Patients with Hodgkin disease who experience relapse 18 or more months after they have achieved complete remission from combination chemotherapy have an excellent chance of attaining complete remission again when the same chemotherapy is reapplied.31 Similarly, breast adenocarcinomas that relapse from postoperative adjuvant chemotherapy frequently respond to the same chemotherapy. For example, a Cancer and Leukemia Group B (CALGB) protocol treated patients with advanced breast cancer with cyclophosphamide, doxorubicin (Adriamycin), and 5-fluorouracil (CAF) with or without tamoxifen.32 None of these patients had had prior chemotherapy for their advanced disease, but some had had prior adjuvant chemotherapy. Nevertheless, the odds of response, the duration of responses, and the overall probability of survival were unaffected by a patient’s past history of adjuvant chemotherapy. A similar series of observations resulted from clinical trials at the National Cancer Institute in Milan. Patients in whom stage IV breast cancer developed after adjuvant cyclophosphamide, methotrexate, and 5-fluorouracil (CMF) responded as well to CMF for advanced disease as those who had been previously randomized to be treated with radical mastectomy alone.33 These findings mean that breast cancers that regrow after exposure to adjuvant CMF are not universally resistant to CMF.34 Hence, not all chemotherapeutic failures can be because of permanent drug resistance. In addition, some patients respond to standard doses of chemotherapeutic regimens following relapse after higher doses of chemotherapy used in an autologous bone marrow
transplant setting. Although it is possible that some cancers escape cure because of a temporary absolute drug resistance that reverses over time, it is more likely that sensitive cells are somehow not completely eradicated by drugs to which they are still sensitive.
transplant setting. Although it is possible that some cancers escape cure because of a temporary absolute drug resistance that reverses over time, it is more likely that sensitive cells are somehow not completely eradicated by drugs to which they are still sensitive.
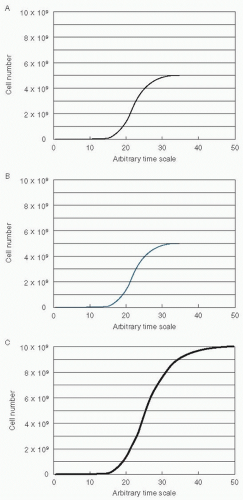 Figure 2.1 Tumor growth in Gompertzian manner. A: Cells are sensitive only to therapy A (black line). B: Cells are sensitive only to therapy B (blue line). C: Total tumor growth (combination of A and B). |
Before we consider the implications of this latter possibility, let us return to the specific conclusions of the Goldie-Coldman model. Are tumors >1.0 cc always incurable with single drugs? The answer is no. Two rapidly growing cancers, gestational choriocarcinoma and Burkitt lymphoma, have been cured with single drugs, even when therapy is initiated at tumor sizes35 much >1.0 cc. Other counterexamples to the incurability of large cancers are childhood acute lymphoblastic leukemia, most pediatric cancers, adult lymphomas, and germ cell tumors, which are frequently cured with couplets and triplets of drugs. Hence, the presence of 107 cells does not always signify incurability.
With respect to the previous discussion regarding metastatic potential, neither does the presence of 107 cells always signify that the tumor must have acquired the ability to thrive in distant sites. In fact, the whole notion that cancers develop deleterious mutations rapidly as they grow is challenged by observations of the probability of metastatic disease. For example, standard practice until the late 19th century was not to operate on primary breast cancer but to allow it to grow unperturbed.36 Under such conditions, the cancers would almost always become metastatic. In the 20th century, radical mastectomy was invented, later to be replaced by simple mastectomy with axillary dissection and now lumpectomy with regional radiotherapy. Long-term follow-up of patients being treated by radical mastectomy in the middle of the century indicated that the natural history of untreated breast cancer could be altered by surgical removal. Even without adjuvant systemic treatment of any sort, at 30 years of follow-up >30% of patients are found to be alive and free from disease.37,38 The mortality, initially approximately 10% per year, drops gradually to approximately 2% per year by the 25th year39 and after 30 years is indistinguishable from that of the general population.40,41 The fact that the development of systemic disease is so common means that most breast cancers have already developed metastases by the time of initial presentation. Yet the fact that not all cancers develop this ability means that the previous calculations for PX(0) for 107 cells cannot be realistic.
Let us look at this issue another way. If local control is poor and the cancer cells in the breast are not completely removed or destroyed so that they eventually regrow to a clinically appreciable mass, will they always mutate rapidly to produce metastatic clones? This question was asked by a protocol of the National Surgical Adjuvant Breast and Bowel Project (NSABP), in which some patients with primary disease were treated by lumpectomy without radiotherapy.42 The local relapse rate was significant, but survival was close to that of patients treated adequately de novo by lumpectomy and immediate radiotherapy. Some metastases from residual cancer should be expected, even if the residual cells did not progress in their ability to release metastatic clones; therefore, longer follow-up might eventually reveal a higher rate of distant metastases. However, the lack of a blatant difference so far indicates that tumor can remain in a breast, grow in the breast, and yet not develop metastatic cells at a very high rate, as would be predicted by the Goldie-Coldman model. In addition, a recent meta-analysis of 25 randomized trials of postmastectomy radiotherapy versus no radiotherapy demonstrated a small but significant improvement in overall survival with radiation for patients with node-positive disease.43 The important observation is that the benefits, although real, are small. This means that tumor
can metastasize from the chest to other sites, but this does not occur at a very high rate.
can metastasize from the chest to other sites, but this does not occur at a very high rate.
Returning to the issue of drug sensitivity, what is the evidence that chemotherapy must be started as soon as possible after diagnosis to be effective? An early trial in the treatment for acute leukemia found that the response to an antimetabolite was the same if that drug was used first or sequentially after the use of a different antimetabolite.22 Hence, delay was not harmful, which contradicts the prediction of the Goldie-Coldman model. A randomized trial by the International (Ludwig) Breast Cancer Study Group found a similar result. Patients with node-positive breast cancer were given either 7 months of chemotherapy starting within 36 hours of surgery or 6 months of chemotherapy beginning approximately 4 weeks after surgery.44 Because the results were the same, the delay was not harmful here either.
Similarly, patients with metastatic breast cancer whose disease responded completely to standard-dose chemotherapy were randomized to immediate high-dose chemotherapy and hematopoietic stem cell reinfusion (i.e., autotransplantation) versus observation.45 On relapse, most of the patients who were originally randomized to standard-dose chemotherapy were subsequently treated with the same high-dose chemotherapy. Final results demonstrate a greater event-free survival for those in the immediate transplantation arm versus the delayed transplantation arm but no significant difference in overall survival. Patients with stage II nonseminomatous testicular cancer were randomized after retroperitoneal lymph node dissection to either two cycles of cisplatin combination chemotherapy or to untreated observation.46 At a median follow-up of 4 years, 49% of patients who were randomized to observation relapsed, in contrast to only 6% of patients randomized to adjuvant chemotherapy. Yet the response of relapsing cases to subsequent chemotherapy was so excellent that no significant survival differences were found in the cure rate between the two approaches. Hence, most testicular carcinomas retained their chemosensitivity in spite of the delay in the initiation of treatment. In all of these examples, cells that are residual after surgery grow unimpeded without rapidly developing drug-resistant mutants.
Let us look at another conclusion of the model. Must all drugs in an adjuvant regimen be introduced early to have a biologic impact? A trial by the CALGB has concluded that this is not the case.47,48 Patients with primary breast cancer and positive axillary lymph nodes were treated with 8 months of adjuvant CMF plus vincristine and prednisone (CMFVP) followed by either more CMFVP or 6 months of the combination of vinblastine, doxorubicin, thiotepa, and the androgen fluoxymesterone (Halotestin; VATH). Patients who received the crossover therapy, especially those with four or more involved axillary nodes, experienced a significantly improved disease-free survival. Clearly, overwhelming cellular resistance to the agents in VATH did not develop rapidly in the cells that were not eradicated by the CMFVP. Seeming to contradict these results, a trial in Milan found no advantage to a sequence of doses of doxorubicin after CMF for patients with one- to threeinvolved nodes.49 Moreover, the collection of patients with better prognoses may not be the ideal population for testing such hypotheses. Chemotherapy works by reducing the annual odds of recurrence and death.13 If the crossover works for all patients by reducing the rate of relapse by a certain percentage of that rate, those with lower rates of relapse without the crossover would experience a lower absolute benefit from the crossover than those at higher risk for relapse. Hence, the effect would exist in good-prognosis patients but be more apparent in those with poorer prognoses. One could also postulate from the Goldie-Coldman hypothesis that administration of chemotherapy preoperatively may be more beneficial. Indeed, their model was one of the prime reasons why preoperative chemotherapy was considered as a potentially useful approach. However, several trials have found no significant improvement in clinical outcome with the administration of preoperative chemotherapy for early stage operable breast cancer.50,51,52
The unique assertion of the Goldie-Coldman model, the hypothesis most commonly linked to this theory, concerns the potential superiority of alternating chemotherapy sequences. In the clinic, however, this strategy has not been demonstrated to be superior. Little benefit has been found in numerous attempts to use alternating chemotherapy sequences in the treatment for small-cell lung cancer.53 In the treatment for diffuse, aggressive non-Hodgkin lymphoma, a National Cancer Institute trial found no advantage to a prednisone, methotrexate, doxorubicin, cyclophosphamide, etoposide (ProMACE)-mechlorethamine, vincristine, procarbazine, prednisone (MOPP) hybrid, which delivered eight drugs during each monthly cycle over a full course of ProMACE followed by MOPP.54 In the treatment for advanced Hodgkin disease, MOPP has been compared with MOPP alternating with doxorubicin, bleomycin, vinblastine, and decarbazine (ABVD), an effective first-line therapy and salvage regimen for patients whose disease is refractory to MOPP.55,56 MOPP-ABVD was found to be superior to MOPP in producing complete remission in chemotherapy-naive patients and in freedom from progression and survival.57,58 An ABVD control arm was not studied. It is interesting, therefore, that the CALGB found that the complete remission rate and failure-free survival from MOPP-ABVD was better than that from MOPP alone but equivalent to ABVD alone.59
Considering these results, the superiority of MOPP-ABVD and of ABVD over MOPP alone may have been because of differences in dose received. No advantage was found to the alternating scheme MOPP-ABVD over ABVD alone. A similar result was found by the National Cancer Institute in its study of MOPP alternating with lomustine, doxorubicin, bleomycin, and streptozocin, which was equivalent to the use of MOPP alone.60 An intergroup trial found that a hybrid of MOPP-ABVD was superior in complete remission rate, failure-free survival, and overall survival to MOPP followed by ABVD.61 The doses of MOPP were similar in both arms, although the doses of doxorubicin were somewhat lower in the sequential arm.
As with the lymphomas, alternating strategies have not proved superior in the treatment for breast cancer. The VATH regimen is active against tumors that relapse from, or fail to respond to, CMF and thereby meets the criterion of noncross resistance. Yet in patients with advanced disease, the CALGB
found no advantage to CMFVP alternating with VATH over CAF or VATH alone.62
found no advantage to CMFVP alternating with VATH over CAF or VATH alone.62
Sequential Chemotherapy
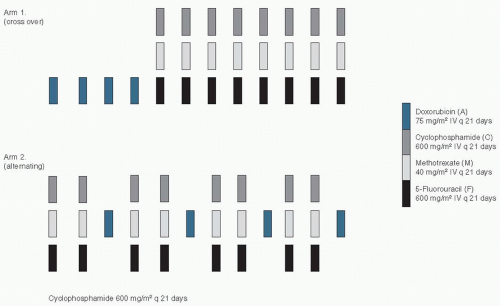
An interesting variant on the alternating chemotherapy idea concerns the use of drugs in sequenced courses. In the adjuvant setting, a direct comparison of alternating and sequential chemotherapy was conducted in Milan. The sequential approach was described earlier by reference to the use of VATH after CMFVP by the CALGB, also in the adjuvant setting.47 The National Cancer Institute in Milan had had a previous positive experience with sequential chemotherapy,63 but this was not a randomized trial and therefore did not test the concept.64 To test the concept, Bonadonna and his colleagues65 randomized women with early breast cancer that involved four or more axillary lymph nodes to one of two treatment arms. Arm I prescribed four 3-week cycles of doxorubicin (A) followed by eight 3-week cycles of intravenous (IV) CMF, whereas arm II patients received two cycles of intravenous IV CMF alternating with one course of doxorubicin (Fig. 2.2). The total amounts of doxorubicin and CMF in both arms were equal, as were the durations of therapy and the spacing of cycles. Remarkably, the patients who received arm I had a higher disease-free survival and a higher overall survival than those on arm II. At equivalent received doses, alternating courses of chemotherapy were found to be inferior to a crossover therapy plan.66 To illustrate this further, in Figure 2.3 we see two growth curves of blue and black cells, which make up a tumor mass. The “blue” cells are sensitive to the therapy symbolized by the blue arrows (e.g., doxorubicin) but are resistant to the therapy symbolized by the black arrows (e.g., CMF). Similarly, the “black” cells are sensitive to the therapy symbolized by the black arrows (CMF), but are resistant to the therapy symbolized by the blue arrows (doxorubicin). In panel A, the treatment is administered sequentially, as per arm I (crossover) in the trial described above. In panel B, the alternating treatment approach is used as per arm II in the study above. It is clear that the log-kill from the sequential approach (panel A) is greater in the “blue” cancer cells and not inferior in the “black” cells. Hence, the overall cytoreduction is greater with the sequential approach, as illustrated by the time for the blue curve to reach 1010 cells (dashed line).This model illustrates how sequential therapy can result in better outcomes for patients and explain the result in the clinical trial described earlier.
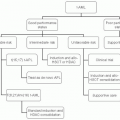
The sequential chemotherapy strategy is also useful in the treatment for leukemia. In adult acute myelogenous leukemia, complete remission is obtained commonly with cytarabine plus anthracyclines. However, the median remission duration tends to be short. Given at low doses, postremission maintenance therapy is relatively ineffective, and this is not improved by a longer duration of treatment (32 months vs. 8 months of the same therapy).67,68 A more recent trial questioned the effectiveness of intensive rather than conventionally
dosed postremission chemotherapy, basing its rationale on the steep dose-response curve for cytarabine.69 The trial studied 596 of 1,088 patients who had achieved complete remission from standard induction chemotherapy and found that the highest-dose regimen was the most effective of three different dose schedules of cytarabine. In fact, the best results were comparable to those reported in patients with similar disease who were treated by allogeneic bone marrow transplantation during first remission.70 In support of this result, the Children’s Cancer Study Group found that intensive induction followed sequentially by intensive consolidation and later intensification was superior to other strategies in the treatment for childhood acute lymphoblastic leukemia.71
dosed postremission chemotherapy, basing its rationale on the steep dose-response curve for cytarabine.69 The trial studied 596 of 1,088 patients who had achieved complete remission from standard induction chemotherapy and found that the highest-dose regimen was the most effective of three different dose schedules of cytarabine. In fact, the best results were comparable to those reported in patients with similar disease who were treated by allogeneic bone marrow transplantation during first remission.70 In support of this result, the Children’s Cancer Study Group found that intensive induction followed sequentially by intensive consolidation and later intensification was superior to other strategies in the treatment for childhood acute lymphoblastic leukemia.71
Related posts:

Stay updated, free articles. Join our Telegram channel

Full access? Get Clinical Tree


