Growth is a dynamic process influenced by many intrinsic and extrinsic factors that interplay to determine not only ultimate attained height but also the tempo and timing of increase in height. Research continues to unravel hormonal and genetic complexities that account for variations in “normal” growth, and etiologies for disordered growth. Careful tracking of childhood growth is a sensitive indicator of health and well-being, and therefore an essential component of sound pediatric care. Detection of unexplained acceleration or deceleration in growth rate or tracking along a disparate percentile considering family height genetics should prompt investigation. Endocrine disorders comprise an important, but only partial, differential diagnosis of abnormal growth. This chapter discusses essential components of normal growth, the detection and evaluation of worrisome growth, and diagnosis and treatment of its multiple etiologies. The ultimate goal is to provide for those caring for children a conceptual framework for the assessment of and diagnostic approach to the child with abnormal growth.
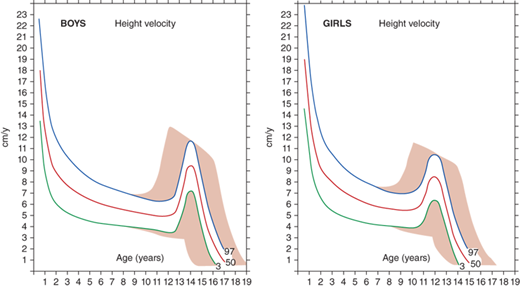
The rate of linear growth and the physiologic components regulating it vary with age. Conceptually, it is helpful to define growth as occurring in four discrete but congruent phases—prenatal, infancy, childhood, and adolescence. According to the infancy-childhood-puberty growth model, phases are successive and partly superimposed. The infancy phase has been assumed to begin at mid-gestation and to tail off at approximately 2 to 3 years of age. It is regarded as being predominantly nutrition dependent. The childhood growth phase overlaps the infancy phase, begins sometime between 6 and 12 months of age, and is typically abrupt in onset. Its starting point probably defines the age at which intrauterine factors recede and growth hormone (GH) begins toexert significant influence (Figure 2-1).1 It has been shown that the timing of infancy-childhood transition is significantly associated with final adult height, and a delayed transition is the most common predictor of later idiopathic short stature (ISS).2 The transition from the childhood to puberty phase is characterized by an abrupt increase in sex hormones with a concomitant increase in GH secretion, and the contribution of the changing growth rates during puberty is reflected by the sigmoid pattern of height gain. The considerable individual variation in timing of puberty between early- and late-maturing children is depicted by brown shaded areas in Figure 2-2.
Figure 2-1
Phases of childhood growth. (Redrawn with permission from Karlberg J, Engstrom I, Karlberg P, Fryer JG. Analysis of linear growth using a mathematical model. I. From birth to three years. Acta Paediatr Scand. May 1987;76(3):478-488.1)
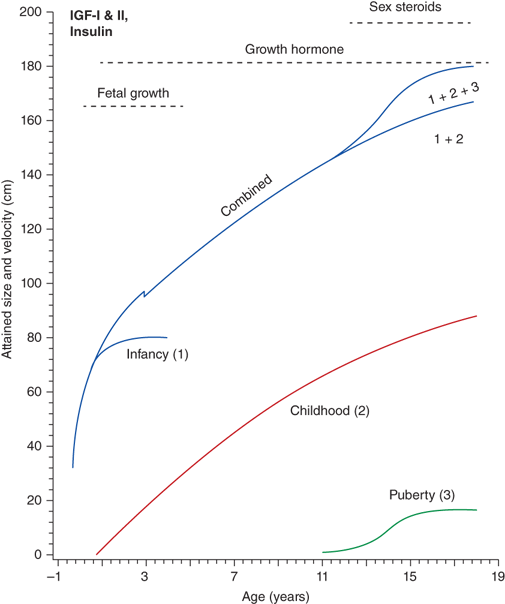
Early detection of deviation from normal growth velocity is the key to prompt evaluation and diagnosis of a child with a growth abnormality. Intrauterine growth occurs at a rate of approximately 1.2 to 1.5 cm per week, peaking at mid-gestation (18 weeks) at 2.5 cm per week and slowing to 0.5 cm per week just before birth. Intrinsic and extrinsic factors both contribute to prenatal growth and ultimate birth weight and length. Future growth patterns and genetic height tendencies, however, are not necessarily reflected at this stage. Hormonal regulation is largely by insulin and insulin-like growth factors-1 (IGF-1)and -2 (IGF-2) (see Figure 2-1). Discussed in more detail in the following discussion, maternal and uterine factors affecting fetal nutrition, insulin availability, and insulin sensitivity also have profound effects on intrauterine growth. Paternal size has relatively little influence on fetal weight gain, but paternal and maternal heights contribute roughly equally to fetal length gain. By comparison, growth hormone (GH) and thyroid hormone have only modest effects on in utero somatic growth (see the following discussion).
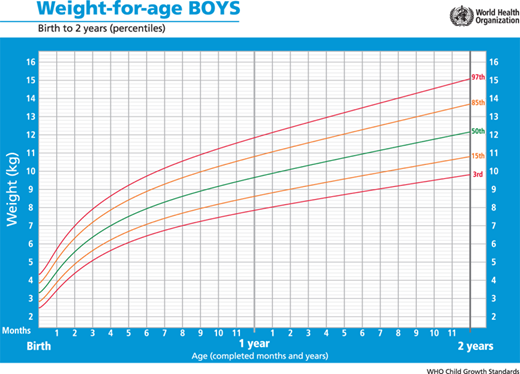
After birth, the rate of growth is simultaneously the most rapid and rapidly slowing of a child’s growth experience. This rapid slowing in growth rate coincides with diminishing postbirth sex steroid production and influence of nutrition-responsive IGF-1 effects to primary dependency on GH (see Figure 2-1). The average normal growth rates include 2.5 cm/month (0-6 months), 1.25 cm/month (7-12 months), 10 cm/year (12-24 months), 8 cm/year (24-36 months), and 7 cm/year (36-48 months). Growth rate continues to steadily decelerate through 4 years of age when the child normally transitions to the childhood phase characterized by an average growth rate of 5 to 6 cm per year (range 4.5-7.0 cm). Crossing of percentiles on the growth curve is not uncommon during the first 2 to 3 years of life. Genetic “rechanneling” (downward crossing of percentiles of a large baby [eg, affected by gestational diabetes] who is born to genetically short parents, or upward crossing of percentiles by a small baby [eg, exposed to an adverse prenatal environment] who is born to tall parents) is typically accomplished by 9 to 12 months of age. During 12 to 28 months, a tendency toward delayed growth is often manifest by growth rate deceleration that is more profound than average, resulting in down-channeling on the length-versus-age growth chart. After 36 months, normal growth follows a consistent percentile channel during the elementary school years. A prepubertal child whose growth velocity is less than 5 cm/year, whose height is less than 1st percentile, whose growth trajectory differs significantly from the family tendency, or who displays abnormal body proportions should be monitored closely and potentially evaluated.3
Depending on the age of puberty onset, growth rate may accelerate (early puberty) or decelerate (delayed puberty) compared to peers. Adolescence is marked by a return of rapid growth with peak sustained growth rates of up to 13 cm/year in boys and 11 cm/year in girls. The timing and tempo of puberty and rate of skeletal maturation differ between boys and girls; that is, the pubertal growth spurt occurs approximately 1.5 to 2 years earlier in girls than in boys, but boys grow on average 13 cm taller prior to fusion of the epiphyseal growth plates. The greater average final height in boys is in part due to this extended time in the prepubertal phase allowing for a longer period of growth prior to adolescence and partially due to the greater rate at which boys accrue height during their pubertal growth spurt.
The average onset of puberty differs not only between boys and girls but also among individuals of the same sex. The timing of sexual maturation plays a key role when assessing normalcy of growth rates (ie, determining expected growth rates for degree of skeletal maturation) and formulating height prognoses, especially when comparing an individual to population averages. The relatively broad timing of the normal onset of puberty (boys ∼9.5-14 years and girls ∼8-13 years) can cause a “late bloomer” to move downward in growth percentiles relative to their peers who are entering into the accelerated growth phase of puberty. Most of the disparity in normal adult height is accounted for by differences in growth rate (and, therefore, height achieved) prior to puberty; thus, in most cases, height at the time of puberty onset is a better predictor of a child’s final height than is age at onset of puberty.
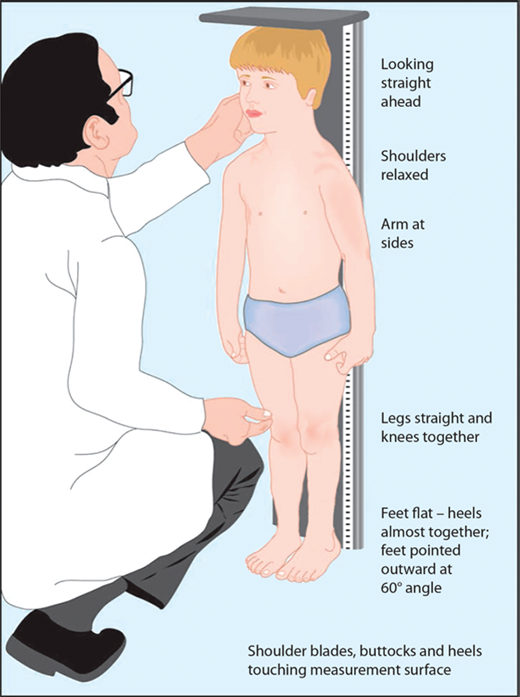
The most important tool in analysis of a child’s growth is the plotting of accurate measurements on an appropriate growth chart. Although a seemingly simple process, correct positioning of a child for accurate length or height during assessment and accurate data recording are critical and should be done by a trained individual. Recumbent length refers to stature taken while lying down. Recumbent length, used for infants and children younger than 3 years, is measured in supine position with full leg extension and with the head in the “Frankfurt plane” (Figure 2-3). This is best done using a firm box with a head plate and a movable footboard. If the child is older than 2 years and is physically able to stand on his/her own, a wall-mounted stadiometer is used for height measurement. The child, standing as erect as possible, should have four contact points: the back of his/her head, shoulder blades, buttocks, and heels, on the vertical plane of the stadiometer (Figure 2-4). The head should be aligned with a horizontal line from the ear canal to the lower border of the orbit of the eye, parallel to the floor and perpendicular to backboard. Importantly, there is discontinuity in the growth curves at age 2, which reflects the difference in recumbent length and standing height. Both length and height should be measured three times with no more than 0.3 cm variation and the mean recorded. Serial measurements taken to assess growth velocity should be obtained by the same individual to eliminate variations between examiners or equipment. Recording of data over 9 to 12 months is preferable to minimize the effects of measurement error and seasonal variations. When 4- to 6-month intervals are used, extrapolation to an estimated “annual growth velocity” is necessary for comparison with growth velocity charts.
Figure 2-3
Measurement of children younger than 2 years should be obtained in the “Frankfurt plane” that places children in the supine position in full extension with a line “drawn” between the other canthus of the eye and the corresponding external auditory meatus perpendicular to the long axis of the trunk.
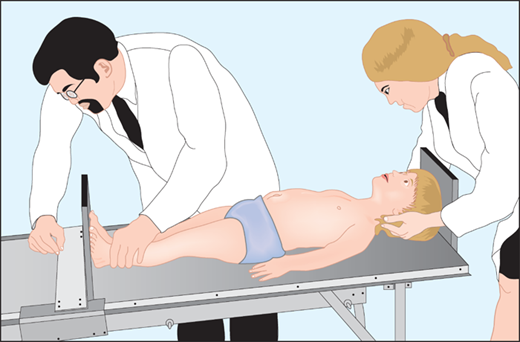
Figure 2-4
After age 2 or when the child is able to stand on his or her own, measurement should be obtained standing erect against a wall-mounted stadiometer with the back of his/her head, shoulder blades, buttocks, and heels on the vertical plane of the stadiometer. (From Kappy MS, Allen DB, Geffner ME (Ed) Principles and Practice of Pediatric Endocrinology. Springfield, IL: Charles C. Thomas Publishers Ltd.; 2005:357-485, with permission.)
Body proportions, like growth velocity, also change with age; normal large-headed and short-limbed newborns gradually transition by late childhood to “adult” proportions, with arm spans roughly equivalent to height and upper-to-lower (U/L) body segment ratios approximating one. Occipital-frontal head circumference, U/L body segment ratio (details about determination of U/L ratio in Table 2-1A and B), and arm span are useful in the assessment of short stature, tall stature, and markedly delayed or disproportionate growth. Detection of an U/L ratio above expected is characteristic of short stature owing to some genetic conditions (eg, Turner syndrome [TS] and certain chondrodysplasias), whereas a ratio below expected is observed in both some short-statured (eg, after spinal irradiation and spondyloepiphyseal dysplasia) and tall-statured (eg, Marfan syndrome) children.
1. Measure sitting height on block next to stadiometer. Subtract height of block from sitting height. This equals the height of the upper body segment. 2. Subtract the upper body segment height from the standing height. This equals the height of the lower body segment. 3. Divide the height of the upper body segment by the lower body segment. |
| Boys | Girls | |
|---|---|---|
| Age (Years) | U/L Ratio | U/L Ratio |
| Birth | 1.70 | 1.70 |
| 1/2 | 1.62 | 1.60 |
| 1 | 1.54 | 1.52 |
| 1 1/2 | 1.50 | 1.46 |
| 2 | 1.42 | 1.41 |
| 2 1/2 | 1.37 | 1.34 |
| 3 | 1.35 | 1.30 |
| 3 1/2 | 1.30 | 1.27 |
| 4 | 1.24 | 1.22 |
| 4 1/2 | 1.22 | 1.19 |
| 5 | 1.19 | 1.15 |
| 6 | 1.12 | 1.10 |
| 7 | 1.07 | 1.06 |
| 8 | 1.03 | 1.02 |
| 9 | 1.02 | 1.01 |
| 10 | 0.99 | 1.00 |
| 11 | 0.95 | 0.90 |
| 12 | 0.98 | 0.99 |
| 13 | 0.97 | 1.00 |
| 14 | 0.97 | 1.01 |
| 15 | 0.95 | 1.01 |
| 16 | 0.99 | 1.01 |
| 17 | 0.99 | 1.01 |
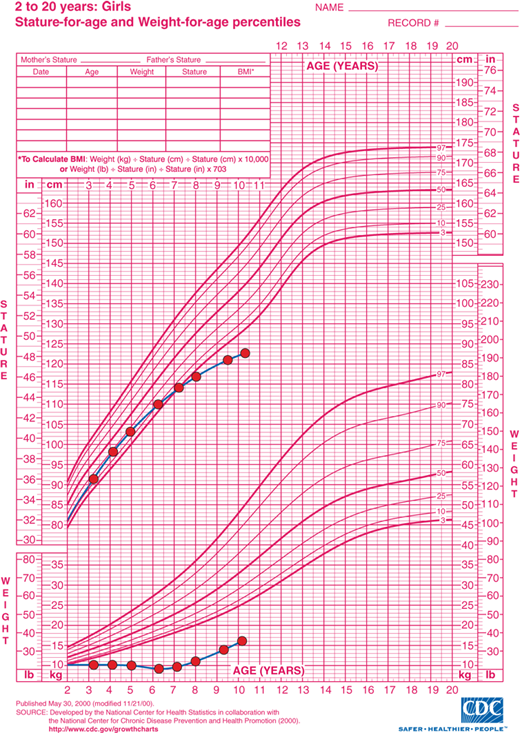
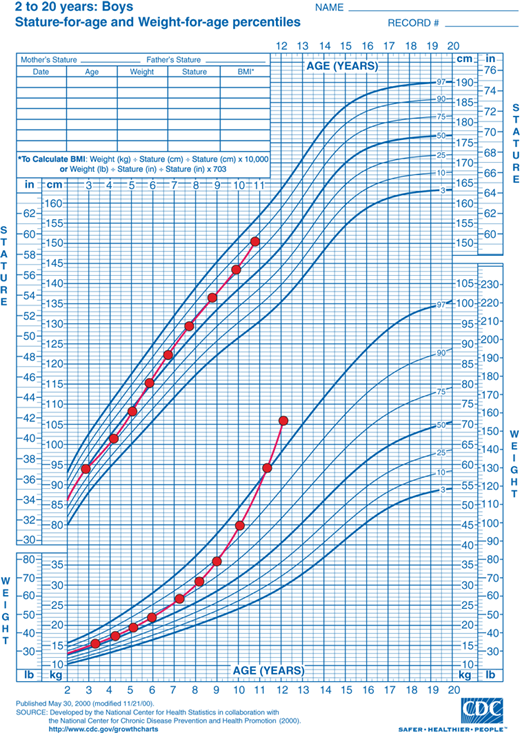
Measurement of the child (to the tenth of a centimeter) is plotted accurately against the percentiles of the population represented in the given chart. To construct a useful summation of a child’s growth, at least annual measurement and plotting of height-for-age is recommended. Calculation and plotting of growth velocity for age on reference charts (www.cdc.gov/growthcharts) allows for comparison of short-term growth with normal standards.
Growth charts should always be selected based on gender, whether height or length will be plotted, and, if relevant, any underlying syndrome. Both standing height- and length-for-age charts include data for children 2 to 3 years. As noted previously, because of normal substantial differences between an individual’s length and height, it is critical that height and length data only be plotted on height- and length-for-age growth charts, respectively. Otherwise, a misleading apparent discontinuity in the child’s percentiles may prompt unnecessary concern and evaluation.
A variety of genetic conditions affect growth, and there are specialized charts that may be considered for use with children affected by these conditions. These specialized growth charts may have some limitations. First, they are developed from relatively small homogeneous samples and, second, syndrome-specific growth charts may no longer reflect the current population. For example, for Down syndrome, it is now recommended that pediatricians use standard growth charts of the National Center for Health Statistics (NCHS) or World Health Organization (WHO) until new standards are developed.4 Alternatively, it is possible to plot the growth patterns of these children on both the specialized charts and the Centers for Disease Control and Prevention (CDC) growth charts. This will allow comparisons of growth to the general population of children and to the references for children identified with a given condition. The following link may be useful for several syndromes: http://www.dhs.wisconsin.gov.
In 2000, the NCHS (now part of the CDC) published charts based on cross-sectional data from physical examinations across the entire country (via the National Health and Nutrition Examination Survey [NHANES]) better reflecting cultural and racial diversity (www.cdc.gov/growthcharts). The percentiles plotted in these charts range from the 3rd to the 97th. For children who are growing outside of that range, the degree of short stature can be described by computing standard deviation scores (SDS) from the NCHS data: height SDS for age = (child’s height − mean height for age and sex)/SD for height for age and sex.
In 2006, the World Health Organization (WHO) released a new international growth standard for children aged 0 to 59 months. The CDC and WHO growth charts differ in their overall conceptual approach to describing growth. The WHO charts are longitudinal growth standards that describe how healthy children should grow under optimal environmental and health conditions. The curves were created based on data from selected communities worldwide, which were chosen according to specific inclusion and exclusion criteria.5 In contrast, the 2000 CDC growth charts are cross-sectional, and describe how certain children grew in a particular place and time (the United States during a span of ∼30 years [1963-1994]). Furthermore, whereas the CDC/NCHS growth charts for infants are derived from a sample of predominantly formula-fed infants, the WHO developed child growth standards for infants and young children based on the growth of breastfed infant as the biological norm. In 2010, the CDC recommended that the WHO growth charts be used in the United States for infants and children younger than 24 months, regardless of the method of feeding (Figure 2-5). When the WHO growth charts for formula-fed infants are used, normal and appropriate weight gain may appear to be too slow in the first 3 months of life and too rapid thereafter.
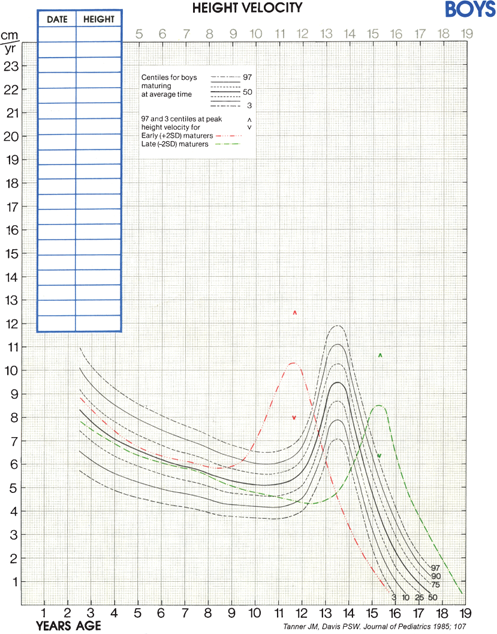
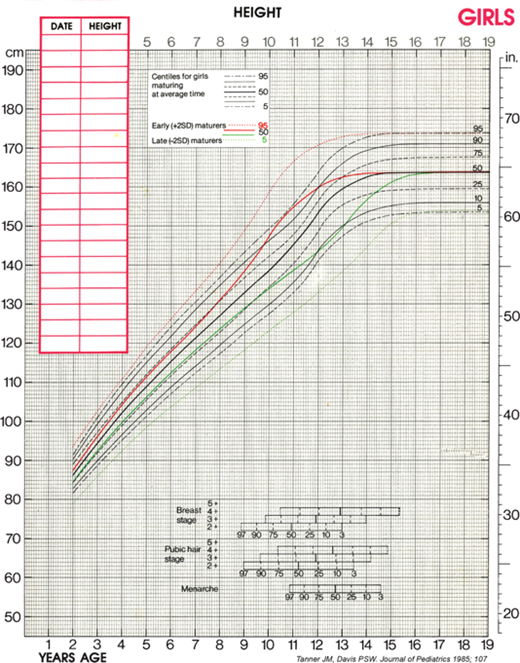
Although cross-sectional data are represented on standard height-for-age charts and are useful in assessing growth during the infant and childhood phases, they neither take into account nor depict normal variations in tempo of growth and maturation that influence timing of pubertal growth acceleration and growth termination. Height-for-age (Figures 2-6 and 2-7) and growth velocity charts based on longitudinal data that also incorporate sexual development, such as those produced by Tanner and colleagues, are more useful when comparing late- or early-maturing adolescents to population standards. These charts help the examiner take into account the relatively broad timing of pubertal onset and the acceleration of growth associated with the sexual development in an individual child.
Assessment of skeletal maturation provides information about the contribution of slowed or accelerated tempo of growth to a child’s growth pattern, and is, therefore, another key component in the evaluation of an abnormally growing child. The multiple physiologic factors involved in growth plate elongation and maturation are still being unraveled, but it is currently well established that calcitropic hormones, GH, IGF-1, thyroxine (T4), sex hormones, glucocorticoids, and C-natriuretic peptide play key roles in this process.
The rate of longitudinal bone growth is a product of the rate of differentiation and production of new growth plate chondrocytes times the average size of the terminal hypertrophic chondrocytes that form the scaffold for bone elongation. Evidence supports dual, IGF-1-independent and IGF-1-dependent, roles for GH in promoting longitudinal bone growth. GH enhances chondrocyte generation and proliferation independently of IGF-1, and IGF-1 appears to promote chondrocyte hypertrophy.6
While both androgens and estrogen are associated with acceleration in growth plate elongation and maturation, it is now known that estrogen has the predominating effect on this process. Estrogen (produced from androgens via the aromatase enzyme) controls the timing of the growth spurt and the conversion of proliferating into hypertrophic, but senescent, chondrocytes in the growth plate (and, hence, progress toward closure and bone mass accretion). This phenomenon is an important pubertal process as 90% of skeletal mass is accrued by 18 years of age. Both estrogen receptors, ER-α and ER-β, are expressed in the growth plate in boys and girls throughout pubertal development. Estrogen has biphasic actions on longitudinal growth in both girls and boys: Very low levels of estrogen stimulate bone growth directly at the growth plate and indirectly through increased GH secretion and IGF-1 production and action. Conversely, higher levels of estrogen inhibit GH action at the level of receptor expression and signaling (specifically inhibiting Janus kinase–mediated transcription via induction of SOCS2 [suppressor of cytokine signaling-2]) and stimulate epiphyseal fusion. Androgens regulate both proliferation and differentiation of cultured epiphyseal chondrocytes and, thus, also have direct effects on growth plate cartilage and longitudinal bone growth. In addition, though androgens indirectly increase GH secretion and pulsatility due to aromatization to estrogen, a direct effect of androgens on epiphyseal growth and maturation is supported by the observed growth rate acceleration observed with oxandrolone, a nonaromatizable androgen that does not affect GH secretion.
Skeletal maturation is assessed by examination of a “bone age” (BA) film, which is a radiograph of the left hand and wrist. Because the ossification of trabecular bone occurs in a predictable pattern, the evaluator can quantitatively assess the bone maturation of multiple ossification centers and compare it to standard male or female radiographs of different ages. The BA can then be compared to the patient’s chronological age as an indicator of growth tempo, remaining growth potential, and a judgment of statistically abnormal delay or advancement (with use of normative ± SD reference data). Assessment of BA is particularly useful in children with the following conditions: short stature, tall stature, early or late puberty, and congenital adrenal hyperplasia. In children younger than 2 years, given the limited number and size of visible ossification centers in the hand, a hemiskeleton BA can be obtained by obtaining radiographs of the child’s entire left upper and lower extremities. The number of ossification centers is determined and again compared to age-appropriate standards to determine the bone age.
Although indispensable in the evaluation of growth, the use of a BA in practice also has its perils. The single film of the left hand is assumed to be representative of ossification centers in general and, thus, avoids radiation exposure required for radiographs of the entire skeleton. However, because the hand does not contribute to height, its accuracy in predicting growth potential can be limited. Most commonly, the radiograph is compared with the published standards of Greulich and Pyle (G-P),7 a set of normal age-related standards that were collected from a small cohort of American white children between 1931 and 1942. Consequently, use of these dated standards has dwindling accuracy not only for the assessment of (faster growing and maturing) children in the 21st century but also of children from other ethnicities or children with intrinsic disease processes such as skeletal dysplasias. Nonetheless, the G-P atlas is still the most widely used skeletal development standard. An alternative Tanner-Whitehouse method for assessing BA from radiographs of the left hand involves a scoring system for developmentally identified stages of each of 20 individual bones, a technique that has been adapted for computerized assessment.8 Further, assessment of BA can have substantial variability of intraobserver interpretation. It is, thus, optimal to have a consistent reviewer, especially in the context of serial BAs in the same patient.
Finally, radiographs of the hand can be helpful in detection of many skeletal disorders such as Madelung deformity characterized by arrest of epiphyseal growth of the medial and anterior portions of the distal radius leading to shortening of the radius and relative overgrowth of the ulna (Leri-Weill dyschondrosteosis and TS) and short fourth metacarpal (pseudohypoparathyroidism and TS).
The extent of skeletal maturation can be used to predict ultimate height potential. Several methods have been developed for the prediction of adult height (PAH) (Table 2-2). All are based on the premise that delay in BA relative to the chronological age is proportionate to growth potential remaining. For each method, as BA advances, the PAH becomes more accurate. The most commonly used one was developed by Bayley and Pinneau and is based on G-P Radiographic Atlas of Skeletal Development. This calculation takes into account the BA, chronological age, and current height, and a semiquantitative allowance for chronological age. Importantly, all methods of calculating PAH are based on data from normal children, and none has been documented to be accurate in children with growth abnormalities. There are several alternative methods for PAH such as those described by Tanner-Whitehouse (TW) and the Roche-Wainer-Thissen (RWT) (Table 2-3). These methods have a common shortcoming as they are based on manual BA determination. Automated methods for BA determination have been recently developed.9 In addition, several models have been developed for specific situations such as constitutional delay of growth and puberty (CDGP), short normal children, tall stature, and congenital adrenal hyperplasia.
| Method | Parameters of Assessment | Reference |
|---|---|---|
| TW2 | Height, bone age (BA), chronological age, pubertal height, pubertal BA increments during previous year | Tanner J, Whitehouse RH, Marshall WA, et al. Assessmentof Skeletal Maturity and Prediction of Adult Height (TW2 Method). New York, NY: Academic Press; 1983. |
| RWT | Height, BA, chronological age, mid-parental target height (MPH) | Roche A, Wainer H, Thissen D. The RWT method for theprediction of adult height. Pediatrics. 1975. |
| Khamis-Roche | Multiple regression analyses using height, weight, birth measurement, and MPH data | Khamis H, Roche A. Predicting adult stature without using skeletal age: the Khamis and Roche method. Pediatrics. 1994. |
| Bayley and Pinneau | Height, BA, semiquantitative chronologicalage | Bayley N, Pinneau S. Tables for predicting adult height from skeletal age: revised for use with the Greulich-Pyle hand standards. J Pediatr. 1952. |
| Girls | Boys | |||||
|---|---|---|---|---|---|---|
| Bone Age (y-mo) | Delayed | Averagea | Advanced | Delayed | Averagea | Advanced |
| 6-0 | 0.733 | 0.720 | 0.680 | |||
| 6-3 | 0.742 | 0.729 | 0.690 | |||
| 6-6 | 0.751 | 0.738 | 0.700 | |||
| 6-9 | 0.763 | 0.751 | 0.709 | |||
| 7-0 | 0.770 | 0.757 | 0.712 | 0.718 | 0.695 | 0.670 |
| 7-3 | 0.779 | 0.765 | 0.722 | 0.728 | 0.702 | 0.676 |
| 7-6 | 0.788 | 0.772 | 0.732 | 0.738 | 0.709 | 0.683 |
| 7-9 | 0.797 | 0.782 | 0.742 | 0.747 | 0.716 | 0.689 |
| 8-0 | 0.804 | 0.790 | 0.750 | 0.756 | 0.723 | 0.696 |
| 8-3 | 0.813 | 0.801 | 0.760 | 0.765 | 0.731 | 0.703 |
| 8-6 | 0.823 | 0.810 | 0.771 | 0.773 | 0.739 | 0.709 |
| 8-9 | 0.836 | 0.821 | 0.784 | 0.779 | 0.746 | 0.715 |
| 9-0 | 0.841 | 0.827 | 0.790 | 0.786 | 0.752 | 0.720 |
| 9-3 | 0.851 | 0.836 | 0.800 | 0.794 | 0.761 | 0.728 |
| 9-6 | 0.858 | 0.844 | 0.809 | 0.800 | 0.769 | 0.734 |
| 9-9 | 0.866 | 0.853 | 0.819 | 0.807 | 0.777 | 0.741 |
| 10-0 | 0.874 | 0.862 | 0.828 | 0.812 | 0.784 | 0.747 |
| 10-3 | 0.884 | 0.874 | 0.841 | 0.816 | 0.791 | 0.753 |
| 10-6 | 0.896 | 0.884 | 0.856 | 0.819 | 0.795 | 0.758 |
| 10-9 | 0.907 | 0.896 | 0.870 | 0.821 | 0.800 | 0.763 |
| 11-0 | 0.918 | 0.906 | 0.883 | 0.823 | 0.804 | 0.767 |
| 11-3 | 0.922 | 0.910 | 0.887 | 0.827 | 0.812 | 0.776 |
| 11-6 | 0.926 | 0.914 | 0.891 | 0.832 | 0.818 | 0.786 |
| 11-9 | 0.929 | 0.918 | 0.897 | 0.839 | 0.827 | 0.800 |
| 12-0 | 0.932 | 0.922 | 0.901 | 0.845 | 0.834 | 0.809 |
| 12-3 | 0.942 | 0.932 | 0.913 | 0.852 | 0.843 | 0.818 |
| 12-6 | 0.949 | 0.941 | 0.924 | 0.860 | 0.853 | 0.828 |
| 12-9 | 0.957 | 0.950 | 0.935 | 0.869 | 0.863 | 0.839 |
| 13-0 | 0.964 | 0.958 | 0.945 | 0.880 | 0.876 | 0.850 |
| 13-3 | 0.971 | 0.967 | 0.955 | 0.890 | 0.863 | |
| 13-6 | 0.977 | 0.974 | 0.963 | 0.902 | 0.875 | |
| 13-9 | 0.981 | 0.978 | 0.968 | 0.914 | 0.890 | |
| 14-0 | 0.983 | 0.980 | 0.972 | 0.927 | 0.905 | |
| 14-3 | 0.986 | 0.983 | 0.977 | 0.938 | 0.918 | |
| 14-6 | 0.989 | 0.986 | 0.980 | 0.948 | 0.930 | |
| 14-9 | 0.992 | 0.988 | 0.983 | 0.958 | 0.943 | |
| 15-0 | 0.994 | 0.990 | 0.986 | 0.968 | 0.958 | |
| 15-3 | 0.995 | 0.991 | 0.988 | 0.973 | 0.967 | |
| 15-6 | 0.996 | 0.993 | 0.990 | 0.976 | 0.971 | |
| 15-9 | 0.997 | 0.994 | 0.992 | 0.980 | 0.976 | |
| 16-0 | 0.998 | 0.996 | 0.993 | 0.982 | 0.980 | |
| 16-3 | 0.999 | 0.996 | 0.994 | 0.985 | 0.983 | |
| 16-6 | 0.999 | 0.997 | 0.995 | 0.987 | 0.985 | |
| 16-9 | 0.9995 | 0.998 | 0.997 | 0.989 | 0.988 | |
| 17-0 | 1.00 | 0.999 | 0.998 | 0.991 | 0.990 | |
| 17-3 | 0.993 | |||||
| 17-6 | 0.9995 | 0.9995 | 0.994 | |||
| 17-9 | 0.995 | |||||
| 18-0 | 1.00 | 0.996 | ||||
| 18-3 | 0.998 | |||||
| 18-6 | 1.00 | |||||
Assessment of the PAH is frequently used in conjunction with the mid-parental target height (MPH), which takes into account familial genetic factors in growth and height potential. The MPH calculation is the average of the mother’s and father’s height adjusted by the average height difference of 13 cm between the sexes. Thus, if the MPH of a female patient is calculated, 13 cm is subtracted from the father’s height before it is averaged with the mother’s. For the evaluation of a male patient, 13 cm is added to the mother’s height before averaging the parents’ heights. In parts of the world where average heights continue to increase, a generation “correction factor” is also included. Like the PAH, this is a broad estimation (ie, 2 SD range for this calculation is ±10 cm), but it can be useful in comparing a child’s growth to that of his/her parents and siblings. The MPH is also useful for identifying whether a child’s current and predicted growth trajectory differs from that expected; that is, a significant disparity in the child’s growth percentile (ie, ±10 cm) from the MPH percentile should prompt further investigation (most often revealing constitutional early or delayed growth and development) even if the child plots within the normal percentile range. Additionally, when there is a relatively large disparity between the parents’ heights, the calculated MPH becomes less informative. While a child’s growth can be disproportionately influenced by the pattern of one parent, statistical reassessment of population averages shows that the final height of offspring tends to regress toward the mean. If this is not taken into account, the shorter calculated MPH may be used to inappropriately explain the short stature of a child.
Regulation of growth is provided by a complex interplay of stimulatory and inhibitory hormones influenced by afferent messages from the central nervous system (CNS) and periphery. The function of these systems reflects genetic programming, the nutritional and developmental state of the body, and the presence of interfering processes. Thus, evaluation for “endocrine” causes of abnormal growth includes, in addition to assessment of the GH/IGF-1, thyroid, and, as appropriate, gonadotropin/sex steroid axes, an exploration for nutrition deficiencies, psychosocial stress, growth-interfering medications, and occult organ dysfunction (eg, renal or gastrointestinal disease). Regulation of somatic growth by the endocrine system varies significantly during a child’s growing lifetime.
Fetal growth regulation involves complex interactions between the mother, placenta, and fetus. The placenta is the site of bidirectional exchanges receiving nutrients and oxygen from the mother and transferring fetal waste from the fetus to the mother. Therefore, adequate placental growth and function are essential for normal fetal growth. However, the placenta is also a complex endocrine organ sending signals to the mother that influence maternal metabolism and, therefore, fetal growth. The placenta signals also to the fetus by secreting steroid hormones and human placental lactogen (hPL). While estrogen and progesterone seem to have no role in fetal growth, hPL may promote fetal growth by stimulating other fetal hormones such as insulin or IGF-1. The placenta is also a barrier, protecting the fetus from negative influences coming from the maternal compartment. The maternal cortisol level is 5 to 10 times higher than the fetal cortisol concentration, a difference made possible by a placental enzyme, 11β-hydroxysteroid dehydrogenase-2 (11βHSD-2) that converts cortisol into its inactive 11-keto-metabolite, cortisone. By doing so, this enzyme protects the fetus from deleterious effects of high cortisol concentrations. Several studies have shown that a reduced 11βHSD enzyme activity is associated with reduced fetal growth.
In the fetal compartment, the key regulators of fetal growth—insulin, IGF-1, and IGF-2—are produced and secreted by the fetus early during fetal development. Maternal insulin does not cross the placental barrier and, thus, the fetus depends on its own production for the control of glucose metabolism. Insulin, produced by β-cells in the fetal pancreas beginning at the end of the first trimester, is an important regulator of fetal growth and development. The β-cell is responsive to glucose stimulation during the second half of gestation and the amplitude of insulin response increases during gestation. There is a correlation between increase in insulin production and increased fetal growth, and thus any variation in glucose availability to the fetus will influence fetal insulin secretion and fetal growth. Deficiency in insulin production (eg, severe neonatal diabetes mellitus [DM] and pancreatic agenesis) or action (eg, leprechaunism) results in reduced fetal growth. In fetuses and neonates born small for gestational age (SGA), cord blood insulin concentrations are significantly lower than appropriate for gestational age infants. Conversely, in response to maternal hyperglycemia, fetal insulin production increases, leading to increased birth weight and macrosomia observed in infants of poorly controlled diabetic mothers. This increased birth weight is largely due to increased body fat acquisition and the effect on birth length is modest.
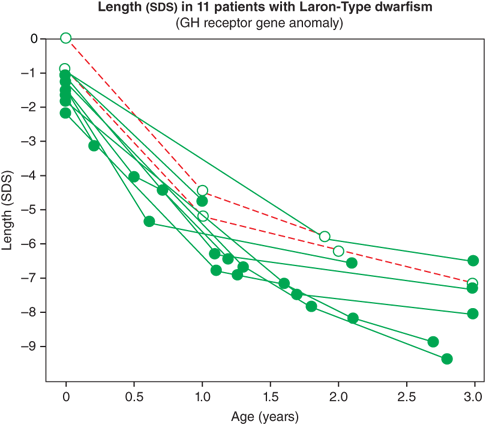
The IGF system also plays a central role in the regulation of fetal growth and normal local production, and action of IGFs appears to be indispensable for normal growth in utero. IGF-1 and IGF-2 are expressed in fetal tissue from zygote formation and implantation until just before birth. During fetal life, the IGF-1 concentration correlates positively with gestational age. Normal fetal production of IGF-1 is regulated primarily by nutrition and, importantly, is largely independent of GH secretion. As a result, neonates with GH deficiency (GHD) or insensitivity, as noted previously, have normal to low-normal length at birth, followed by marked postnatal growth failure (Figure 2-8).10
Figure 2-8
Birth size and postnatal growth of infants with growth hormone resistance. (Reproduced with permission from Rosenbloom AL, Guevara-Aguirre J, Rosenfeld RG, Pollock BH: Growth in growth hormone insensitivity, Trends Endocrinol Metab. 1994 Sep;5(7):296-303.10)
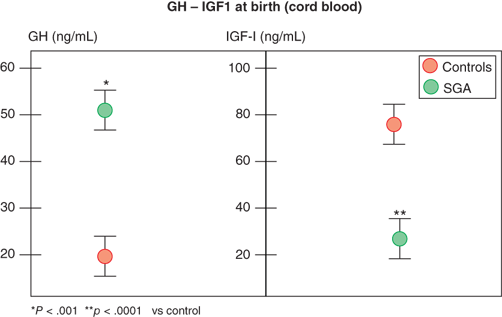
In contrast, infants with primary over- or underproduction of IGF-1 demonstrate marked effects on in utero growth, exemplified by disruption of normal growth of patients displaying IGF-1 resistance owing to mutations within the IGF-1 gene or its receptor (IGF1R). These patients show marked intrauterine growth restriction (IUGR), are born SGA, and fail to catch up in length as infants.11 Further, IGF-1 levels in fetal and cord blood correlate with fetal size, and, in spite of higher GH levels, they are reduced in SGA infants (Figure 2-9).12 IGF-1 continues to be critical for normal linear growth in postnatal life. While IGF-1–binding proteins (IGFBPs) are identifiable in the fetus and newborn, levels of IGFBP-3 and acid-labile subunit (ALS,) the primary carriers of IGF-1 in the circulation after infancy, are low.
Figure 2-9
Growth hormone and IGF-1 levels in small-for-gestational-age and appropriate-for-gestational-age infants. (Data from Leger et al.)12
IGF-2 expression is more extensive in fetal tissues than is IGF-1 from mid-to-late gestation in rodents and humans. An important role of IGF-2 in fetal growth is illustrated by the growth anomalies observed in Russell-Silver syndrome (RSS) and Beckwith-Wiedemann syndrome (BWS). Phenotypically, RSS is characterized by severe intrauterine and postnatal growth retardation, whereas BWS is characterized by fetal overgrowth in late pregnancy and later during early childhood. The molecular basis is complex and involves abnormalities in the IGF-2 region on chromosome 11p15. It is believed that the excessive growth observed in BWS is due to overexpression of IGF-2 and excessive production during fetal life, and the reverse appears to be true in 30% to 65% of cases of RSS. Unlike IGF-1, in normal conditions, IGF-2 does not appear to play a critical role in postnatal somatic growth.
In contrast, GH seems to be unimportant for fetal growth. GH is secreted during fetal life beginning at mid-gestation and its concentration at birth is high compared to what is observed later in infancy. However, infants with severe neonatal hypopituitarism, despite profound GHD, have a normal or low-normal length at birth but have a decline in their growth velocity during the early months of life. Similarly, neonates with the GH insensitivity (GHI) syndrome (Laron dwarfism) have only a slightly reduced birth length but show a rapid decline in their growth velocity during the early months of postnatal life. These examples illustrate that GH has a limited role in fetal growth (and IGF-1 production) but begins to influence linear growth during early infancy. Thyroid hormone, another hormone critical for normal postnatal growth, influences bone mineralization and maturation in utero but does not substantially influence fetal growth. Thus, infants born with severe congenital hypothyroidism demonstrate normal length but have delayed bone maturation.
During the first few months of infancy, nutritional adequacy (and its effects on insulin and IGF-1 production) continues to exert strong influence on linear growth, so that infantile GHD may not always be manifest by growth failure at this time. Thyroid hormone deficiency, while of relatively little importance to growth of the fetus, can cause profound postnatal growth failure and virtual arrest of skeletal maturation. In addition to having direct effects on epiphyseal cartilage, thyroid hormones appear necessary for normal GH secretion. Patients with hypothyroidism have decreased spontaneous GH secretion and blunted responses to GH stimulation tests which normalize with restoration of euthyroidism.
Childhood growth is primarily regulated by GH, normal secretion and action of which is dependent on normal thyroid hormone function and adequate nutrition. Gradually declining growth rates during childhood may be matched by declining laboratory evidence of GH secretion, particularly when pubertal onset is delayed. This phenomenon can create difficulty in distinguishing physiologic growth deceleration from true GHD during the immediate prepubertal years. Normal growth acceleration and completion during adolescence is dependent on actions of estrogen and androgen, their effects on GH secretion, and normal thyroid hormone and nutritional status. Gonadal steroids produce a growth spurt partially by enhancing GH secretion (via aromatization of testosterone to estrogen in the CNS), and also by stimulating IGF-1 production and chondrocyte proliferation in the growth plate directly. Nevertheless, without GH, an adolescent will not have a normal pubertal growth spurt.
In addition to regulating growth, GH has important metabolic effects. These include (1) stimulation of bone remodeling (by stimulating both osteoclast and osteoblast activity) with ultimate net increase in bone mass;(2) stimulation of lipolysis and fat utilization for energy expenditure; (3) growth and preservation of lean tissue mass and muscle function; and (4) facilitation of normal lipid metabolism (see Figure 2-23). Sex-specific dimorphism in these metabolic effects, reflecting underlying sex steroid–mediated differences in GH sensitivity and secretion, becomes apparent during adolescence leading to females having higher GH levels than do males. In animal models, sexually dimorphic GH release from the pituitary is characterized by larger and more regular pulses in males and smaller, more frequent, and more irregular pulses in females. There are also sex differences in downstream signaling pathways in target tissues, such as sex-specific gene expression in the liver.13 Beyond linear growth, normal production of GH is needed for the adolescent to accomplish normal body composition maturation. Adults continue to secrete GH pulses, but the amplitude decreases with age, returning to a pattern more characteristic of the prepubertal child in early adulthood followed by a gradual, but steady, decline with aging.
While optimal growth and development occur only with the normal production and modulation of multiple hormones, the predominant common pathway for the endocrine regulation of childhood somatic growth is the GH/IGF-1 axis. GH synthesis and secretion occurs in/from the anterior pituitary (adenohypophysis), which originates from the floor of the primitive pharyngeal epithelium known as Rathke pouch. Infolding of this tissue occurs around days 15 to 20 of gestation and subsequently migrates caudally to meet a neural ectodermal extension from the floor of the midbrain that will develop into the posterior pituitary. These two distinct embryologic tissues combine to form the pituitary gland, although the functions of the anterior and posterior portions remain largely distinct.
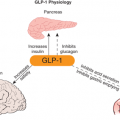
GH is produced in the somatotrophs of the anterior pituitary as a single-chain 191-amino acid, 22-kDa protein. GH release and synthesis reflect a balance between the effects of three hypothalamic releasing hormones: GH-releasing hormone (GHRH; stimulatory), ghrelin (stimulatory), and somatostatin (also known as somatotropin release inhibitory factor [SRIF]; inhibitory). GHRH is produced in neurons that have their bodies in the ventral arcuate nucleus of the hypothalamus and axons projecting into the median eminence, allowing the GHRH to be secreted into the portal system of the pituitary stalk. GHRH, through interaction with a G-protein receptor, stimulates a cyclic adenosine monophosphate (cAMP)–protein kinase A activation pathway causing an influx of calcium ions into the somatotrophs and subsequent synthesis and release of GH. Counter-regulation of GH release is directed by somatostatin, produced in the periventricular nucleus of the hypothalamus and also released into the same portal system as GHRH. SRIF binds to a G-protein receptor that (1) acts on somatotroph K channels, preventing outflow of K ions needed to accommodate the influx of positively charged calcium ions, and (2) inhibits cAMP production. Through these actions, SRIF inhibits the release, but not synthesis, of GH from somatotrophs. Ghrelin is a synthetic hexapeptide secretagogue capable of binding to a unique receptor and stimulating GH secretion through effects on both the hypothalamus and pituitary. Ghrelin is secreted primarily from the stomach (and to lesser extent from small intestine and CNS) during fasting, implicating a role of GH release in the coordination of caloric expenditure and partitioning. Though ghrelin is capable of stimulating GH release, it does not appear to be involved physiologically in the immediate control of GH release at the level of the somatotroph. Centrally, ghrelin evokes a GH secretory pulse by increasing release of GHRH while also suppressing the inhibitory effect of SRIF at the level of the pituitary.14 The shifting balance between GHRH and SRIH determines the pulsatile release of GH, with SRIFinfluencing the timing and amplitude of GH pulses. GHRH release during SRIF secretion allows for GH synthesis, but not release from the somatotrophs. During times of decreased SRIF tone, stored GH is released in a pulse. Both GHRH and GH work in a negative feedback loop to stimulate SRIF release, and GH itself, in a short feedback loop, also inhibits GHRH.
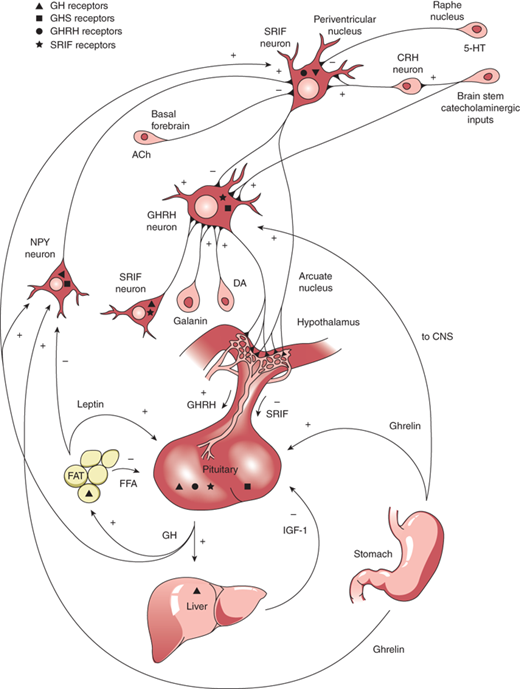
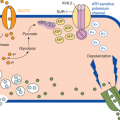
Production and release of GH is influenced by multiple factors including neuropeptides, neurotransmitters, and hormones that can either increase or decrease GH release. GnRH, pituitary adenylyl cyclase activating polypeptide (PACAP), and thyrotropin-releasing hormone (TRH), together with peripheral peptide hormones such as leptin and adiponectin, stimulate GH release. Physical activity, sleep, fasting, and dopamine agonists also stimulate GH release. During stage IV sleep, SRIF activity is low while GHRH activity persists, resulting in nocturnal pulses of GH, the main contribution to daily GH secretion. These pulses increase in both amplitude and frequency during puberty when the effect of estrogen in both males and females augments the release of GH. IGF-1 inhibits GH release, and one growth-suppressing effect of persistent glucocorticoid excess is through inhibition of GHRH and augmentation of SRIF. This complex system of stimulatory and inhibitory feedback loops, which modulate GH production and secretion, is depicted in Figure 2-10.
Figure 2-10
Stimulatory and inhibitory feedback loops that modulate growth hormone (GH) secretion. ACh, acetylcholine; CNS, central nervous system; CRH, corticotropin-releasing hormone; DA, dopamine; FFA, free fatty acid; GHRH; growth hormone–releasing hormone; GABA, galanin α-aminobutyric acid; 5-HT, 5-hydroxytryptophan; NPY, neuropeptide Y; SRIF, somatotropin release inhibitory factor. (Reproduced with permission from Law MJ: Neuroendocrinology. In Larsen PR et al (eds). Williams Textbook of Endocrinology, 11th ed, St. Louis, W.B. Saunders, 2008.)
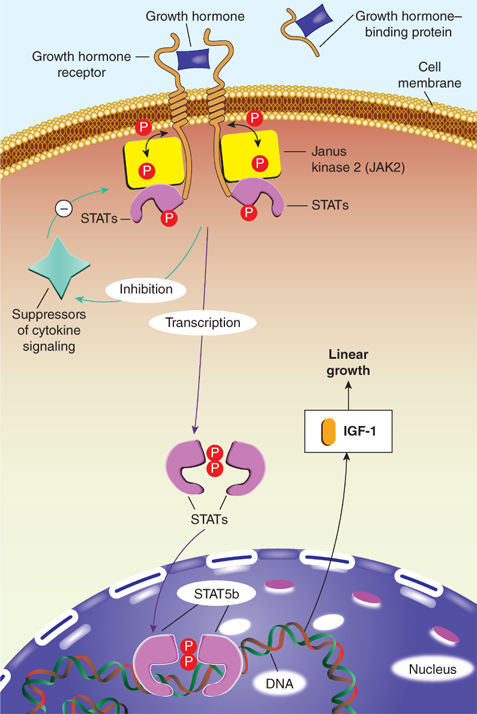
In serum, GH is either free or bound to the GH-binding protein (GHBP), which is derived from cleavage of the extracellular portion of the GH receptor (GHR). GHBP in human plasma binds GH with high specificity and affinity, but with relatively low capacity, as about 45% of circulating GH is bound. GHBP prolongs the half-life of GH, presumably by reducing its glomerular filtration, and modulates its binding to the GHR. Like GH, GHBP concentrations vary with age, estrogen levels, body mass index (BMI), and feeding states. At the target tissue cell membranes, steps in free GH action include (1) binding of GH to the membrane-associated class-1 cytokine tyrosine kinase GHR; (2) sequential dimerization of the GHR through binding to each of two specific sites on GH; (3) interaction of the GHR with Janus kinase 2 (JAK2); (4) tyrosine phosphorylation of both JAK2 and the GHR; (5) changes in cytoplasmic and nuclear protein phosphorylation and dephosphorylation; and (6) stimulation of target gene transcription. JAK2-dependent phosphorylation and activation have been demonstrated for many cytoplasmic signaling molecules that, after forming homodimers or heterodimers, translocate to the nucleus, bind DNA, and activate transcription of growth-promoting products, including IGF-1 (Figure 2-11).15 Particularly in the liver, activation of GHRs also initiates the signaling pathway for the production of IGFBP-3 and ALS. These components combine to form a 150-kDa complex that transports IGF-1 in the blood and prolongs its half-life. Precisely how these pathways mediate the various anabolic and metabolic actions of GH remains to be elucidated. Although most measurable IGF-1 comes from the liver, GHRs are expressed in multiple tissues (including growth plates) providing a pathway for GH to have effects on growth independent of the hepatic production of IGF-1. GHRs are found in epiphyses, prechondrocytes of the cartilage precursor cells, and in bone marrow. At these locations, autocrine and paracrine action of locally produced IGF-1 appears to be the prime stimulator of somatic growth and elongation of bone (based on genetic studies in mice). In other tissues, GH also has important body composition effects, resulting in the promotion of lean mass accretion. GH provides counter-regulation to insulin, leading to an increase in lipolysis and inhibition of lipogenesis in adipose tissue, as well as to an increase in amino acid transport and nitrogen retention in muscle.
The connection between the hypothalamus and the pituitary portal system is developing by 9 weeks of fetal life at which time somatotrophs can be identified in the anterior pituitary. By 12 weeks of life, the regulatory effects of GHRH and somatotropin release inhibitory factor (SRIF) are in place. GH is secreted readily from this point in gestation on but, as mentioned earlier, plays only a small role in fetal linear and weight growth. A number of recently identified genetic mutations can result in GHD, including HESX1 (thought to be linked with septo-optic dysplasia), SOX2, SOX3, GLI2, LHX-3 and LHX4 (pituitary hypoplasia), PROP1 or POU1F1 (combined pituitary hormone deficiency), OTX2, (critical role in retinal photoreceptor development), and GH1 (isolated GHD [IGHD]). (Table 2-4).16
| Gene | Protein Function | Human Phenotype | Inheritance |
|---|---|---|---|
| HESX1 | Early developmentaltranscriptionfactor (repressor) | Variable septo-optic dysplasia (SOD), combinedpituitary hormone deficiency, isolated growthhormone deficiency (IGHD), ectopic posterior pituitary (EPP) | Dominant or recessive |
| SOX2 | Early developmentaltranscription factor | Hypogonadotropic hypogonadism, anterior pituitaryhypoplasia (APH), bilateral, abnormal corpuscallosum, anophthalmia/microphthalmia, esophageal atresia, sensorineural hearing loss, learning difficulties | De novo |
| SOX3 | Early developmentaltranscription factor | IGHD, mental retardation, APH, infundibular hypoplasia, EPP, midline abnormalities | X-linked recessive |
| GLI2 | Early developmentaltranscription factor | Holoprosencephaly, hypopituitarism, craniofacialabnormalities, polydactyly, single nares, single central incisor, partial agenesis of the corpus callosum | Dominant |
| LHX3 | Early developmentaltranscription factor | GH, thyroid-stimulating hormone (TSH), gonadotropin deficiency, with pituitary hypoplasia, short, rigidcervical spine | Recessive |
| LHX4 | Early developmentaltranscription factor | GH, TSH, cortisol deficiency, persistent craniopharyngeal canal and abnormal cerebellar tonsils | Dominant |
| OTX2 | Transcription factorinvolved in fore- andmidbrain patterning | Seizures, developmental delay, short stature, structural abnormalities of the pituitary gland, early-onset retinal degeneration | Dominant, variable |
| PROP1 | Terminal cell differentiation transcription factor | GH, TSH, prolactin, and gonadotropin deficiency, evolving adrenocorticotropic hormone (ACTH)deficiency, enlarged pituitary with later involution | Recessive |
| POU1F1 | Terminal cell differentiation transcription factor | Variable APH with GH, TSH, and prolactin deficiencies | Recessive |
Immediately after birth, GH levels are normally high through the first few days of life, with random values greater than 20 ng/mL being common. Because GH provides insulin counter-regulation (in conjunction with cortisol) during infancy and its release is normally stimulated by hypoglycemia, a GH level less than 20 ng/mL concurrent with hypoglycemia strongly suggests GHD. Because, as stated previously, GH is not the key regulator of linear growth velocity during the primarily nutrition-dependent phase of very early infancy, neonates with GHD may not show slowed linear growth until as late as 18 to 24 months of age.
During childhood, most GH secretion occurs in two to five discrete pulses during sleep. Because of this secretion pattern, GH levels usually range from low to undetectable on random blood samples. A wide range of spontaneous GH secretion has been observed in both normally growing and short children, so that testing this with frequent blood sampling has not proven diagnostically useful. Because the diagnosis of GHD usually does not connote a complete deficiency, affected children will often continue to grow, but at a subnormal rate that results in a gradual downward crossing of percentile lines and slow decline in height SD score.
During adolescence, a rise in estrogen leads to an increase in GH secretion and IGF-1 production (directly and indirectly). While this occurs in both sexes, higher levels of GH are typically observed in pubertal females, reflecting not only higher estrogen levels but also the appearance of sex-specific differences in GH-induced hepatic IGF-1 production and feedback. GH pulses during the adolescent phase increase in frequency to occur both during the day and night and have higher amplitudes. GH bioavailability is also increased because production of its binding protein, GHBP, remains stable.
Two IGFs have been identified: IGF-1 and IGF-2. IGF-1 is a 70-amino acid peptide that is slightly alkaline and its sequence is encoded on the long arm of chromosome 12. IGF-2 has 67 amino acids, is slightly acidic, and encoded on the short arm of chromosome 11. Both peptides are composed of two amino chains connected by disulfide bonds. They share 45 amino acid positions and have approximately 50% homology to insulin. Depending on the tissue, there are multiple different messenger ribonucleic acid (mRNA) sequences as a result of variable splicing and regulation of transcription of the IGF-1 and -2 genes, adding another layer of sophistication to the effects of IGF expression and, thus, its growth effects.
The IGF1R (officially known as the type 1 IGF receptor) binds both IGF proteins with high affinity, and both IGF-1 and -2 activate the tyrosine kinase stimulatory intracellular cascade through the IGF1R. It is through this receptor that mitogenic and metabolic actions of IGF proteins are mediated. Like the GHR, the IGF1R is expressed in a multitude of tissues. The IGF1R is made up of two transmembrane α-subunits forming the IGF-binding sites and two intracellular β-subunits that make up the signal transduction component of the receptor. The IGF-2 receptor (IGF2R and officially known as the type 2 IGF receptor) only binds IGF-2 with high affinity and does not exert effects through the same tyrosine kinase activation pathway. The downstream effects of activating the IGF2R are predominantly antimitogenic rather than growth stimulating. This receptor pathway may be involved in regulating the inhibitory effects of retinoids and modulation of growth inhibition of the IGF system.
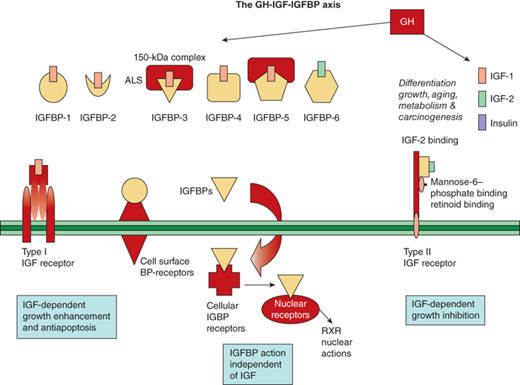
In addition to the IGF receptors, the IGFBPs also modulate IGF action. Six IGFBPs are produced and bind 70% to 80% of IGF-1 and -2. Their regulation by GH varies, with IGFBP-3 being closely stimulated by, and IGFBP-1 being essentially independent of, GH. The IGFBPs serve as carrier proteins for the IGF peptides, transport the IGFs to target cells, and modulate the interaction of the IGFs with their cell surface receptors. Highly conserved cysteine-rich regions of these carrier proteins are the sites of the disulfide bridges that play a key role in the structure and formation of the IGF binding site. When compared to IGF receptors, IGFBPs have a higher affinity for the IGF peptides. The bioavailability of free IGFs appears dependent on (and is further regulated by) the action of IGFBP proteases (Figure 2-12).17
Figure 2-12
The GH-IGF-1GFBP axis is shown with its ligands, binding proteins, receptors, and signaling pathways. (Adapted, with permission, from Cohen, P.17)
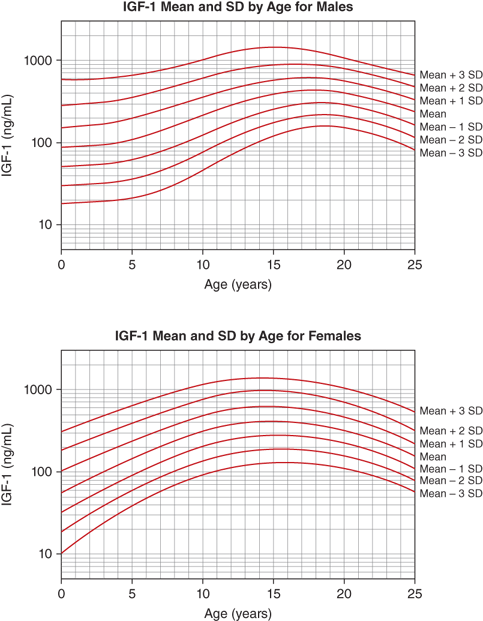
The IGF-1 levels vary substantially throughout life. At birth, levels are relatively low (∼30%-50% of adult levels) and are influenced by gestational age and weight (see Figure 2-9). The IGF system plays a central role in the regulation of fetal growth (see the previous discussion). While IGFBPs are identifiable in the fetus and newborn, levels of IGFBP-3 and ALS, the primary carriers of IGF-1 after infancy, are low. Thus, it appears that fetal IGF-1 production is linked more tightly to nutrient supply and to insulin secretion than to GH regulation. Levels subsequently rise during childhood, reaching peak levels right after the pubertal growth spurt (13-14 years in girls and 15-16 years in boys). Under the influence of gonadal steroids, both directly and indirectly via the increase in GH pulsations, IGF-1 levels will increase to two to three times the adult range (Figure 2-13). During the pubertal phase of growth, the levels of IGF-1 more closely correlate with Tanner stage and BA rather than with chronological age. IGF-2 levels show less age variation and, by 1 year of age, achieve adult levels with little subsequent change.
A normal growth rate is an important indicator of childhood health. Therefore, proper growth assessment is a key component of pediatric care, requiring both careful measurement of length or height at discrete points and tracking of growth velocity over time. Though accurate plotting of isolated linear growth measurements on growth charts will easily identify children who are abnormally short or tall in stature (ie, whose height falls outside ± ∼2 SD, < 3rd or > 97th percentile), early detection of a growth disorder frequently requires appreciation of both subtle changes in growth velocity or recognition that a growth pattern, while within the statistically normal range, is divergent from that expected for a particular child.
Evaluation of the child with worrisome growth begins by systematically asking and answering the following questions: (1) Is the growth rate normal or abnormally slow or fast? (2) What is the relationship between the linear growth rate and poor, normal, or excess weight gain? (3) What intrinsic, familial, or other genetic factors may be influencing this child’s growth? (4) What is the family history for pubertal onset and age of adult height attainment, and is there BA evidence for delayed or accelerated growth? Because the normal range within the population is fairly wide, skillful and sensitive analysis that uses the answers to these questions can help in determining a more narrowly defined “expected” normal range for a specific child. Appreciation of the influences of superimposed factors in a single child usually provides either rationale for reassurance and observation or reason to pursue a diagnostic workup and possible treatment.
Is the growth rate normal or abnormally slow or fast? Growth rate is the change in length or height measured on separate occasions relative to the time elapsed. The normal range of growth velocities varies markedly with age, skeletal age, and pubertal stage. Growth rates estimated from measurements separated by months can be annualized to centimeters/year to allow comparison with normal growth rate charts for age (see Figure 2-2). To more precisely evaluate whether a growth rate is normal in children with delayed or accelerated growth patterns, determination of skeletal age and of “growth rate for BA” can also be helpful. Consistently diminished growth velocity becomes manifest as downward crossing of percentiles on the length- or height-for-age growth chart, a situation that demands evaluation even when length or height remains within the normal range. Thus, careful attention to growth rate, and not only length or height, facilitates early detection of a growth-slowing disorder in taller and shorter children alike.
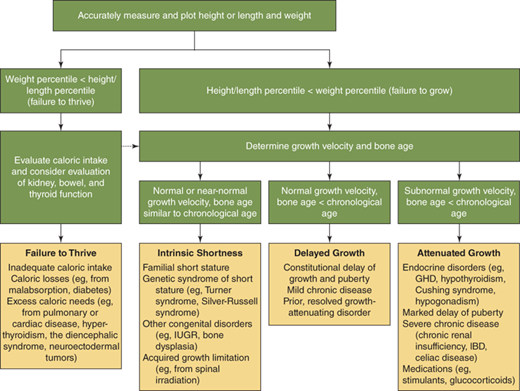
What is the relationship between the linear growth rate and poor, normal, or excess weight gain? Both poor nutrition and excess caloric intake can influence linear growth. Particularly, early in life it is diagnostically helpful to distinguish between “failure to thrive” (ie, weight deficit > length deficit) (Figure 2-14) and “failure to grow” (length deficit > weight deficit), as the former should prompt initial evaluation for nutritional problems or undiagnosed systemic illness (Figure 2-15), while the latter is more typical of growth-retarding endocrine disorders.3 On the other hand, overnutrition is a common cause of linear growth acceleration, with weight gain that precedes and exceeds in magnitude the increase in linear growth percentiles, usually accompanied by commensurate advancement in skeletal maturation and onset of puberty particularly in females (Figure 2-16). Endocrine causes of obesity such as hypothyroidism and cortisol excess need not be considered when a normal or accelerated growth rate accompanies weight gain.
What intrinsic, familial, or other genetic factors may be influencing this child’s growth? Intrinsic and genetic influences on the childhood growth rate and height attainment encompass a wide array of factors whose distinctive underlying physiologies are slowly yet steadily being unraveled. The parental contribution to a child’s expected height percentile range is estimated using the MPH calculation described earlier. Important caveats include (1) diminishing accuracy of this calculation as parental height percentiles become more disparate and (2) the assumption that a parent’s height represents his/her own genetic “potential” (ie, was not affected by an early life growth-restricting influence). An extended family history is helpful in revealing sporadic growth disorders (eg, short-limb tendencies) that may not manifest in every generation. Determination of body proportions, in particular the upper-to-lower body segment ratio (corrected for age and BA, as this measurement normally varies throughout growth and development), may aid in the identification of some causes of short (eg, hypochondroplasia and TS) or tall (eg, Klinefelter and Marfan syndromes) stature. Awareness of birth length and weight to determine whether the child was born SGA is critical to assess whether restriction of intrauterine growth may be persisting into childhood. Careful physical examination may detect stigmata of known chromosomal disorders associated with short (eg, Turner, Noonan, Down, and Russell-Silver syndromes) or tall (eg, Marfan, Klinefelter, and Soto [early in childhood] syndromes) stature.
What is the family history for pubertal onset and age of adult height attainment, and is there BA evidence for delayed or accelerated growth? The range of normal variations in “tempo” of childhood growth is not captured on most standard height-versus-age growth curves, but determination of this dimension is indispensable to evaluation of worrisome growth (variations in which determine the time required for an individual child to complete his/her growth) (see Figures 2-6 and 2-7). Differences in the time required to progress toward pubertal maturation and ultimate growth potential are influenced by biological variations in GH secretion and action, variations in suppression of the hypothalamic-pituitary-gonadal axis during infancy and its subsequent reawakening at pubertal onset, and other factors. A family history of early or late puberty or attainment of adult height is helpful in assessing the likelihood that a similar growth pattern in the child represents a normal variation. Helpful questions to elicit this history from parents include height at the beginning of high school, the age of maternal menarche, and continued paternal growth after high school. Objectively, the degree to which delay or acceleration in the growth process is contributing to a child’s position on the growth curve is estimated by examination of BA.
Figure 2-14
Conceptual approach to the evaluation and differential diagnosis of worrisome growth during childhood—defined as height below the 3rd percentile for age, or growth rate less than the 10th percentile for bone age, or predicted adult height that differs significantly from the mid-parental height, or abnormal body proportions. Percentiles are based on growth-curve percentiles. If the evaluation for failure to thrive is negative, the potential differential diagnosis for failure to grow should be reconsidered (dashed arrow). GHD, growth hormone deficiency; IBD, inflammatory bowel disease; IUGR, intrauterine growth restriction. (Adapted, with permission, from Allen and Cuttler3)
The astute clinician assembles this information and then asks: “to what extent do the historical and physical examination findings explain the child’s growth pattern and position on the growth curve?” Commonly, the process outlined previously reveals historical and familial short or tall stature traits that, when combined with tendencies toward delayed or accelerated tempo of growth and pubertal development, provide a reasonable explanation. Further evaluation of the differential diagnosis outlined as follows, however, should be prompted by (1) documented growth velocity less than 10th percentile or greater than 95th percentile for age (ie, any abnormally slow- or fast-growing child); (2) height-for-age less than 1st percentile (ie, any markedly short child); (3) height projection (current height percentile with correction for BA delay or advancement) that differs significantly from MPH; and (4) detection of abnormal body proportion.
Growth disorders in childhood generally display one or more of the following characteristics: (1) short stature with normal tempo of growth (ie, growth rate and skeletal maturation within the normal range, familial/genetic short stature); (2) short stature with normal growth rate, but evidence for prior slowed tempo of growth (ie, “constitutional growth delay” with delayed skeletal maturation); (3) abnormal growth rate with or without short stature (attenuated growth caused by systemic disease or hormonal deficiency); or (4) growth acceleration. Proper interpretation and diagnosis of growth disorders frequently require appreciation of overlapping growth patterns in the same child. This is commonly observed in children with extreme “idiopathic (ie, nonpathologic) short stature” resulting from combined influences of familial short stature and constitutional growth delay. Sound therapeutic decisions regarding growth problems must incorporate a clear understanding of both the complexity of multiple factors simultaneously influencing growth in a child and the natural history of these growth patterns. In many situations, careful watchful waiting is a critical first “intervention” that allows distinction of normal variations in growth from disorders for which treatment is needed. A conceptual approach to the differential diagnosis of a child with worrisome growth is depicted in Figure 2-14. Box 2-1 lists the circumstances in which a patient with growth disorders should be referred to a pediatric endocrinologist.
Box 2-1. When to Refer
When to consult or refer to a pediatric endocrinologist:
Unexplained neonatal hypoglycemia, jaundice, microphallus
Early signs of possible hypopituitarism, including GHD
Unexplained abnormally slow or fast growth
Growth velocity < 10th percentile or > 95th percentilefor age
Extreme short stature
Height-for-age < 1st percentile (< −2.25 SD)
Growth pattern and prognosis at variance with family
Height projection (current Ht-percentile corrected for BA) that differs significantly from MPH
Detection of abnormal body proportion
For many years, treatment of growth-retarding disorders was confined to correction of underlying disease or hormonal disturbance. During the past 30 years, however, treatment of growth disorders has expanded beyond hormone-replacement therapy to include enhancement therapy to improve stature, body composition, and perhaps quality of life. One consequence of this expansion has been the evolution of complex ethical dilemmas in recombinant DNA-derived human GH (hGH) therapy regarding appropriate criteria for the initiation and discontinuation of therapy, responsible allocation of health care resources, and the growth of “cosmetic endocrinology.”3 Though hGH therapy has dominated as the growth-promoting therapy of choice, advances in the understanding of growth regulation and skeletal maturation by other factors (eg, estrogens and androgens, insulin, and leptin) promise to lead to new innovations in manipulation of growth and stature.
In 1985, the first case of Creutzfeldt-Jakob disease (CJD), a rare and fatal spongiform encephalopathy, was recognized in patients who had received GH derived from cadaveric pituitary glands; investigation disclosed that pituitary glands from which the GH was derived were contaminated with subviral particles (prions). Fortunately, the U.S. Food and Drug Administration (FDA) approved biosynthetic hGH the same year, with production of hGH by biological systems (Escherichia coli and, later, mammalian cells) inserted into the GH gene now yielding a virtually unlimited supply of hGH and eliminating risk of infection transmission. All currently available hGH is the 191-amino-acid recombinant human GH (rhGH) form, which is molecularly identical to endogenous GH.
Children with milder forms of inadequate GH secretion, previously excluded from GH therapy, can now be considered for treatment. Increased availability of hGH has also allowed investigation of its growth-promoting effects in poorly growing children who do not fit traditional definitions of GHD, many of whom were previously believed to be unresponsive to GH treatment. In addition, metabolic effects of GH apart from linear growth promotion are now being studied extensively, leading to new indications for and pharmacologic dosing of hGH therapy. The spectrum of disorders for which hGH has been prescribed and the number of children receiving treatment continue to increase (Table 2-5).
| Indication | Dosagea |
|---|---|
| GHD | 0.024-0.04 mg/kg/day |
| PWS | ∼1 mg/m2/day |
| SGA/IUGR | Up to 0.07 mg/kg/day |
| Turner syndrome | Up to 0.067 mg/kg/day) |
| Noonan syndrome | Up to 0.066 mg/kg/day |
| ISS | Up to 0.055 mg/kg/day |
| Chronic renalinsufficiency | Up to 0.05 mg/kg/day (dose should be given 4 h after dialysis) |
| AIDS wasting | Consult adult text |
| Adult GHD | Starting 0.2 mg/day (range 0.15-0.30 mg/day) increase by increments of 0.1-0.2 mg/day every 1-2 months or starting 0.006 mg/kg/day up to 0.025 mg/kg/day depending on age |
| SHOX deficiency | Up to 0.05 mg/kg/day |
Concern about social and psychological harm of short stature, and hope for effective therapy, has resulted in increased referrals for growth-promoting therapy. However, data confirming that stature per se is a primary determinant of psychological health is limited, with only a minority of studies reporting detectable underachievement, behavior problems, and reduced social competency in short-statured children. Organic neuroendocrine dysfunction (eg, classic severe GHD), rather than stature itself, may correlate most closely with psychological and scholastic impairment. Though the physiologic benefits of hGH supplementation to children with severe GHD appear obvious, data confirming the efficacy of hGH therapy in improving the quality of life of non–GH-deficient recipients are scarce.
For many children, hGH treatment will be appropriate therapy after the cause of the growth problem, the concerns of patients and parents, and likelihood of success have been assessed. For most short children, however, efforts to build self-esteem through parental support, judicious selection of activities, and counseling may be more effective than hGH injections. The decision to institute long-term hGH therapy should include both careful physical and psychological evaluation to determine whether the degree of disability and likelihood of therapeutic benefit justify investment of the required emotional and monetary resources and potential adverse effects.
Many children are born with intrinsic traits that predispose them to short stature despite normal endocrine systems. These factors affect either the tempo at which growth is accomplished (constitutional growth delay) or the absolute growth potential of stature-increasing growth centers (eg, children with short familial stature, born SGA, or with defined genetic syndromes or skeletal dysplasias). The most severely affected children frequently demonstrate a combination of both traits. Standard laboratory evaluation usually reveals laboratory evidence for normal GH secretion and IGF-1 levels. However, recent discoveries (eg, mutation in the STAT5b component of GH signaling pathway) are beginning to provide physiologic explanations in a small number of cases of “normal” short stature. In addition, apparent normality of the GH/IGF-1 pathway does not preclude responsiveness to hGH therapy, and several causes of intrinsic short stature are now included in approved indications for hGH therapy.
Constitutional delay of growth and puberty (CDGP) refers to children with short stature who have delay in the tempo of growth and pubertal maturation. Children who are short due to CDGP usually show deviation from growth along normal percentiles between 12 and 36 months of age and, by 3 years of age, begin to display normal growth velocity for age with height below their MPH percentile and parallel to, but usually below, the 5th percentile (although at a higher percentile when parents are very tall). The slower tempo of growth and maturation leads to late onset of puberty, exaggerated slowing of the prepubertal growth rate, and normal growth acceleration, but slight attenuation of overall growth accomplished during puberty. Adult height is usually within the normal range because of the longer period of growth prior to epiphyseal fusion, but usually in the lower part of the MPH range. By definition, children with pure CDGP should have BAs sufficiently delayed to result in normal predicted adult heights. Marked delay in pubertal growth can adversely affect spine mineralization, and osteopenia in men with a history of CDGP suggests that bone mineral accretion may be an intrinsic defect in those with CDGP.
The growth pattern typical for CDGP likely reflects secondary growth-slowing effects of exaggerated early-life inhibition of hypothalamic-pituitary-gonadal activity and delayed reawakening of this same system to trigger pubertal onset rather than primary abnormalities of the GH/IGF-1 axis. During early-to-mid-childhood, children with CDGP demonstrate normal GH secretion in response to provocative tests and have normal to slightly low serum IGF-1 and normal IGFBP-3 concentrations corrected for BA. However, in late childhood, children with severe CDGP often demonstrate low GH secretion in response to stimuli, suggesting transient GHD corresponding to the observed pubertal delay and growth deceleration resulting from low gonadal steroid production. Thus, if this physiologic phenomenon is not appreciated (ie, gonadal steroids are not administered before GH provocative testing), the diagnosis of true (rather than physiologically transient) GHD is suggested and treatment often initiated. The fact that approximately 70% of postpubertal adolescents diagnosed with idiopathic IGHD during childhood show restoration of normal GH secretion suggests that hGH treatment is frequently being used to treat patients with CDGP rather those who are truly GH-deficient.
Idiopathic short stature (ISS) is a diagnosis of exclusion applied to otherwise healthy short children with no identified etiology for poor growth; that is, no systemic illness, endocrine disorders, genetic syndromes, bone dysplasias, or low birth weight and other factors compromising growth, such as depression or psychosocial deprivation, are identified. By definition, these children have heights less than 2 SD below the mean for a given age, sex, and, if available for comparison, specific population group.18
ISS can be defined by a height less than 5th percentile, growth velocity that is parallel to, but below, the normal growth curve, and BA congruent with chronological age. When there is no concurrent constitutional delay, time of pubertal onset is normal with a projected final height near the current growth percentile. The height of both parents is often less than 10th percentile with the calculation of the MPH and suggesting a final height that is reflective of that of the parents. As mentioned previously, a marked difference between parental height percentiles can compromise the utility of the MPH calculation. Though there is a tendency for a child’s height to trend toward the MPH, some will clearly follow one parent’s pattern closer than that of the other. Comparison with height percentiles of siblings may be helpful in this situation.
Some cases of familial or genetic short stature are likely to represent heritable, subtle disruptions in the GH/IGF-1/growth plate axis. An example of such a defect may involve receptor and postreceptor signaling abnormalities that create reduced linear growth accomplished in response to normal GH secretion. For instance, heterozygous GHR mutations are found in a small minority of children with ISS and poor response to GH, implicating receptor resistance to GH action. In addition, mutations in the SHOX (short stature homeobox-containing) gene region19 and heterozygous mutations in the IGF-1–associated ALS account for poor growth in another small subset of children with ISS. Given the complexity of possible genetic influences on the growth axis, the simple diagnosis of familial or genetic short stature will become increasingly inadequate to determine which children may warrant further evaluation and/or intervention.
Treatment of ISS with hGH is vigorously debated for economic and ethical reasons, as it is still unresolved as to what degree of shortness should be considered a normal variant and in what circumstances treatment is justified for a characteristic that is not a definable disease or disorder. Thus, the decision to medically intervene for those who meet the criteria for ISS is individually based on the degree of current childhood shortness, likelihood for an acceptable adult height without intervention, psychological stress associated with short stature, and evidence that treatment will have a positive effect on growth and quality of life. The FDA has approved hGH for treatment of ISS if the height is less than or equal to −2.25 SD below the mean (∼1st percentile), the predicted adult height falls below the normal range (160 cm [5 ft 3 in] for males, and 150 [4 ft 11 in] for females), epiphyses are open, and other causes of short stature are excluded. The average height velocity in the first year of treatment typically increases to 8 to 9 cm per year compared to 4.5 cm per year before treatment. However, the effect on ultimate height gained is relatively modest, estimated to be approximately 1 cm per year of hGH treatment.20
Long-term hGH treatment of non–GH-deficient short children with ISS at recommended doses (0.375 mg/kg/week) can lead to statistically significant increases in final height in some children. As adult height is predominantly determined by the 85% of growth occurring before puberty, effective hGH therapy requires substantial growth acceleration prior to puberty and earlier treatment enhances outcome. Overall, girls appear to derive less height-increasing benefit, most likely related to later institution of treatment and earlier onset of puberty. Greater BA delay and taller MPH predict greater response, whereas low MPH predicts a poorer response; otherwise, there are presently no clinical (eg, pretreatment growth rate) or biochemical determinants that reliably predict long-term response to hGH therapy.18 Future studies may discover in the ISS population distinct genetic disturbances or subtle forms of GHD that respond differently to treatment. In the meantime, whether meaningful improvements in final height are sufficient to justify cost and commitment to several years of hGH therapy is still debatable.
Related posts:

Stay updated, free articles. Join our Telegram channel

Full access? Get Clinical Tree


