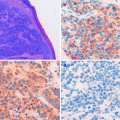
Fig. 18.1
FLIM images acquired at 760 nm excitation wavelength by the Imperial College FLIM system incorporated in the DermaInspect ® and processed using the software SPC IMAGE (Becker & Hickl GmbH). (a) Healthy skin acquired in vivo at 20 μm depth: the keratinocytes appear as green cells tightly packed together. (b) Basal cell carcinoma acquired ex vivo: the keratinocytes are detached and appear blue-green, showing longer lifetimes compared to healthy skin
FLIM acquisition has proved useful in the determination of parameters such as pH [26], ion concentrations [27, 28], oxygen saturation [29, 30], refractive index [31], conformation of proteins [32] and aggregation states [33]. FLIM is also used to distinguish DNA and RNA [34], to separate bound and unbound NADH or FAD [35] in autofluorescence images [36] and to separate interacting and noninteracting protein fractions in FRET (Förster resonance energy transfer) experiments [37, 38]. Importantly, two of the strongest sources of intrinsic fluorescence of cells are NADH and FAD, which are fundamental to metabolism and important regulators of cell behaviour as well as potential cancer biomarkers [39–41]. For these reasons, MPT-FLIM is a promising device to study skin tumours, since it is able to define morphological and functional properties of cancer cells and of their associated stroma.
Excitation Wavelength
Epidermal structures can be efficiently excited at a wavelength of 760 nm [16, 20–22, 42–47]. When the excitation wavelength is increased above 800 nm, most keratinocytes lose their excitability and progressively become invisible. Since melanin, compared with other organic fluorophores, has an absorption spectrum that decreases from the UV region to NIR, its selective excitation wavelength is 800 nm [23, 48]. Single cells visible in the basal layer, showing intense fluorescence at 800 nm, can be identified as melanocytes. This excitation wavelength can be used to study benign and malignant melanocytic lesions.
Collagen and elastin are the main dermal components, and their excitation takes place at a variable wavelength from 760 to 840 nm. To adequately visualise the fibrous structures of the dermis, an 800 nm wavelength is generally employed. At this wavelength, collagen fibres that generate the SHG signal are selectively excited, whereas at 760 nm, dermal autofluorescent components such as elastin are enhanced in the image.
Practical Considerations and Applications
Application Fields
The MPT/FLIM technique has numerous applications in dermatology, being suitable for the study of physiological and pathological conditions of the skin, in vivo, on ex vivo samples and on cultured cells [49, 50]. Mesenchymal stem cells undergoing various differentiation stimuli can be monitored in a non-invasive manner evaluating morphology, metabolic activity and oxidative stress [49]. Fibroblast cultures are widely used as an experimental model to study the expression of specific genes or the effect of drugs, especially of new compounds with potential chemotherapeutic activity, and to check the mutagenicity and carcinogenicity of different substances. Using MPT and FLIM, a precise and rapid assessment of the morphologic and metabolic changes which fibroblasts undergo after exposure to various environmental factors can be achieved without the need of cell processing and staining [50].
When studying diseased states of the skin, knowledge about normal morphology is of utmost importance. As regards healthy epidermis, it has been shown that cell and nucleus diameters, cell density and fluorescence lifetime values vary not only according to epidermal cell depth but also depending on skin site [51]. Skin ageing is expressed by variations in shape, size, distribution and morphology of epidermal cells. Moreover, FLIM values at both the upper and lower layers increase, indicating a change in the metabolic activity of epidermal cells in the elderly [52]. These data can be used for the comparison with MPT/FLIM aspects of epidermal cells in pathological conditions.
Basal Cell Carcinoma
Employing MPT, a rapid and accurate tumour demarcation from the surrounding noninvolved skin can be achieved [25, 56]. Considering both autofluorescence images and fluorescence lifetime images Galletly NP et al. identified several alterations of cell metabolism and morphology, allowing the discrimination between healthy skin and the tumour region. On the basis of wide-field imaging lifetime information, they demonstrated that BCC exhibits longer fluorescence lifetime than surrounding healthy skin [25]. These observations were confirmed by another working group, which described a shift of the mean lifetime distribution of BCC towards longer values, especially in the intermediate epidermal layers [52].
Another feature revealed by MPT is the alteration of the extracellular matrix in the BCC stroma [46]. In BCC, dermal collagen is replaced by tumour nests of basaloid cells which destroy the surrounding environment by the collagenolytic activity of matrix metalloproteinases. The result consists in a disarrangement of the collagen molecule packing, thus altering the dermal distribution of the fluorophores and decreasing the SHG signal [46, 56, 57]. The increase in the autofluorescence signal in the cancer stroma, in comparison with that of normal dermal stroma, is unclear at this stage [56].
Lin et al. performed a quantitative analysis to discriminate normal dermal stroma from the tumour; in their approach, multiphoton fluorescence (MF) pixel number (a) and SHG pixel number (b) were determined within a region of interest, and the MF/SHG index was defined to be (a − b)/(a + b). Consequently, MF/SHG reached the maximum value of 1 when only the MF signal was present (corresponding to the presence of only elastic fibres) and decreased with the growth of collagen content (which generates the SHG signal). Whereas in normal dermal stroma MF/SHG was very low, reflecting the high content of collagen bundles, in the cancer stroma it was significantly higher because of the low contribution of undamaged collagen [46].
The epidermis overlying the BCC may be thinned, thickened or ulcerated compared to normal skin [52]; conversely, all the ex vivo specimens investigated by Paoli et al. showed a marked increase in epidermal thickness compared to the corresponding normal perilesional skin [53, 55].
BCC is characterised by clumps of autofluorescent cells in the dermis [46] which show relatively large nuclei, little cytoplasm [55] and a higher nucleus to cytoplasm ratio [46, 56]. Peripheral basaloid cells palisading along the basement membrane [46, 56] are a distinctive histopathologic feature of basal cell carcinoma. They can also be observed in each cancer nest.
Paoli et al. described tumour cells which were monomorphous and palisading at the periphery, with nuclei polarisation corresponding to keratinocytes with elongated nuclei and cytoplasm oriented in the same direction in the X−Y plane [53, 55].
De Giorgi et al. analysed different surgical samples of BCC investigating cell shape and size: compared with healthy skin cells, tumoural ones appeared smaller in dimensions and tightly packed together; they also exhibited a reduced fluorescent contrast between cytoplasm and nucleus [54].
Speckled perinuclear fluorescence was sometimes observed in subcorneal epidermis of superficial BCC but was also present in the corresponding normal perilesional skin [53].
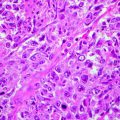
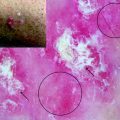
In a study on 98 BCCs, Seidenari et al. identified three epidermal and seven tumour descriptors for BCC [58]. Compared to normal epidermal cells, those overlying the BCC exhibited irregular cellular contours, had lost the normal cohesion and were disposed in a random order; moreover, intercellular spaces were larger and irregular (Fig. 18.1). BCC cells appeared monomorphous with an elongated shape and nuclei; they were aligned along the same direction and tightly packed together (Fig. 18.2a); sometimes a double alignment was observable with divergent sheets of cells (Fig. 18.2b). At the edge of the nodule, a palisading phenomenon was often visible (Fig. 18.2c). By an excitation wavelength of 760 nm, basaloid nodules were observable as cell aggregates surrounded by fibres (Fig. 18.3). Whereas BCC cells exhibited a bluish colour corresponding to a high fluorescence decay time, the collagen fibres appeared in red due to very low fluorescence lifetimes (Fig. 18.3). When shifting the excitation wavelength to 800–820 nm, to explore the extracellular matrix, BCC cells disappeared and only red fibres surrounding black spaces were visible (phantom islands) (Fig. 18.4). Finally, BCC cells showed mean fluorescence lifetime values which were significantly higher with respect to normal epidermal cells, indicating that FLIM may also provide quantitative data for the identification of single tumour cells.
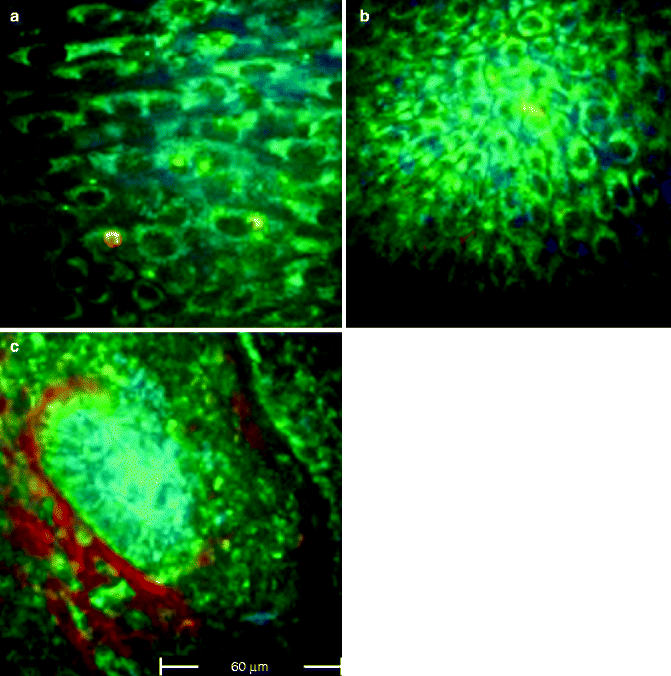
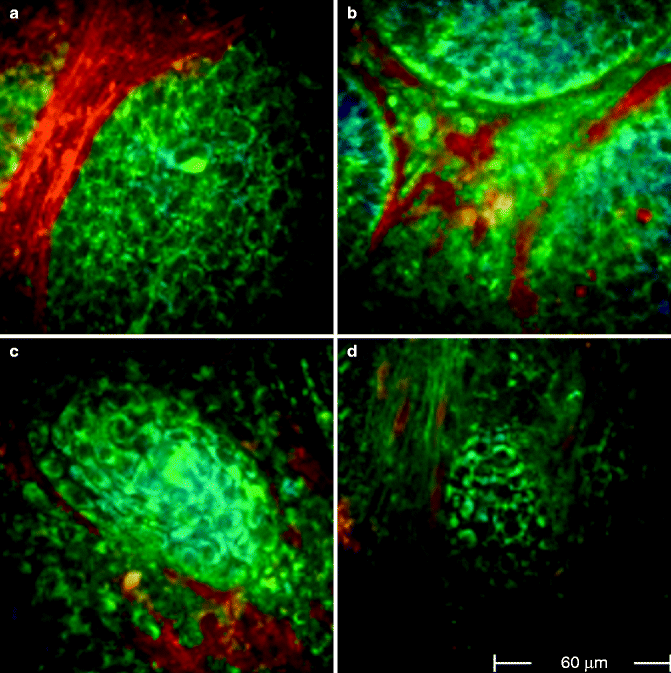
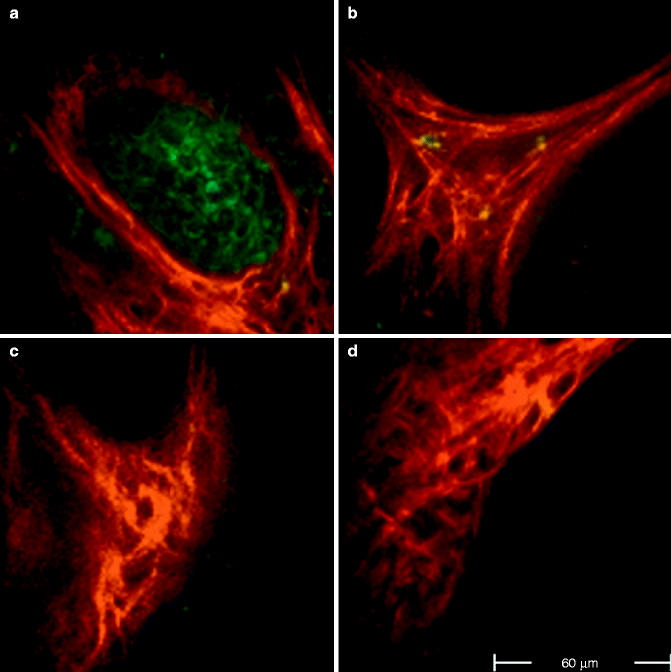

Fig. 18.2
FLIM images acquired at 760 nm excitation wavelength by the Imperial College FLIM system incorporated in the DermaInspect ® and processed using the software SPC IMAGE (Becker & Hickl GmbH). (a) Basal cell carcinoma. FLIM image acquired at 40 μm depth that shows elongated and aligned blue cells. The alignment occurs at one direction. (b) Basal cell carcinoma. FLIM image acquired at 100 μm depth that shows elongated blue-green cells aligned in two different directions. (c) Basal cell carcinoma. FLIM image acquired at 100 μm depth. It is possible to see the upper part of a basaloid nest which shows a palisade of blue cells tightly packed. A vessel, which appears linear and red, circumscribes the left edge of the nest

Fig. 18.3
FLIM images acquired at 760 nm excitation wavelength by the Imperial College FLIM system incorporated in the DermaInspect ® and processed using the software SPC IMAGE (Becker & Hickl GmbH). (a) Basal cell carcinoma. FLIM image acquired at 40 μm depth that shows elongated and aligned blue cells. The alignment occurs at one direction. The figure shows four examples of basaloid nests (FLIM images) acquired from different patients at a 760 nm wavelength. (a) 110 μm depth: a basaloid island surrounded by a network of red collagen fibres. (b) 120 μm depth: bundles of collagen fibres which separate three basaloid blue nests. (c) 70 μm depth: a tumoural nest in the upper dermis. (d) 80 μm depth: poorly defined tumoural islands, intermingled with collagen fibres

Fig. 18.4
FLIM images of basal cell carcinoma acquired at 800–820 nm excitation wavelength by the Imperial College FLIM system incorporated in the DermaInspect ® and processed using the software SPC IMAGE (Becker & Hickl GmbH). Increasing the wavelength, the blue keratinocytes become less visible, appearing as dark spaces; the black shapes of the islands are surrounded by red collagen fibres. (a) FLIM image at an 800 nm excitation wavelength, 90 μm depth. (b) FLIM image at an 820 nm excitation wavelength, 140 μm depth. (c) FLIM image at an 820 nm excitation wavelength, 120 μm depth. (d) FLIM image at an 820 nm excitation wavelength, 105 μm depth
The diagnostic aid provided by MPT can sometimes be limited by the deep location of the tumour nests, especially in the nodular BCC type [47] or by epidermal thickening and hyperkeratosis [55] which makes the exploration of the tumour mass difficult.
MPT can also be very useful for the investigation of surgically removed samples before pathologist’s examination on ex vivo specimens [47] or as an alternative to Mohs’ surgery.
Epithelial Precancers
Skala and colleagues investigated low- and high-grade epithelial precancers compared with normal epithelial tissues. A significant decrease in the contribution of protein-bound NADH and a significantly increased variability in the redox ratio and NADH fluorescence lifetime were observed in precancerous cells [35]. Precancerous and cancerous samples generally show increased keratin thickness, increased epithelial thickness, decreased nuclear density ratio and decreased keratin layer fluorescence [59]. Moreover, cellular fluorescence becomes progressively weaker and more perinuclear in precancerous and cancerous tissue when compared with normal tissue [60].
Squamous Cell Carcinoma
Paoli et al. investigated five squamous cell carcinoma specimens. In these samples the stratum corneum was abnormally thick compared to the corresponding perilesional skin. In the same specimens, fluorescent nuclei compartments within the corneocytes were observed. This morphological and fluorescent feature had been described earlier in the presence of hyperkeratosis [20]. In two hyperkeratotic lesions, large, rounded bundles of keratin were observed within the SC, corresponding to the so-called keratin pearls.
In all but one lesion, the keratinocytes within the SG, the SS and the SB were irregularly distributed, reflecting a loss of cell polarity. Dimly fluorescent and widened intercellular spaces were present in three of these four lesions. Signs of bowenoid dysplasia, including pleomorphism and substantial variation of nuclei size, were observed within the epidermis of four lesions. Large, multinucleated cells were noticed in all five lesions. Keratinocytes with brighter cytoplasmic fluorescence compared to surrounding cells in the SG and the SS were discerned in two lesions, possibly corresponding to dyskeratosis. Four lesions presented speckled perinuclear fluorescence in the SG and/or the SS, whereas this feature was only observed in one corresponding normal perilesional skin sample.
Malignant Melanoma (MM)
Melanocytic lesions are easily investigated when considering that melanin is a fluorophore characterised by emission lifetimes different from those of other endogenous fluorophores. Dimitrow et al. investigated some procedures of selective melanin imaging and spectral fluorescence lifetime imaging in combination with high-resolution multiphoton laser tomography by analysing 46 melanocytic lesions of human skin [23]. Remarkable differences in lifetime behaviour of keratinocytes in contrast to melanocytes were observed. The fluorescence lifetime distribution was found in correlation with the intracellular amount of melanin. Examining the unique light absorption behaviour of melanin, they found a selective fluorescence of melanin-containing cells at an excitation wavelength of 800 nm. Their results revealed that keratinocyte lifetime values correspond to NAD(P)H and melanocyte lifetime values to the endogenous fluorophore melanin. Thus, whereas FLIM on single data points allowed a clear separation of different melanised cell types (e.g. keratinocytes, melanocytes), it seemed to be unsuitable for a classification of benign versus malignant melanocytic skin lesions. Both melanocytic nevi and MM were characterised by enhanced cell density of melanocytes primarily in the basal epidermal layer. Being the alteration of the upper epidermal layers a unique characteristic of malignant proliferation, the crucial point of differentiation was identified in the presence of ascending melanocytes. Spectral analysis of MM revealed a main fluorescence peak around 470 nm in combination with an additional peak close to 550 nm throughout all epidermal layers. From this they concluded that morphological alterations, in combination with a selective excitability at 800 nm, a short medium lifetime and a distinct peak around 550 nm in suprabasal epidermal layers, are highly suggestive of MM.
Stay updated, free articles. Join our Telegram channel

Full access? Get Clinical Tree


