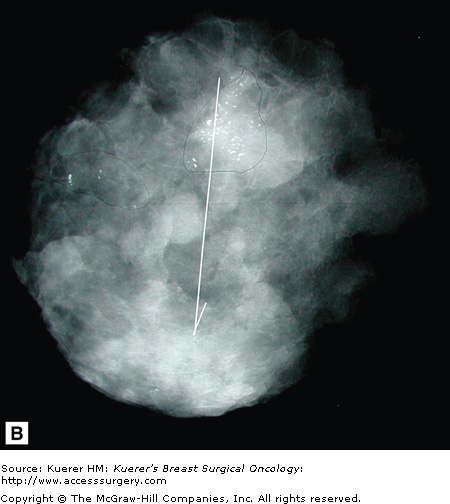
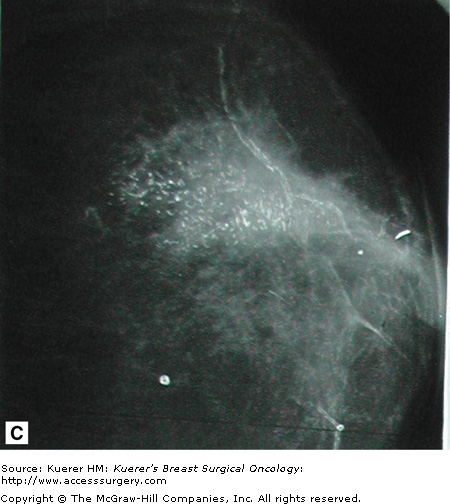
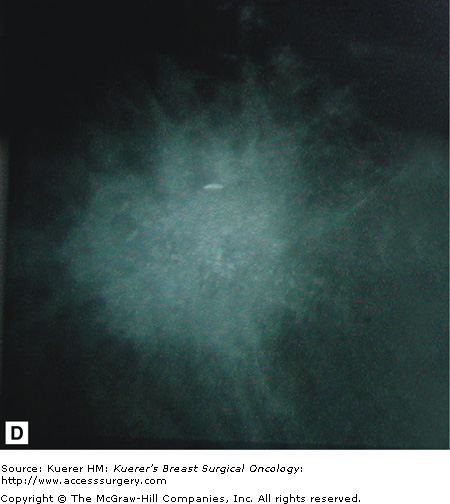
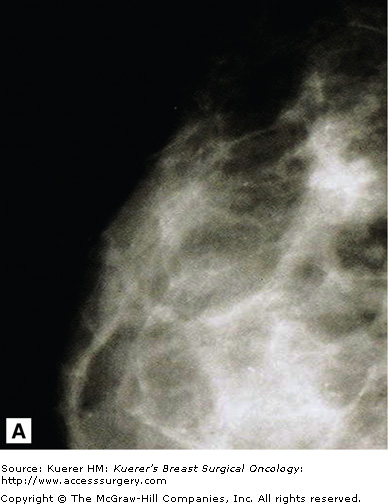
The first mammogram was performed in 1913 by Albert Salomon, a surgeon in Berlin, using a standard x-ray machine on an excised breast and axilla. Dr. Salomon wanted to show that the cancer spread to the axillary lymph nodes from the breast. Unfortunately, Dr. Salomon’s work was cut short by political turmoil in Germany, and we do not hear of radiographs of breast specimens again until 1927 when another German surgeon, Otto Kleinschmidt, describes a technique for imaging the breast that he attributed to his mentor, the plastic surgeon Dr. Erwyn Payr.
It was not until 1930 that a radiologist, Stafford L. Warren, from Rochester University, in New York, described an in vivo technique to image the breast preoperatively. He used a relatively sophisticated stereoscopic system with a grid mechanism to cut down on noise and intensifying screens to amplify the image. Little or no compression was used in these first mammograms. Still, Dr. Warren claimed to be correct 92% of the time when using this technique to predict malignancy.
In 1931, Walter Vogel, and subsequently Paul Seabold, described methods to distinguish benign from malignant lesions with mammography. Shortly thereafter, in 1938, radiologists named Jacob Gershon-Cohen and Albert Strickland published an article describing the radiographic changes in a woman’s breast throughout her menstrual cycle and life history. Dr. Gershon-Cohen tirelessly correlated mammographic images and pathologic specimens throughout his career, in an attempt to convince his colleagues of the utility of mammography. Dr. Gerson-Cohen emphasized the importance of compression and image contrast, using 2 films to collect data from both the thicker posterior breast tissue and the thinner peripheral breast. Despite his efforts, mammography was not used with any frequency until the 1950s.
In 1949, Raul Leborgne, in Uruguay, reported seeing microcalcifications in 30% of breast cancers using mammography. This rekindled interest in mammograms. Leborgne was the father of modern mammography, emphasizing good compression and spot/magnification to better see small structures. His large cone-shaped compression devices and careful descriptions of positioning, as well as calibration for exposure times, set the stage for our current techniques.
It was Robert Egan, however, who pulled all the technology together. By using high milliampere, low-kilovolt x-rays on industrial film with grids, he was able to effectively standardize screening mammography in the early 1960s.
In May 1963, the Cancer Control Program of the US Department of Public Health held a conference on mammography at M.D. Anderson Hospital to report the results of an initial national mammography study involving 24 institutions. The results showed a 21% false-negative rate and a 79% true-positive rate for screening studies using Egan’s technique.1 This was a milestone for women’s imaging in the United States. Screening mammography was off to a tentative start.
Standard screening views have evolved from the original positions of Leborgne, with the woman lying on her side, to Egan’s technique, where the woman stands or sits upright for her mammogram. This saves room in mammography departments, where space is usually at a premium and departments must be cost effective. The American College of Radiology (ACR) describes the standard screening mammographic views as craniocaudad (CC), mediolateral oblique (MLO), and mediolateral (ML). The patient positioning and position of the mammography machines are always the same for CC and ML views. The MLO view, however, varies based on a woman’s body habitus.
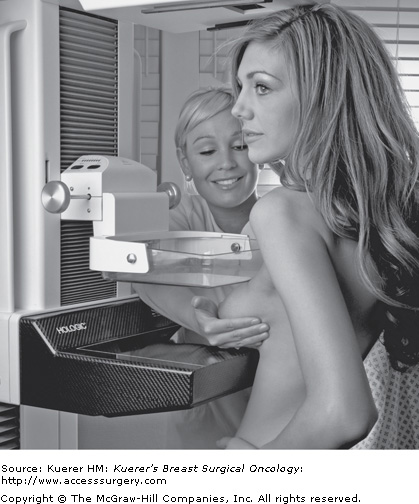
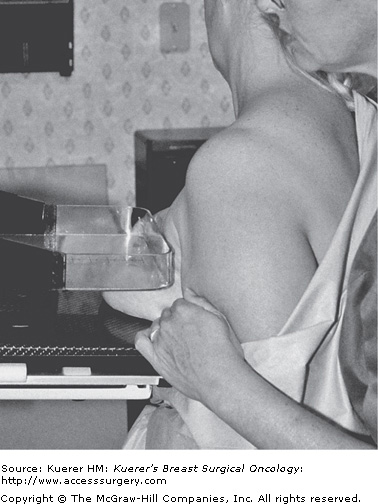
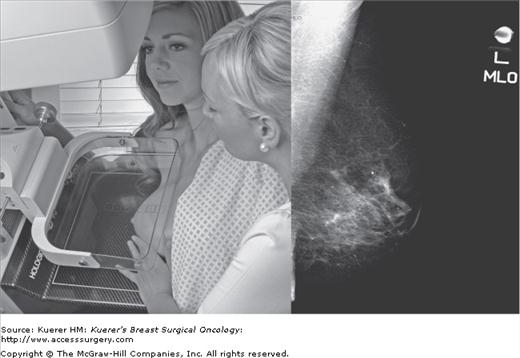
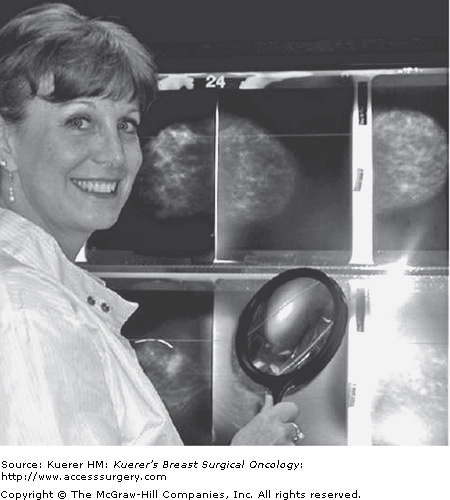
The CC view is achieved with the woman facing the horizontal mammogram bucky and compression device, which should be at the level of her inframammary fold (Fig. 28-1). She must then lean into the bucky while the technologist elevates her breast into the compression space (Fig. 28-2). The compression paddle is lowered with the foot control by the technologist (Fig. 28-3). It is useful to tighten the device manually after automatic compression to achieve the most optimum pressure on the breast and to maximize visualization of small structures such as microcalcifications and small spiculated masses. An experienced technologist can palpate a woman’s compressed breast and know if it has an appropriate amount of compression.
The ML view is not used in all cases. It is considered an additional view on screening cases unless the patient has augmentation or reconstructive breast implants in place. The ML view is achieved by placing the patient facing the vertical bucky and compression device. The technologist stands behind and to the outside of the patient as she is placed in the compression. The patient’s arm is extended over the bucky to the body of the mammography machine. She leans into the bucky (on the outside of her breast), and the compression paddle closes in on her breast from the medial side (Fig. 28-4). It is important for the technologist to elevate the breast during positioning because this causes the breast tissue to stretch out and flatten in the most advantageous fashion.
The MLO view must be tailored to the woman’s pectoralis muscle position. In the MLO view, the compression plates and bucky are angled from the vertical to be parallel to the lateral border of the pectoralis major muscle. This angle varies with every patient; hence the adjustable arm of the mammography machine and the virtual 360-degree rotation of the device. The MLO view should always include some pectoralis muscle. Ideally, the pectoralis muscle should be seen to the level of the nipple (Fig. 28-4). The MLO view is the most inclusive view, especially for the upper outer quadrant of the breast, which includes the most cancers. The Swedish Two-County Trial was performed using only MLO views.2 The MLO should be able to show about 95% of the breast tissue. Remember, the breast tissue can be found anywhere below the clavicles to the anterior stomach and from the midaxillary line to the sternum. Therefore 100% of breast tissue will not be covered, even by the best mammogram.
The carcinogenic risk associated with low-dose mammography is small but not negligible. Accordingly, attempts have been made to lower mammographic dose over the years while continuing to improve the quality of mammographic imaging.
Initially, mammograms were performed with standard x-ray machines using a tungsten target and standard x-ray filter and film. Low-dose mammography (using 18 to 40 keV) was started by Egan, using molybdenum targets and filters and higher resolution film. Despite reducing the x-ray dose, Egan’s technique resulted in the ability to discern 10 to 15 line pairs/mm, a significant improvement over the 3 to 5 line pairs/mm seen on plain film.
In addition to instrumentation, the amount of compression of the breast and the density of the gland combine to affect the radiation dose to the individual patient. Thinner tissue is penetrated more readily by the beam, causing less scatter and less absorption of the dose. Therefore, compression is not only a necessity for accurate reading of the films but is paramount to safe mammography technique. Dense glandular tissue also can cause increased beam scatter and elevate glandular dosage. The use of rhodium anodes and targets, common in digital mammography systems, is used to increase the penetration of the beam with some necessary increase in the glandular dosage in dense breasts. Overall, however, total exposure is decreased because less callback studies are required to complete the radiographic evaluation.
Magnification views may have a higher mean glandular dose than that of standard screening views. A typical magnification view creates a mean glandular dose of approximately 4 mGy, compared with about 1.5 mGy for screening views. Magnification views are generally performed with a nongrid technique because the “air gap” or distance from the tube absorbs most of the scatter radiation. Because the air gap also attenuates the beam, higher beam energy is required.
Radiation exposure with current standard mammograms is between 1 and 2 mGy per image, or about 3 mGy per breast. In contrast, a pulmonary computed tomography angiogram yields a 20 mGy/breast exposure.3 Additionally, standard whole-breast radiation therapy produces an exposure of approximately 50 Gy. The lifetime exposure of an average woman beginning at age 40 to 90 for yearly mammograms will be 0.2 to 0.4 Gy.
Although there is no low level of radiation exposure that does not increase the risk of breast cancer, in the average woman the benefit of detecting preclinical breast cancer far outweighs the risk of excess cancer obtained through standard screening mammography exposure.4 It is, however prudent to minimize radiation dose during mammographic screening by using a low-exposure technique and minimizing callback studies. Minimizing exposure is an important component of the Mammographic Certification program administered by the ACR.
Up to this point we have been discussing film-screen mammography. Standard film-screen mammography (analog imaging) has greatly aided in the detection of breast cancer, and it has lowered breast cancer deaths by as much as 30% over the past 50 or 60 years. Improvements in imaging techniques continue to arise, and full-field digital mammography has recently been introduced. The first digital mammography system prototype was exhibited at the Radiological Society of North America annual meeting in Chicago in 1995 with the first commercial unit becoming available in 2000. Full-field digital mammography has been credited with finding more breast cancers in younger women than analog, is more efficient, and more cost-effective than analog imaging.5
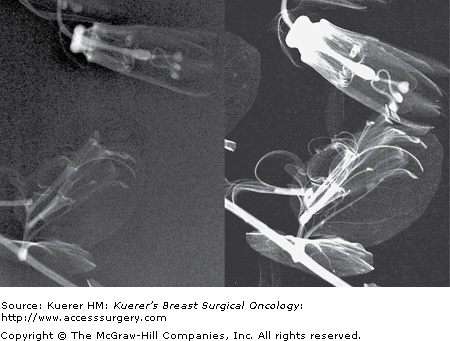
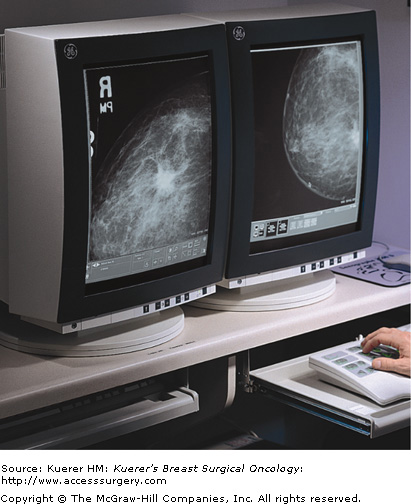
Like film-screen mammography, digital mammography (Fig. 28-5) uses x-rays to produce images of breast tissue. The difference is that digital images are formed on a phosphor screen rather than a film screen. The phosphor screen converts photons to light, which passes through a fiberoptic cable to a device that converts the light to a digitized signal for display on the computer monitor. This enables the viewer to manipulate the orientation, magnification, brightness, and contrast of the image as desired.
In contrast to analog imaging, which uses x-ray film to acquire, store, and display images (Fig. 28-6), digital mammography separates these functions. Digital mammography enables the reader to manipulate the images using specially optimized computer workstations and monitors, thus increasing the conspicuity of small tumors and microcalcifications. This postprocessing manipulation decreases callbacks. Digital techniques also minimize repeat imaging related to poor exposure by increasing the signal to noise ratio of an image over a broad range of keV.
As with analog imaging, appropriate positioning and compression are vital in producing a diagnostic film. From the patient’s standpoint, a digital mammogram is exactly like an analog mammogram, except she will wait a shorter time to know if the images are satisfactory. This is useful in situations such as high-volume screening programs and when doing needle localizations. As opposed to a 3- to 5-minute wait between views, the mammogram is available to evaluate within about 30 seconds. There is also no need for quality assurance of the film processing and developer fluid monitoring. Studies can be read at different locations from where they have been obtained, and with archiving; there is no need for hard copy (Fig. 28-7).
Results of the Digital Mammography Imaging Screening Trial (DMIST) were published on September 16, 2005, by the New England Journal of Medicine.5 This large-scale, multicenter trial was designed to measure differences in diagnostic accuracy between analog and digital mammography. It showed that, for the entire population of women studied, analog and digital mammography had very similar accuracy. However, the study showed that digital mammography was superior to analog in women <50 years of age, irrespective of glandular density, in women of any age with dense breast tissue, and in women who are pre- or perimenopausal.
The disadvantage of digital mammography is that the units are 3 to 4 times more expensive than analog units, and they are more sensitive to ambient temperature than are analog units. In addition, film-screen mammography is still superior to digital imaging in detail (line pairs/mm). Also, with slightly smaller bucky sizes, in a very large breast, the digital images must be taken in a patchwork pattern, which is more difficult to read.
Some women require additional mammographic imaging beyond the usual standard views to image their breast tissue completely. Mammography technicians are trained to obtain these views in women who have special screening needs. Typically, women with large breasts, augmented breasts, or who have undergone mastectomy require special views as a routine part of their screening. Special views are also required for the diagnostic evaluation of clinical or imaging abnormalities.
In some cases, additional imaging modalities are used to completely visualize all of the patient’s breast tissue. These modalities can include ultrasound, magnetic resonance imaging (MRI), and molecular imaging. This type of imaging is referred to as secondary screening. Women with dense breasts may also benefit from secondary screening.
If a patient’s breast is larger than average and cannot be completely imaged using standard mammogram films, extra views are recommended. At times, up to 4 additional images of each breast are recommended, in a patchwork fashion, to include all breast tissue.
Typically, women who require multiple views are still imaged using CC and MLO projections. If more than 1 image is required per projection to image the breast completely, these are labeled according to the quadrant of the view.
In centers that perform analog imaging, large-format mammographic films are available to image women with large breasts more completely. Unfortunately, large-format imaging is not available in digital systems.
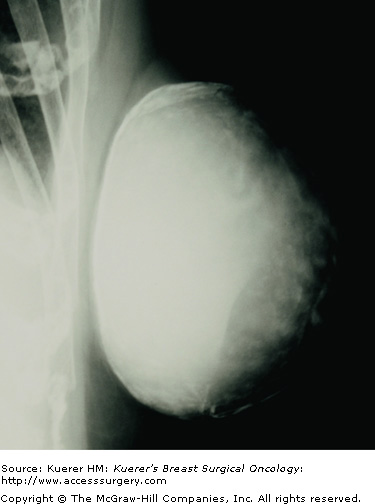
For the augmented breast, implant displacement views are required to adequately visualize breast tissue anterior to the implant. These views are performed by pushing the implant back, allowing compression of the natural breast tissue. These views are obtained in the standard prescreening projections and are labeled with “ID” in addition to CC, MLO, and ML. The standard CC, MLO, and ML views must also be included to evaluate each breast completely.
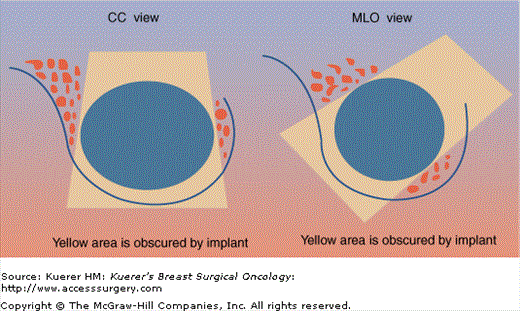
Despite the use of implant displacement views, the presence of the opaque implant obscures portions of the breast tissue, particularly if the implant is subglandular. This is graphically shown in Figure 28-8. Some imaging centers perform an additional ML screening view to minimize this problem.
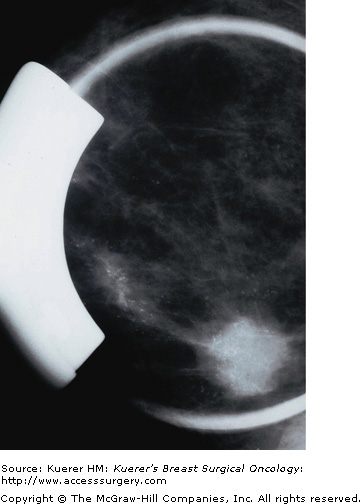
As opposed to screening studies, diagnostic mammography involves the use of special views to work up either physical findings or findings from a previous screening study (Fig. 28-9).
Diagnostic mammography uses spot/compression views, magnification views, tangential views, retromammary views, and anything else needed to better image areas of concern. In addition, ancillary imaging techniques such as ultrasound, MRI, and nuclear medicine imaging are also used at times. These latter techniques are discussed in other chapters.
Spot/compression views are performed with a smaller compression paddle, in the shape of a small circle or square, depending on the manufacturer. The smaller surface area compresses more effectively and therefore brings the tissue closer to the bucky and yields a clearer image of the area of concern. This is used for areas of architectural distortion, spiculation, small masses, and ill-defined densities. Densities that efface under compression tend to be benign, whereas densities that persist under compression are more suspicious.
Magnification views are images taken with a smaller focal spot than standard images. In general mammography, the focal spot is 0.3 mm and with magnification imaging, the focal spot is 0.1 mm and uses an air gap. This enables magnifications of up to ×2.5 with associated improved contrast resolution. This technique is used primarily for microcalcifications; however, it is also useful for small masses of any sort because it elucidates the borders of these lesions.
Tangential views are images taken with the palpable area of concern or calcifications centered along the surface of the breast and the x-ray beam coming perpendicular to the surface. These views are very helpful in distinguishing skin lesions from lesions deep in the breast. In general, skin lesions are considered less likely to be breast cancers.
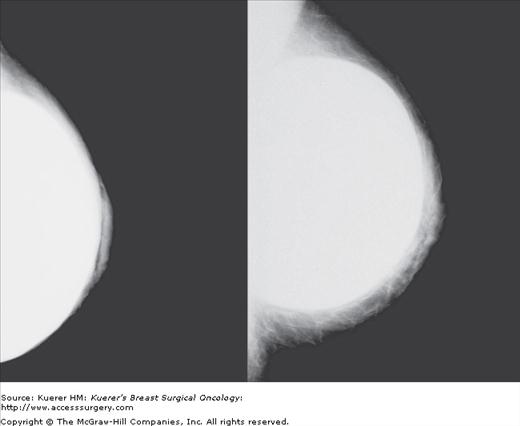
Retromammary views are views of the deep tissue of the breast adjacent to the chest wall, used primarily in imaging of implants (Fig. 28-10). This is useful to see the retromammary tissues, looking behind the posterior wall of implants.
Although radiologists’ talents are no longer limited solely to diagnosis, diagnosis remains the core of their work. In all areas of image-based diagnosis, the key functions the radiologist must perform are perception, interpretation, and action.
Mammography remains one of the most difficult areas in radiology primarily because of difficulty with the perception and, to a lesser extent, interpretation of mammograms. This is, unfortunately, a fundamental limitation of mammography. Mammographic studies are simply difficult to read.
Perception is the most difficult radiologic process to teach. To a certain extent, good mammographic readers are born, not made. Talent is definitely a factor in recognizing small and subtle lesions. The other primary factor is image quality. Maximizing mammographic image quality has been and remains a major focus of the ACR through their mammography certification program.
Interpretation can also be a challenge but is easier to teach. Teaching interpretation is, in our experience, a good way to teach perception. By working with the findings, students are often better able to recognize them.
More than other areas of radiology, mammographic interpretation is highly dependent on subtle pattern recognition and 3-dimensional visualization. Interpretation of mammograms is best performed in a quiet, darkened room. The only distractions or interruptions physicians should have while interpreting screening mammograms is the necessity of dealing with an emergency.
There is a positive correlation between reading volume and sensitivity in mammography as described by Moss et al.6 In the UK National Health Service screening program, a minimum of 5000 mammograms are required per year per interpreting physician. In the United States, federal law requires interpretation of at least 480 mammograms a year. Although every physician must meet these minimum requirements in the United States, there remains tremendous variability in the quality of mammographic reading. To become proficient in mammographic interpretation, many more studies than the minimum should be interpreted. A recent peer-reviewed study indicated that breast cancer detection is improved with mammography specialists who read > 4000 mammograms per year.
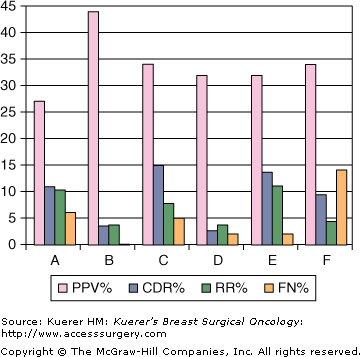
Ideally, an internal audit of each radiologist should be performed. The Mammography Quality Standards Act (MQSA) requires that each facility keep an audit of the performance of each reading physician. The number of cases read, the positive predictive value (PPV), the recall rates, cancer detection rate, which may include the number of minimal cancers, the number of node-positive cancers, and the number of false-negative cases should be included in the audit. The definition of the PPV varies among authors, but one of the most useful numbers to calculate in clinical practice is the number of cancers found/number of biopsies recommended (PPV2). This number is a guide to the aggressiveness and accuracy of the interpreting physician. This number should be >25% and < 40%. A cancer detection rate will vary for the community being screened, but a rate of between 2 and 15 per 1000 would be considered normal. A callback rate of around 5% to 10% is ideal and a false-negative rate of <0.5% in a screening population is strived for as defined by Linver et al.7Figure 28-11 shows an example of an audit by 6 radiologists.
Findings on screening mammography tend to fall into specific categories that the radiologist can analyze using a variety of special views or studies. Generally, in the United States, women who undergo screening mammography do not have their studies read immediately. Women who need additional views or special studies are asked to return to the imaging center for these. Studies performed on this basis are referred to as callbacks.
As discussed earlier, Callback studies are a reportable quality indicator. An increased number of callback studies have a positive effect on mammographic sensitivity but increased radiation exposure. Accordingly, the ACR has set standards for the number of callback studies performed to minimize this exposure.
Callback studies may be indicated to evaluate specific mammographic findings, including calcifications, circumscribed lesions, stellate lesions, radial scars, parenchymal asymmetry, or various indirect signs. The specific workup of these abnormalities is summarized in Table 28-1 and discussed later.
| Finding | Special Views | Benign | Suspicious | Ancillary Studies |
|---|---|---|---|---|
| Calcifications | Magnification | Nonbranching | Branching pleomorphic casting | MRI |
| Circumscribed | Magnification | Smooth | Microlobulated | Ultrasound |
| Stellate | Compression | Effaces | Persists | Ultrasound MRI |
| Radial scar | Compression | Effaces | Persists | Ultrasound MRI |
| Asymmetry | Compression retromammary | Effaces | Persists | Ultrasound MRI |
| Indirect signs | — | — | — | Ultrasound MRI |
| Density | — | — | — | Ultrasound molecular MRI |
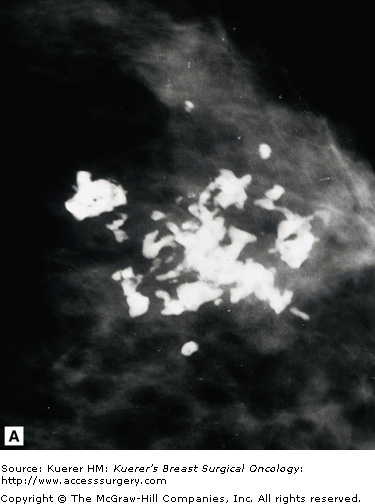
Because microcalcifications can be one of the earliest signs of breast cancer, detecting them remains a mainstay of mammography. One of the most basic aspects of the interpretation of mammography is the recognition and evaluation of breast calcifications. There are some hard and fast rules to distinguish benign from malignant; however, there will always be exceptions to these rules.
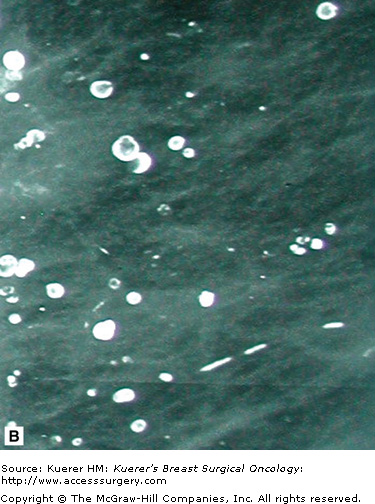
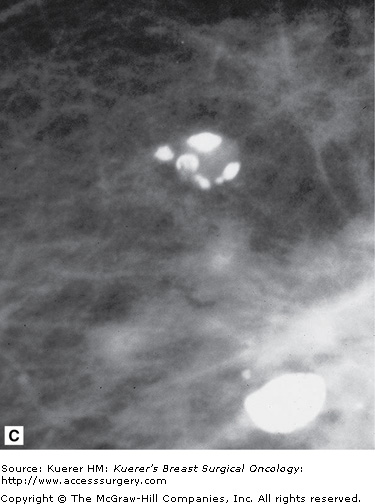
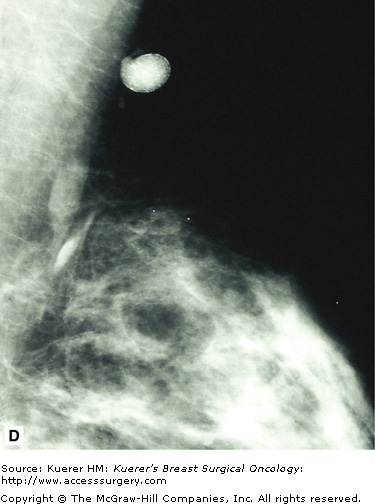
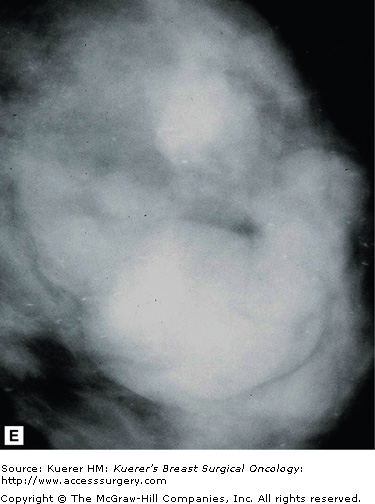
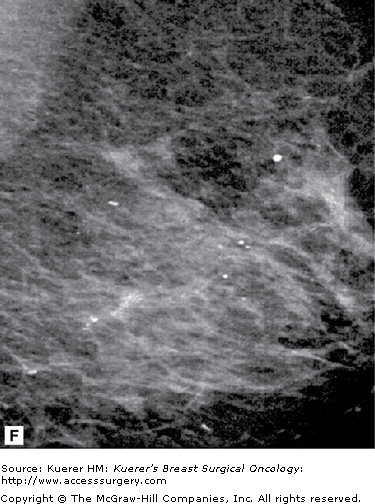
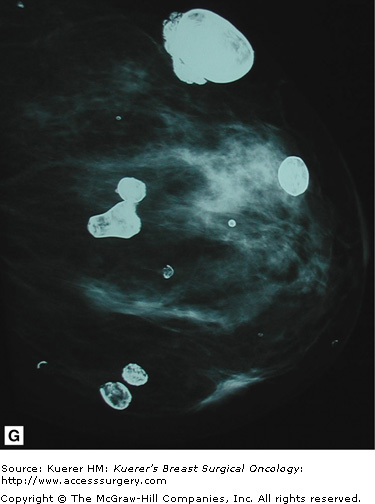
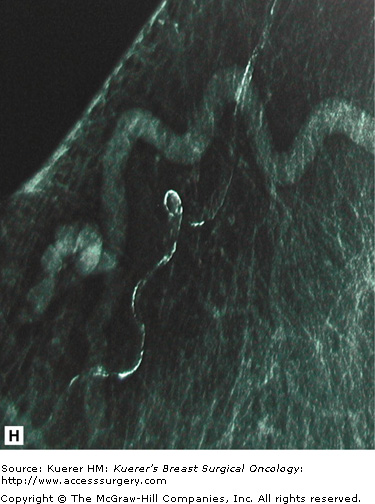
In general, benign calcifications can be defined as calcifications that form in normal structures within the breast or from benign processes such as fat necrosis, cyst formation, vascular atheromas, and duct ectasia. The vast majority of these calcifications have a typical appearance and can be recognized easily as nonmalignant. Some examples of benign calcifications are shown in Figure 28-12.
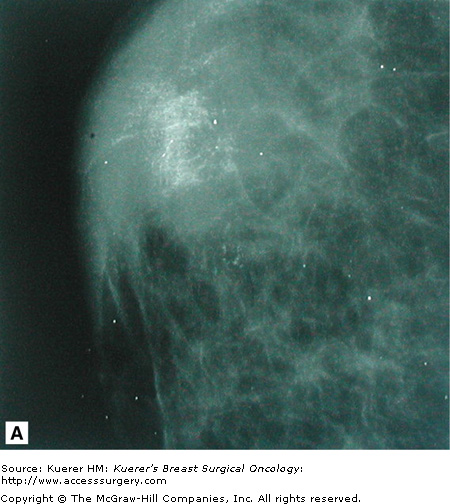
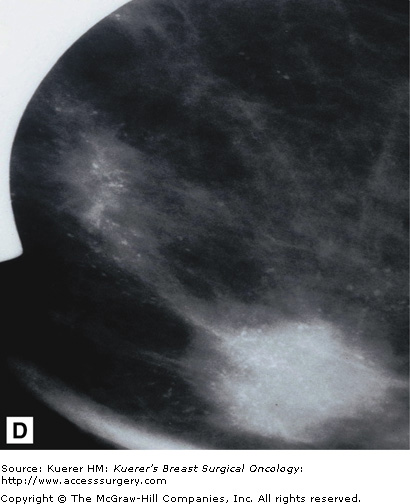
Malignant calcifications are associated with calcified intraductal carcinoma. Their appearance is variable, and their shapes are pleomorphic. Because they form inside ductal structures, they have a tendency to form in a linear arrangement and to have branching elements as shown in Figure 28-13.
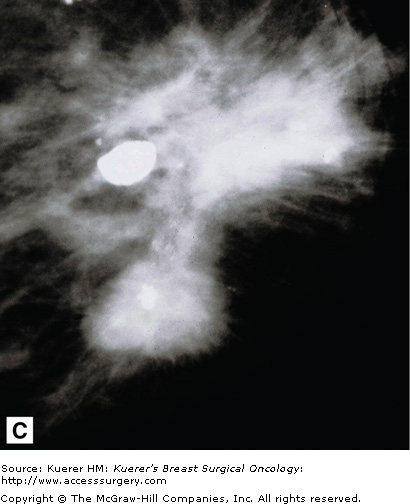
Circumscribed lesions, meaning lesions of which the borders are well defined and smooth, are considered predominantly benign. There are cases of well-circumscribed cancers, but if properly imaged, with small focal spot magnification views, almost always cancers can be distinguished by their irregular margins. Most of these lesions are ovoid in shape or smoothly lobular, with less than 3 lobulations. The majority of these lesions in the breast are cysts, fibroadenomas, or lymph nodes. Other well-circumscribed structures that may be seen include granulomas, fat necrosis, oil collections or “oily cysts,” or extracapsular silicone collections. Many of these calcify and are illustrated in Figure 28-12.
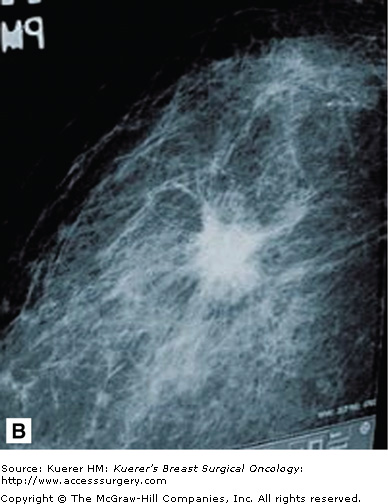
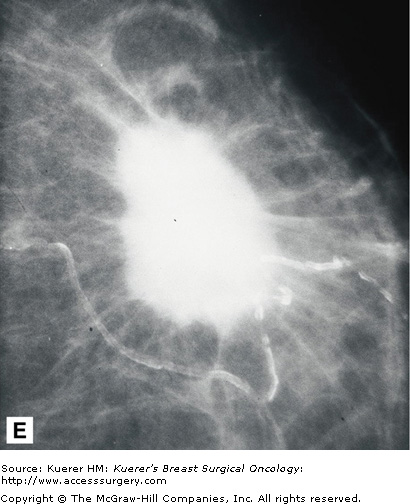
Stellate lesions are lesions with irregular, spiculated margins and are usually associated with cancer. Exceptions to this rule are radial scars and posttraumatic scars. The process of stellate lesion formation is similar with both the benign and malignant causes, and relates to fibrosis. In the case of benign scar formation, fibrosis is part of the healing process and involves the deposition of fibrin and collagen. In the case of a radial scar, which is a complex sclerosing lesion that appears de novo from a presumed nidus of inflammation, or sclerosing adenosis, the spiculations are caused by fibrotic strands extending outward from the central lesion. In the case of carcinoma, the spiculations are formed by a desmoplastic reaction the body forms around the growing cancer cells. Figure 28-14 shows examples of spiculated lesions.
Cancers that present as stellate lesions tend to be low-grade carcinomas because the formation of the inflammatory desmoplastic response takes time. High-grade cancers, which are fast growing, tend to present as circumscribed lesions.
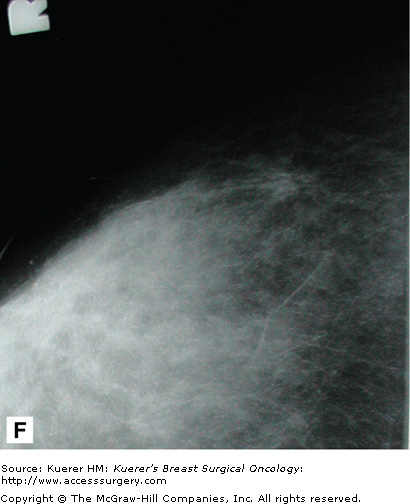
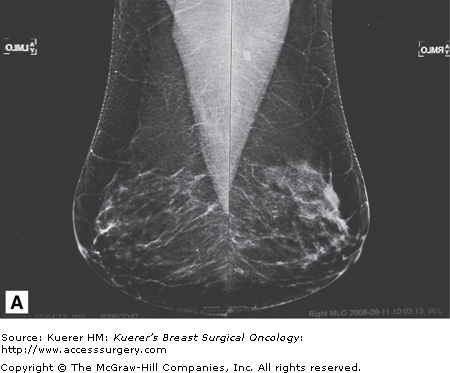
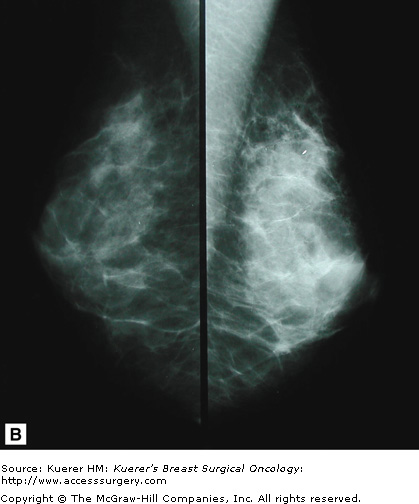
Parenchymal asymmetry refers to mammographic densities that occur in one breast but not the other, or in the areas such as the retromammary space, where breast tissue is not normally present. Of all the mammographic findings suggestive of malignancy, parenchymal asymmetry is considered the least suspicious.
Printable asymmetry is usually worked up with additional views to ensure there is no malignancy causing this asymmetry. Some patients have a significant amount of accessory fibroglandular tissue (as discussed earlier under polymastia) and, similarly, this may need to be addressed with additional imaging to rule out occult malignancy. Figure 28-15 shows examples of normal asymmetric breast tissue.
Skin thickening, nipple retraction, subtle increasing or decreasing breast size, tenting, and sharp angulation are indirect signs of malignancy. Other indirect mammographic findings include a sharply defined skin line, folded or asymmetrically angled nipple, or an increasingly dense breast on one side. These findings may be subtle and only well appreciated when compared with films from several years back. They may, however, be all there is to see in a developing cancer, especially in a subtle infiltrating lobular cancer. Again, these findings should be corroborated with ancillary imaging methods such as ultrasound, which may be able to detect a subtle mass causing these changes.

