Magnetic Resonance Spectroscopy Studies of Liver and Muscle Glycogen Metabolism in Humans
Roy Taylor
Gerald I. Shulman
PRINCIPLES OF MAGNETIC RESONANCE SPECTROSCOPY
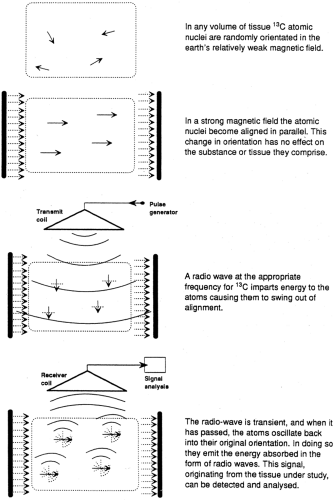
Although the vast majority of atoms have no magnetic properties, several atoms have nuclei with spin properties that impart a magnetic component that causes them to behave as miniature bar magnets. Each of these nuclei spins along an axis, which is normally randomly orientated in the weak magnetic field of the earth (50 μ T). In a strong magnetic field (1.5 to 7.0 T for human studies), the axes of spin of the atomic nuclei move into alignment and precess around the axis of spin. It is from this orderly steady state that the magnetic resonance information is gathered. The atomic nuclei relevant to in vivo nuclear magnetic resonance spectroscopy (MRS) are listed in Table 12.1, and the sequence of events is illustrated in a two-dimensional fashion in Figure 12.1.
| ||||||||||||||||||||||||
Application of a radio signal at the appropriate frequency for the relevant atom imparts energy to the nucleus, which causes the angle of precession to increase, effectively moving it out of alignment, usually 90 degrees to the direction of magnetic flux. The radio signal is transient, and when it has passed, the atoms move back to their original alignment and release the energy absorbed. This energy is released in the form of radio waves emanating from the atoms themselves, and the radio signal can be detected and analyzed. The two-dimensional display in Figure 12.1 is an oversimplification, because the process actually happens in three dimensions. Each atomic nucleus is not static but rather precesses around its own axis with a frequency that is a characteristic property of each element. It is the angle of precession that changes as the nucleus absorbs the radiofrequency energy.
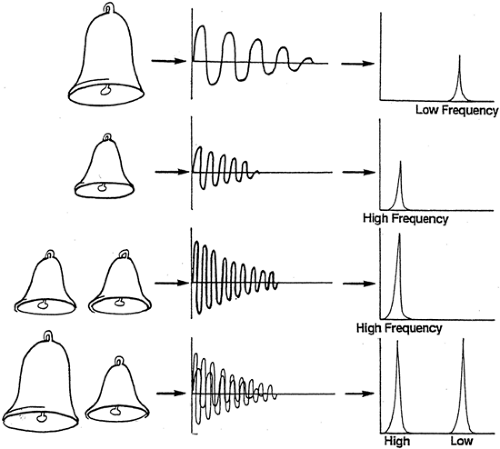
The principle that the greater the radio signal received the greater the concentration of the relevant atoms in the sample is easy to appreciate. It is rather less obvious how it is possible to tell that a given signal is coming from, say, carbon atoms in one compound rather than from any other that may contain carbon. By drawing analogy with the resonance produced by striking a bell, some features can be simply explained (Fig. 12.2). If several bells of the same size (that is, resonance properties) are struck simultaneously, the resulting resonance will have a greater amplitude than that from only one bell, but the resonance will have the same waveform. On the other hand, if two bells of different
sizes are struck simultaneously, two different waveforms will be superimposed. Thus, the radio waves generated from tissues in a magnetic resonance experiment will consist of many different waveforms, each coming from the 13C atoms in the many different compounds. This is so because the electrochemical environment of a carbon atom in, for example, the -CH2 group of triglycerides differs from that of the carbon atom in, say, the -CO(OH) group of glycerol.
sizes are struck simultaneously, two different waveforms will be superimposed. Thus, the radio waves generated from tissues in a magnetic resonance experiment will consist of many different waveforms, each coming from the 13C atoms in the many different compounds. This is so because the electrochemical environment of a carbon atom in, for example, the -CH2 group of triglycerides differs from that of the carbon atom in, say, the -CO(OH) group of glycerol.
These superimposed different waveforms can be unscrambled and converted to an understandable form by Fourier transformation, a mathematical transformation that results in display of the nuclear magnetic resonance (NMR) signal as a spectrum. This changes the display of an oscillating amplitude to one of separation of different frequencies of oscillation (illustrated on the right of Fig. 12.2). The signals from 13C in different compounds give rise to spatially separated peaks. These are described in arbitrary units of chemical shift or parts per million.
The area under each peak is a measure of concentration of each chemical grouping. To convert such measures to molar terms, it is necessary to place a phantom containing a solution of known concentration into the spectroscope. If the 100 mmol/L solution of glycogen results in a peak of a certain area, then a peak having half that area from an in vivo experiment would indicate the presence of 50 mmol/L glycogen in the tissues.
The area under each peak is a measure of concentration of each chemical grouping. To convert such measures to molar terms, it is necessary to place a phantom containing a solution of known concentration into the spectroscope. If the 100 mmol/L solution of glycogen results in a peak of a certain area, then a peak having half that area from an in vivo experiment would indicate the presence of 50 mmol/L glycogen in the tissues.
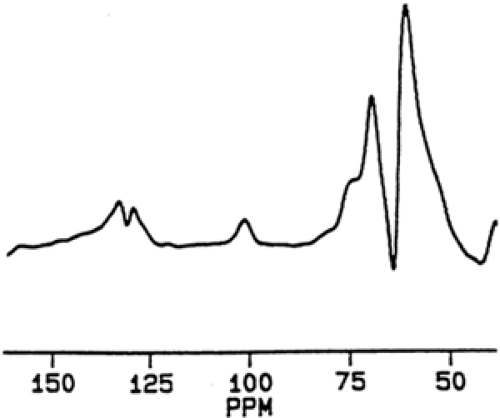
The final spectrum resulting from an NMR acquisition represents the average of many individual radio pulses. Each pulse and resultant signal from the excited atoms lasts only milliseconds and is repeated as rapidly as feasible. For example, routine acquisition of a liver glycogen measurement takes 15 minutes during which time 6,400 signals are accumulated. This allows synthesis of a reliable, reproducible spectrum (Fig. 12.3).
The above explanation is intended to convey a qualitative understanding of NMR spectroscopy. A more quantitative explanation of the technique is found in Gadian (1).
Localization of Signal
If the NMR signals were gathered from the whole body, only limited information could be obtained, as the result would be an average of the signals from liver, muscle, and all other tissues. By having the whole body in a strong magnetic field, but by delivering the radio signal only to a defined volume of tissue, it is possible to be certain how much of which tissue is being studied. In practice, this is achieved by placing a “surface coil” that acts as a radio antenna over the tissue of interest. By altering the power and other parameters of the radio signal, it is possible to know how deeply the signal penetrates. For the study of liver, it is usual to obtain a magnetic resonance image before carrying out spectroscopy to ensure that the organ is entirely within the sensitive volume of the surface coil.
ADVANTAGES OF MAGNETIC RESONANCE SPECTROSCOPY IN METABOLIC RESEARCH
Magnetic resonance spectroscopy allows acquisition of metabolic information in an entirely noninvasive manner. Because multiple measurements may be made, the time course of metabolic reactions and processes can be followed in vivo. Use of surface coils and volume-limited techniques permits accurate sampling of the tissues or organs of interest. In contrast, biopsies are limited to, at most, a few time points, so that time-course studies in a particular metabolite concentration are not feasible. In addition, release of stress hormones during biopsies might alter the concentration of the measured metabolites. The time lag between excision and freeze clamping of tissues, but also freeze clamping per se, may result in misestimation of different metabolic effects. Artifactually high concentrations of intracellular free adenosine diphosphate (ADP) can be explained by rapid hydrolysis of high-energy phosphate or by the tight binding of most of the ADP in intact tissue to proteins of myofilaments. In addition, a delay of several seconds during tissue handling already leads to raised intramuscular glucose-6-phosphate concentrations due to increased glycogenolysis (2). Finally, enzyme activities do not necessarily reflect the actual flux through metabolic pathways.
FACTORS LIMITING THE USE OF MAGNETIC RESONANCE SPECTROSCOPY IN METABOLIC RESEARCH
Subjects with magnetic or paramagnetic metal implants of any kind, including plates on bone, surgical clips, and pacemakers, cannot enter the magnet. Also subjects with claustrophobia of any degree may find the examination unbearable. This is typically not problematic if only a limb is to be inserted into the spectrometer.
The ability to detect any compound by NMR spectroscopy depends upon its concentration in the tissue of interest and the properties of the relevant atom (Table 12.1). The hydrogen nucleus has the strongest magnetic atoms, 31P having about 6.6%, and 13C having about 0.02% of the relative magnetic intensity of the hydrogen nucleus. In addition, the natural abundance of the isotope must be considered. 1H and 31P are both effectively 100% abundant, whereas 13C makes up only 1.1% of all carbon, the remainder being 12C. Because 31P has a modest magnetic sensitivity but the 31P isotope accounts for all the phosphorus, a clear signal can be obtained from ATP, inorganic phosphate, and phosphocreatine within cells, even though the concentration of these substances is relatively small. The weaker signal from 13C is suitable for studies of substances present in millimolar concentrations or greater. Hence, glycogen is measurable, as fasting concentrations range from 60 to 140 mmol/L in muscle and from 100 to 500 mmol/L in liver. Substances present in lesser concentrations, such as glycolytic intermediaries, could be measured, but only by enriching the 13C content by infusion of labeled precursor.
A spectrum is acquired by averaging many sequential resonances; hence, the subject must remain in precisely the same position to allow measurement on the same volume of tissue. This is not usually a limitation with studies on adults and is assisted by use of splints to maintain the position of the part of interest relative to the surface coil. Even for natural-abundance studies of 13C requiring total acquisition times of 15 or 20 minutes, comfort and compliance of the subject is not a problem.
VALIDATION OF MAGNETIC RESONANCE SPECTROSCOPY
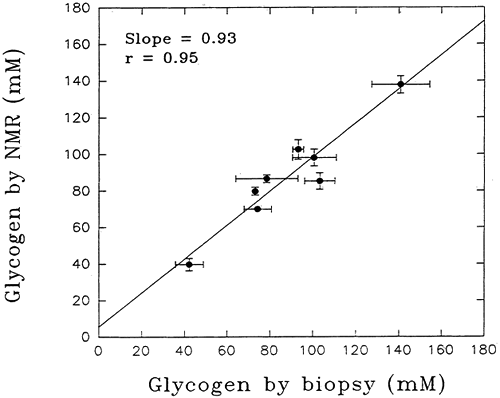
Validation of the NMR spectroscopy method for determining the concentration of substances in vitro was achieved long ago by straightforward chemical analyses on the sample after NMR measurements. For the first studies of the living human body, the assumption was made that the method would be equally precise in vivo. However, before embarking on clinical studies of glycogen in vivo, it was necessary to define the accuracy and precision of NMR measurements in vivo. To accomplish this, a group of subjects underwent measurement of gastrocnemius glycogen concentrated by the NMR method followed by muscle biopsy to allow direct assay of muscle glycogen concentration (3). The NMR glycogen measurements depended on the fact that 1.1% of all carbon in nature (and hence in muscle glycogen) is in the form of 13C, the stable isotope form. For each subject studied, six separate NMR measurements were made and three needle biopsies of the same muscle were taken. There was good agreement between the two methods across a wide range of muscle glycogen concentrations (r=0.95) (Fig. 12.4). Moreover, the NMR method proved to be more precise, the coefficient of variation being 4.3% compared with 9.3% for the biopsy method, despite optimization of the latter technique. Thus, NMR measurement of muscle glycogen in humans in vivo is not only precise but also accurate, as judged against direct biochemical measurement. Demonstration of comparability of spectroscopic measurement of liver glycogen with biochemical assay was achieved initially in rabbits (4). In humans, this has been done for triglyceride in subjects who required a diagnostic liver biopsy, and a good correlation with MRS measurement has been demonstrated (r =0.89) (5).
METABOLISM IN THE FASTING STATE
Liver
OVERVIEW
The liver contains the only store of glycogen that is readily available for release into the circulation as glucose. For this reason, estimation of the hepatic concentration of glycogen in healthy and diabetic persons is of considerable importance. By combining 13C-MRS measurements of net hepatic glycogen content with magnetic resonance imaging (MRI) measurements of liver volume, rates of net hepatic glycogenolysis can be determined. The first accurate measurement on healthy young
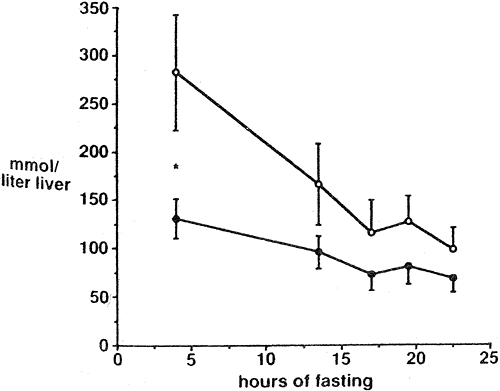
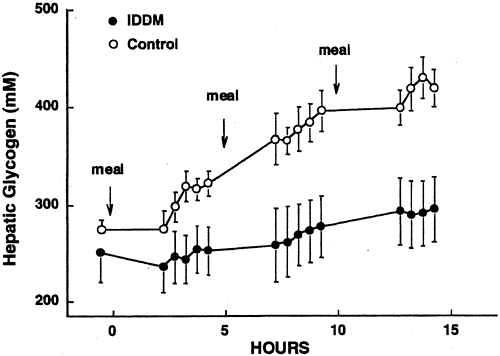
humans demonstrated a glycogen concentration of 251 ± 30 mmol/L of liver after an overnight 15-hour fast (6), and other studies with similar nutritional preparation have observed similar values (7). Subjects with poorly controlled type 2 diabetes (mean fasting blood glucose 14.6 mmol/L) studied after a longer overnight fast were observed to have a significantly lower hepatic glycogen concentration than age- and weight-matched nondiabetic controls (97 ± 18 vs. 169 ± 43 mmol/L) (Fig. 12.5) (8). In subjects with type 1 diabetes, under fairly poor control, fasting concentration of liver glycogen was only slightly lower than in matched nondiabetic subjects (Fig. 12.6) (9).
humans demonstrated a glycogen concentration of 251 ± 30 mmol/L of liver after an overnight 15-hour fast (6), and other studies with similar nutritional preparation have observed similar values (7). Subjects with poorly controlled type 2 diabetes (mean fasting blood glucose 14.6 mmol/L) studied after a longer overnight fast were observed to have a significantly lower hepatic glycogen concentration than age- and weight-matched nondiabetic controls (97 ± 18 vs. 169 ± 43 mmol/L) (Fig. 12.5) (8). In subjects with type 1 diabetes, under fairly poor control, fasting concentration of liver glycogen was only slightly lower than in matched nondiabetic subjects (Fig. 12.6) (9).
HEPATIC GLYCOGENOLYSIS
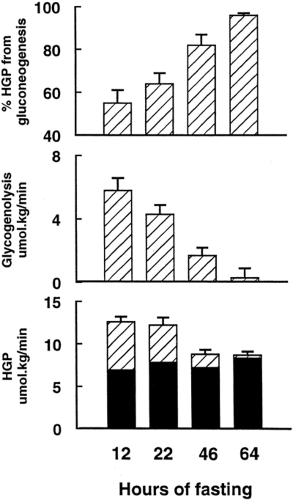
During the overnight period, the hepatic glycogen stores of healthy subjects decrease to around 60% of the level achieved 4 hours after the evening meal (7,9). Direct measurement in two separate groups of healthy subjects has demonstrated that hepatic glycogen concentration decreases in a linear fashion during the night at an average rate of about 6 μmol/kg body weight per minute (10,11). Higher rates of glycogenolysis were associated with higher initial hepatic concentrations of glycogen. In the overnight-fasted state, about 45% of the isotopically measured rate of whole body glucose production can be accounted for by net hepatic glycogenolysis (Fig. 12.7).
GLUCONEOGENESIS
Assessment of this process whereby the three-carbon substrates lactate, pyruvate, and glycerol are converted into glucose is beset with problems. Using hepatic venous catheterization to measure the uptake of gluconeogenic amino acids, pyruvate, and lactate across the splanchnic bed, Wahren et al. (12) estimated that the contribution of gluconeogenesis to total glucose production was only ∼20% during the first 12 to 14 hours of a fast. Consoli et al. (13,14) used [2-14C] acetate to calculate the 14C-specific activity of the precursor of glucose produced by gluconeogenesis (phosphoenolpyruvate) to estimate rates of hepatic gluconeogenesis and concluded that hepatic glycogenolysis accounted for 29% ± 2% of overall glucose production after an overnight fast. However, acetate is metabolized in extrahepatic tissues, invalidating this approach (12,15,16,17). Using [14C]lactate, Pimenta et al. (18) estimated that glycogenolysis (from glycogen synthesized by the direct pathway) accounted for ∼45.7% ± 4.7% and gluconeogenesis from lactate for a minimum of 18.6% ± 2.4% of overall hepatic glucose production. However, measurements of gluconeogenesis by the incorporation of label from [14C]lactate are complicated by the fact that the specific activity of intracellular lactate cannot be estimated from the specific activity of [14C]lactate in plasma (19).
Rates of gluconeogenesis can be calculated by combining 13C-NMR measurement of liver glycogen concentration with magnetic resonance imaging of liver volume and isotopic measurement of hepatic glucose production (HGP). Net hepatic glycogenolysis was determined by sequential measurement of hepatic glycogen concentrations by 13C-NMR, and rates of net hepatic glycogenolysis were calculated by multiplying this decrease in liver concentration over time by liver volume. Subtraction of these rates from rates of whole-glucose production determined by tracer turnover techniques yields rates of gluconeogenesis (6). Since the labeled carbon in position C6 of glucose is lost during carboxylation of pyruvate into oxaloacetate and during equilibration with dicarboxylic acids, contributions of glucose cycling between glucose and glucose-6-phosphate or
between fructose-6-phosphate and fructose-1,6-bisphosphate would not be included in the calculated rate of whole-body glucose production derived from this isotope (20). This approach, therefore, yields a minimum estimate for the rate of whole-body glucose production compared with [2-2H]glucose and [3-3H]glucose and a maximal estimate for the contribution of net hepatic glycogenolysis to the rate of whole body glucose production. Seven healthy volunteers were studied over a 68-hour period, starting with a 1,000-kcal liquid test meal at 5 p.m. Liver glycogen concentration fell from 396 ± 29 mmol/L at 4 hours following the meal to 251 ± 30 mmol/L at 15 hours and to 42 ± 9 mmol/L at 64 hours. Over the first 22 hours of fasting, the rate of decrease of liver glycogen concentration was linear at around 4 mmol/L per minute. After 22 hours of fasting, gluconeogenesis accounted for a mean of 64% of hepatic glucose output (Fig. 12.7).
between fructose-6-phosphate and fructose-1,6-bisphosphate would not be included in the calculated rate of whole-body glucose production derived from this isotope (20). This approach, therefore, yields a minimum estimate for the rate of whole-body glucose production compared with [2-2H]glucose and [3-3H]glucose and a maximal estimate for the contribution of net hepatic glycogenolysis to the rate of whole body glucose production. Seven healthy volunteers were studied over a 68-hour period, starting with a 1,000-kcal liquid test meal at 5 p.m. Liver glycogen concentration fell from 396 ± 29 mmol/L at 4 hours following the meal to 251 ± 30 mmol/L at 15 hours and to 42 ± 9 mmol/L at 64 hours. Over the first 22 hours of fasting, the rate of decrease of liver glycogen concentration was linear at around 4 mmol/L per minute. After 22 hours of fasting, gluconeogenesis accounted for a mean of 64% of hepatic glucose output (Fig. 12.7).
To estimate the maximum contribution of net hepatic glycogenolysis to whole-body glucose production earlier in the postabsorptive period, studies were performed 5 to 12 hours after the ingestion of a large evening meal. At this time, hepatic glycogen stores were found to be at their maximum daily level (9). [6,62H]Glucose was used for measuring rates of whole-body glucose production. Under these experimental conditions, net hepatic glycogenolysis contributed 43% ± 5% to whole-body glucose production during the first 12 hours after a meal. This is consistent with earlier NMR data and implies that gluconeogenesis typically contributes ∼50% to glucose production even under circumstances when hepatic glycogen stores are at their daily maximal concentration (21,22). This is significantly greater than previous estimates (12,13,18). This result has been confirmed by the more recently developed 2H2O method (23).
Because of the methodologic difficulties in measuring hepatic glycogen content in vivo, few other studies have directly examined the relative contributions of hepatic glycogenolysis to glucose production in humans. Nilsson and Hultman (24) measured hepatic glycogen concentrations by biopsy in nine subjects 12 hours into a fast and once again 4 hours later and found that the rate of net hepatic glycogenolysis was 288 ± 30 μmol/kg wet liver tissue per minute. This rate is ∼30% higher than the MRS-determined rate of 225 μmol/L liver per minute and might be explained by the stress response associated with needle biopsy. These workers, assuming that liver volume was 1.8 L, calculated that net hepatic glycogenolysis contributed ∼57% to 67% to the rate of whole-body glucose production (24). If the data of Nilsson and Hultman (24) are recalculated with a liver volume of 1.5 L, as found by NMR imaging, the contribution of net hepatic glycogenolysis would be 47% to 56% of the rate of whole-body glucose production, a figure similar to the findings by NMR spectroscopy.
ADAPTATION TO STARVATION
Since the glycogen stores in the liver are typically limited to approximately 70 g after an overnight fast, and glucose is utilized at a rate of approximately 7 to 10 g per hour, hepatic glycogen stores are largely dissipated early in the course of a prolonged fast (6). Thus, the initial phase of starvation is characterized by an increase in the relative contribution of gluconeogenesis to meet the ongoing demands for glucose by tissues (mainly from the central nervous system). The importance of glucose production from protein is reflected by an increase in urinary excretion of nitrogen in the early phase of starvation (25). During the first 24 hours of a fast, urinary excretion of nitrogen averages 4 to 7 g/m2 in the absence of nitrogen intake (26). This amounts to approximately 50 to 75 g of protein (∼1 g N/6.25 g protein) for the average 70-kg person. Similar results are obtained with isotopic tracer methods for estimating total-body rates of protein oxidation (27). Therefore, regardless of whether simple urinary nitrogen balance is measured or a tracer method is used, the results suggest that about 50 g of protein is oxidized in the 24 hours following a meal. Since the protein content of tissues does not exceed 20% by weight for any tissue, 50 to 75 g of protein translates into 250 to 375 g of tissue or the equivalent of 1% to 1.5% of lean body mass lost on the first day of a fast. In muscle, the release of alanine and other glycogenic amino acids increases in conjunction with an acceleration of proteolysis (27). At the same time, the rate of hepatic conversion of gluconeogenic amino acids into glucose is augmented (6). The increase in glucose synthesis from amino acids is not, however, due solely to increased availability of precursor, since plasma levels of alanine and other glycogenic amino acids decline (28). Taken together, these observations suggest that intrahepatic gluconeogenic mechanisms are stimulated as well, enhancing the efficiency of this process.
The major metabolic changes that occur during the first 60 hours of starvation have been quantified by a combination of MRS and isotopic methods (6,10). Figure 12.7 draws on data from two different studies. The whole-body utilization of glucose falls by 25% from the overnight-fasted state, and the proportion of HGP contributed by gluconeogenesis rises from 55% at 12 hours to 96% at 60 hours.
The metabolic adaptations in the early stages of starvation (namely increased gluconeogenesis, proteolysis, and lipolysis) coincide with and are orchestrated primarily by a decline in insulin secretion to below levels in the overnight fasted condition and by a modest increase in circulating levels of glucagon (6,29). Insulin deficiency promotes all aspects of the metabolic response, whereas the effect of glucagon is confined to the liver. Specifically, the decline in insulin promotes the breakdown of protein and fat and thus the delivery of gluconeogenic amino acids from muscle and glycerol from fat stores to the liver, whereas the activation of intrahepatic gluconeogenic processes is promoted by both the increase in glucagon and the decrease in insulin in the portal circulation. Hypoinsulinemia further contributes to glucose homeostasis by reducing glucose metabolism by extracerebral tissues (e.g., muscle) and by increasing the availability of free fatty acids for oxidative metabolism by muscle and liver and ketones for muscle and the central nervous system.
Stay updated, free articles. Join our Telegram channel

Full access? Get Clinical Tree


