Fig. 2.1
Lipoprotein size-density relationship. Lipid subclasses are present in a continuum of size and density, with an especially large gradient for the TG-rich lipoproteins IDL, VLDL, and chylomicrons. Technologies that sort by size (NMR and GGE) cannot separate IDL and Lp(a) from LDL-R, as these lipoproteins have overlapping sizes. IDL and Lp(a) differ by density; therefore, DGU is the best way to separate total LDL into its three components. Total LDL is made up of Lp(a), IDL, and real LDL or R-LDL. R-LDL is defined as total LDL-C minus Lp(a)-C minus IDL-C. Both Lp(a) and IDL are more atherogenic than LDL itself. Atherogenic remnant lipoproteins include IDL and VLDL3 (small/dense). These are elevated in MetSyn and T2DM and respond to low-carbohydrate diets. HDL2 is the more mature HDL subclass. HDL3 is less lipidated and smaller. The density range for IDL is 1.006–1.019 g/ml. Lp(a) and R-LDL are typically located in the density range of 1.019–1.063 g/ml. Lp(a) and small/dense LDL overlap in the density range of 1.050–1.063 g/ml. In addition, Lp(a) overlaps with IDL and large R-LDL when PAGGE is used, because of differences in electrophoretic mobility; however, Lp(a) size is actually 21–25 nm. Figure courtesy of Atherotech Labs, Inc., Birmingham, AL
Methods which sort lipoproteins by particle size (e.g., gradient gel electrophoresis (GGE) and nuclear magnetic resonance spectroscopy (NMR)) cannot separate IDL and Lp(a) from LDL as these subclasses have overlapping sizes. In contrast, differential particle density between LDL and Lp(a) allows separation of these related, but very different, lipoproteins by density gradient centrifugation (DGU) [60, 63].
Within each lipoprotein class, there is a wide range of lipoprotein sizes, related to considerable variability in the total cholesterol content of the particle [60, 88]. The fact that LDL-related lipoproteins vary substantially in size, density, and content of cholesterol and TG appears to explain much of the lack of precision in CVD risk estimation by the standard lipid panel, since it only provides the LDL-C concentration, and this is only as a rough calculation [63].
A key strategy to better estimate CVD risk is to focus on all atherogenic (apo B) particles. One parameter of this is non-HDL-C, which represents the total cholesterol content of VLDL, IDL, LDL, and Lp(a), and is a powerful predictor of CVD risk. Because there is one copy of apo B in each non-HDL particle, measurement of total plasma apo B, generally by immunoassay, directly reflects the total number of atherogenic particles. A third method is LDL particle number which can be calculated by NMR.
In a meta-analysis of clinical reports using LDL-C, non-HDL-C, and apo B as CVD markers, apo B was found to be the most reliable predictor of fatal or non-fatal ischemic cardiovascular events [115]. The mean relative risk ratio for apo B was 12 % greater than for LDL-C and 6 % higher than for non-HDL-C. Thus, over a 10-year period, an apo B-based strategy for evaluating and treating excess CVD risk might be estimated to prevent 500,000 more CVD events than a non-HDL-C strategy, while a non-HDL-C-based strategy might prevent 300,000 more CVD events than one based on calculated LDL-C alone.
In some clinical studies, the LDL particle number calculated as above by NMR has demonstrated a stronger correlation with CVD risk than has LDL-C. For example, in the Multi-Ethnic Study of Atherosclerosis (MESA), a lipoprotein subclass analysis in over 5,500 apparently healthy adults found a significant correlation between higher numbers of total or small LDL particles and increased carotid intima-media thickness (CIMT), a CVD risk factor [86]. By contrast, higher concentrations of total or large HDL particles were inversely correlated with CIMT. LDL particle subclasses remained significantly associated with CIMT after adjustment for both LDL-C and traditional lipids. LDL-C was also independently associated with worsened CIMT. However, there was no significant additional contribution of LDL-C to CIMT once the two LDL subclasses (large and small LDL particles) were included in the model. In the subgroup of participants with diabetes, both large and small LDL particle concentrations were significantly associated with CIMT.
The particle-size distribution of LDL varies significantly according to genetic factors and correlates inversely with CVD risk [60]. The predominance of larger, more buoyant LDL particles is termed Pattern A and suggests lower CVD risk. In contrast, Pattern B is typified by higher relative concentrations of small, dense LDL, which increases CVD risk by as much as fourfold, compared to Pattern A. Pattern A/B is the term for intermediate LDL particle size and it may roughly double CVD risk. In light of these differences in risk and the differing underlying pathophysiology of these patterns, it is suggested that each pattern warrants different therapeutic strategies [60].
In the process of lipolysis of TG from TG-rich lipoproteins, the core of the lipoproteins shrinks and the resulting smaller lipoproteins are called “remnants.” Remnant lipoproteins tend to be more atherogenic than their parent lipoprotein. VLDL remnant particles include VLDL3 and IDL. Levels of these VLDL remnant lipoproteins are elevated in patients with the metabolic syndrome (MetSyn) or IR/T2DM, and this elevation can be reduced with a diet low in total carbohydrate and especially in sugar content [50]. Interestingly, the IDL remnant particles may be more atherogenic, on a per particle basis, than is LDL, and it may be lowered less efficiently by statin treatment than are LDL levels. Lp(a) also seems especially atherogenic with a strong genetic influence and does not respond well to statin therapy [31, 107]. Elevated levels of IDL and Lp(a) usually can be lowered by niacin treatment [9], though whether this impacts risk for CVD events is as yet not established.
Lp(a) appears to consist of an LDL particle, to which has been added a large glycoprotein termed apo(a), attached to the apo B by a covalent bond. Apo(a) has a constant region and a variable region in which a peculiar secondary “loop” structure, termed a “kringle” due to its resemblance to a Dutch pastry by the same name, is repeated a variable number of times. Significant elevations of Lp(a) levels may double CVD risk in isolation [109], and when present concomitantly with elevated concentrations of small, dense LDL, CVD risk may jump by 25-fold [91]. Unfortunately, measurement of Lp(a) by the traditional protein assay may lack accuracy due to sensitivity of immunoassay kits to the number of kringle repeats in apo(a) [77]. Lp(a) can also be quantified by measurement of its cholesterol content by DGUC. Although this parameter of Lp(a) concentration is not the traditional one, there is evidence that it may be more reproducible than that of Lp(a) protein by immunoassay.
Among the major HDL subfractions, HDL2, the larger subspecies, has been reported to be the more atheroprotective HDL subfraction [129], whereas HDL3 has been reported to be less protective or even neutral in its relationship to CVD [8]. The opposite, however, has also been reported. Curiously, there appears to be heterogeneity in HDL subfraction effects among interventions which raise total HDL levels. For example, exercise [14] and niacin may raise HDL2 more than HDL3, whereas some but not all studies [128] [83] have suggested the opposite pattern of size-specific increase with ethanol and fibrates.
LDL Subclasses
Quantification of LDL particle subclasses by NMR indicates a significantly stronger predictive value for the incidence of CVD events or disease progression than LDL-C [10, 65, 75, 95, 104, 107]. This association appeared to be independent of the standard lipid panel values. In one representative study, determination of LDL particle concentration and size by NMR found that particle concentration was a predictor of future CVD events in overtly healthy middle-aged women [10]. In general, the magnitude of LDL-particle predictive value was similar to that associated with standard lipid measurements, but less than the predictive value of measuring the inflammatory biomarker C-reactive protein (CRP).
In the Women’s Health Study of middle-aged women with no history of CVD or cancer, LDL particle concentration was the best lipoprotein predictor of incident CVD events and stroke and was more strongly related to these outcomes than was apo B [10]. The Quebec Cardiovascular Study found that the combination of IR/diabetes, elevated small dense LDL-C, and elevated apo B synergistically confers a 20-fold increased risk for CVD events [122]. Tempering this viewpoint are studies where adjustment for the number of LDL particles (apo B or LDL particle concentration) attenuated the relationship between a predominance of small, dense LDL and atherosclerotic CVD [10, 49, 55, 65, 95, 105, 123]. Thus, the question of whether or not apo B-containing lipoproteins can develop a steep-enough gradient of atherogenicity across subtypes to achieve clinical relevance remains controversial. However, epidemiologic and clinical intervention trials have clearly demonstrated a stronger correlation with apo B concentration and subsequent CVD events than for LDL-C values and CVD events [114].
Small, dense LDL particles comprise an important component of the Pattern B pathophysiology associated with obesity, the MetSyn, and IR/DM (characterized by high TG, low HDL-C, and increased LDL particle number) [4, 12, 58, 84, 102]. Individuals with smaller average LDL size (18–21 nm) are more likely to present with IR and the metabolic syndrome and are at an increased risk for developing T2DM [33, 39, 40, 58].
Other predictive variables, such as higher concentrations of TG-rich lipoproteins or reduced HDL-C, might need to be considered. For example, Maki et al. [76] reported a significant association between progressive increases in carotid intima-media thickness (CIMT), a surrogate marker of early-stage atherosclerosis, and increased cholesterol in TG-rich lipoproteins and denser LDL lipoprotein subclasses, coupled with lower HDL-C concentrations, in normoglycemic adults at moderate risk for coronary heart disease (CHD). Further, epidemiology studies have consistently supported a stronger role for non-HDL-C in predicting subsequent CVD events than for LDL-C, independent of elevated TG concentrations [12, 26, 52, 72, 99].
Triglyceride-Rich Lipoproteins
Increased cholesterol carried by TG-rich lipoproteins (VLDL, IDL, chylomicrons) is highly atherogenic and a prominent component of the IR/DM dyslipidemia phenotype linked to increased CVD risk [88]. Metabolic syndrome (MetSyn) or IR/T2DM dyslipidemia is characterized not only by high TG and low HDL-C concentrations but also by increases in the size of VLDL particles and decreases in the size of LDL and HDL [39, 125]. Larger VLDL lipoproteins/particles are strongly associated with TG, IR, and the MetSyn [39, 58]. High concentrations are defined as more than 5 nmol/L (>75th percentile in MESA) and confer an increased risk for developing T2DM [88]. In addition, VLDL-C correlates strongly with concentrations of TG-rich remnant particles [88]. An alternate view suggests that the superiority of non-HDL-C as a CVD predictor results from the association between non-HDL-C and LDL particle number, rather than from the atherogenicity of TG-rich lipoprotein remnants [25, 96]. This theory is based on the finding of elevated levels of small, dense LDL particles in individuals with hypertriglyceridemia, resulting in higher-than-expected LDL particle concentrations than predicted from LDL-C concentrations.
HDL Subclasses
High concentrations of HDL-C are now firmly established as a beneficial condition that lowers CVD risk, and most published reports attribute the cardioprotective properties of HDL to HDL2 [88, 129]. Reduced concentrations of HDL lipoprotein subclasses are a prominent component of the IR/diabetic/MetSyn dyslipidemia phenotype linked to increased CVD risk [39, 58]. Among subjects in the MESA trial not treated with lipid-lowering medication, total HDL particle number was more strongly associated with carotid atherosclerosis than was HDL-C [86]. In the Pravastatin Limitation of Atherosclerosis in the Coronary Arteries (PLAC-I) statin intervention trial, a key finding was the negative association between progression of coronary artery disease and high levels of smaller HDL particle subclasses [104]. This correlation was independent of total HDL-C concentrations. In contrast, in the Veterans Affairs HDL Intervention Trial VAHIT total and small HDL particle numbers were independent predictors of recurrent CVD events [95].
In a representative group of prospective studies examining the relationship of HDL-C subclasses to CHD events, risk was significantly associated with both HDL2-C and HDL3-C in five studies [38, 68, 106, 111, 118], with HDL2-C but not HDL3-C in one study [67] and with HDL3-C but not HDL2-C in one study [124]. In another study, HDL-C, HDL2-C, and HDL3-C concentrations were all inversely associated with CIMT progression, which agreed with results reported previously for traditional HDL-C measurements [76]. The results were similar however for total HDL-C, HDL2-C, and HDL3-C. All three values correlated with CIMT progression; however, HDL-C, HDL2, and HDL3 were not superior in their prediction of CIMT progression.
In one of the longest prospective studies to examine the relationship between lipoprotein subclasses and coronary heart disease (CHD), 1,905 men from the Livermore Radiation Laboratory were followed for 29 [130] and 53 years [129]. Between 1954 and 1957, lipoprotein mass concentrations were determined using an analytic ultracentrifugation technique [43]. At the 10-year follow-up, the 38 men who developed clinical ischemic heart disease had significantly lower HDL2 (32 %), lower HDL3 (8 %), higher LDL (13 %), higher IDL (23 %), and higher small VLDL (21 %) mass compared to the total sample population. At the 29-year follow-up, 179 CHD deaths, 182 nonfatal myocardial infarctions, and 93 revascularization procedures were confirmed in 97 % of the cohort [130]. Total incident CHD was inversely related to HDL2 and HDL3 mass and concordantly related to LDL mass, IDL mass, and small and large VLDL mass concentrations, after adjustment for age. The lowest quartiles of both HDL2 mass and HDL3 mass independently predicted total incident CHD. Risk for premature CHD (≤65 years old) was significantly greater in men within the lowest HDL2 and HDL3 quartiles plus high LDL mass concentrations. At the 53-year follow-up, the risk associated with the lowest HDL2 quartile increased significantly by 22 % for all-cause mortality, 63 % for total CHD, and 117 % for premature CHD mortality, when adjusted for age [129]. When adjusted for standard risk factors (age, total cholesterol, blood pressure, BMI, smoking) and the lowest HDL3-quartile, the corresponding risk increases were 14, 38, and 62 %, respectively. Men with HDL3 less than or equal to the 25th percentile had 28 % greater total CHD risk and 71 % greater risk of premature CHD risk. Higher LDL mass concentrations significantly increased total CHD risk by 3.8 % and premature CHD risk by 6.1 % for each 10 mg/dL rise in concentration. Thus, data from the first study to demonstrate an association between HDL subclasses and CVD risk support the conclusion that lower concentrations of the more buoyant HDL2 particle, and to a lesser extent HDL3, are associated with increased CVD risk. LDL mass as expected predicted risk; however, TG-rich lipoproteins and subclasses also were powerful predictors. Although still controversial, some investigations suggest that HDL2 particles may offer greater cardioprotective effects than HDL3 [34], though this is now questioned and being actively re-evaluated.
Techniques for Measuring Lipoprotein Subclasses
There are several methods available to measure apolipoproteins and lipoprotein subclasses, including chemical analysis and immunoassays, gel electrophoresis (polyacrylamide gradient gel electrophoresis (PAGGE) or GGE), nuclear magnetic resonance (NMR), and density gradient ultracentrifugation (DGU) [11, 29, 41, 42, 56, 63]. The most common method is the standard lipid panel performed using automated chemistry analyzers. This method involves independent measurements of total cholesterol, HDL-C, and TG. LDL is estimated using the Friedewald equation [36].
[FLDL-C] = [Total Cholesterol] − [HDL-C] −[TG/5]
In the Friedewald relationship, the IDL and Lp(a) components of LDL are assumed to be 20 % of the TG concentration. This underscores the importance of obtaining a fasting TG measurement, because the elevated TG levels found postprandially can cause false-low estimation of Friedewald-calculated LDL (FLDL-C). For patients with TG >400 mg/dL, a direct LDL measurement should be performed to avoid this problem [78]. In reality, directly measuring LDL levels eliminates Friedewald equation inaccuracies caused by higher levels of TG and TG-rich lipoproteins. FLDL-C levels do not correlate well with direct LDL levels in patients with diabetes or coronary or other atherosclerotic diseases [110], because many of these patients have high levels of TG-rich lipoproteins even with near-normal TG concentrations, the classic hallmark of an atherogenic lipoprotein profile.
Lipoprotein subclasses can be measured in many cases by direct measurement on chemistry analyzers, but measurements of multiple subclasses by this method is expensive and all subclasses are not captured. Techniques that can measure multiple lipoprotein subclasses simultaneously have been reviewed and compared [123]. PAGGE/GGE, NMR, and DGU represent widely used, practical options that simultaneously measure all lipoprotein subclasses.
Gradient and Modified Nongradient Gel Electrophoresis
Because of the laborious nature of the original DGU technique (described below), other methods were developed to separate and measure lipoproteins and their subclasses based on physical properties, such as size. One of these techniques is nondenaturing gradient gel electrophoresis (PAGGE or GGE). Size separation of lipoproteins is accomplished by using polyacrylamide gradient gels (2–16 % cross-linking) in which the gel layers have decreasing pore size due to the increasing cross-linking of the polyacrylamide gel. Smaller size lipoprotein particles travel farther in the gel matrix while movement of larger lipoprotein particles is inhibited. Migration distance under these conditions is inversely related to particle diameter. Also, increasing electrophoresis time from 24 to 30 h does not significantly affect the relative mobility (separation) of the LDL peaks. The standard deviation of results typically range from 0.2 to 0.28 nm (CV < 1.0 %).
After the electrophoresis step is completed, the gels are removed from the holder and stained with one of a number of dyes (Coomassie Brilliant blue R-250 for protein detection, Sudan Black or Oil Red O for lipid detection) to reveal the shape and size of the separated lipoprotein fractions. Lipoprotein particle size is roughly inversely proportional to the particle density. The amount of the lipoprotein in each stained fraction is determined through the use of a densitometer, and a computer deconvolution program is used to convert the color density of each peak into a lipid concentration (mg/dL). Typical LDL profiles for Pattern A and B individuals are shown in Fig. 2.2.
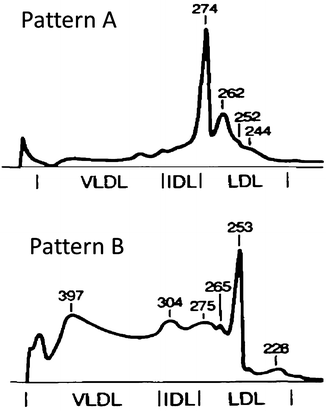
Fig. 2.2
Representative LDL subclass analyses generated using PAGGE/GGE. The black profile lines are representative of the optical density of the gels containing the stained lipoproteins. These profiles are deconvoluted to yield the concentration of the individual LDL lipid subclasses. The Pattern A profile shows a predominance of large buoyant LDl particles skewing to the right with an absence of IDL or VLDL particles. The Pattern B profile with peak particle diameters less than 255 Å and the pattern skewed to the left with large amounts of IDl and VLDL particles. This lipid profile is for a patient with an atherogenic phenotype. Two gradient gels are necessary to size separate all lipoproteins (HDL and non-HDL). Reprinted with permission from Austin [4]
Application of this technique reveals multiple bands within the total LDL fraction of different subjects. The range of particle diameters comprised by LDL separated by this method is 21.8–27.8 nm, corresponding closely to the ranges determined by negative-staining electron microscopy [112]. Sodium dodecyl sulfate (SDS) polyacrylamide gel electrophoresis of the above fractions reveals only apo B. Importantly, similar-size lipoproteins separated by PAGGE/GGE have heterogeneous densities, while similar-density lipoproteins separated by DGU display multiple-size heterogeneity. Therefore, the output from these two techniques is complementary, but not necessarily identical [17]. One example of the use of PAGGE/GGE to characterize lipoprotein subclasses within a large population was reported for the Quebec Heart Study [121, 122]. Cholesterol in small, dense LDL (<25.5 nm) conferred a risk of four- to six-fold greater risk of ischemic heart disease than did cholesterol located within larger, more buoyant LDL particles.
Nuclear Magnetic Resonance Spectroscopy
Both the PAGGE/GGE and DGU techniques rely on a physical separation of the lipoproteins, either by density or by size, before cholesterol analysis. Another method has been developed using nuclear magnetic resonance spectroscopy (NMR) to estimate lipoprotein particle number, size, and concentration without a separation step [92, 93]. This technique provides quantitative measurement of size fractions throughout the lipoprotein particle spectrum.
Lipoprotein particles are composed of an apoprotein and a mixture of cholesterol, phospholipids, cholesteryl esters, and triglycerides [56, 94]. The aggregate number of terminal methyl groups of these lipids yields a set of characteristic resonance signals over a defined part of the NMR spectrum. NMR uses these characteristic signals broadcast by lipoprotein subclasses of different sizes. Each subclass of VLDL, LDL, and HDL has a distinct spectral pattern, or a bulk particle signal, that is slightly shifted due to the different sizes of the VLDL, LDL, and HDL particles. This signal envelope contains the signals emitted by the terminal methyl group protons of the four types of lipid in the lipoprotein particles: phospholipid, unesterified cholesterol, cholesteryl ester, and triglyceride [56]. Each lipoprotein subclass signal emanates from the aggregate number of terminal methyl groups on the lipids contained within the particle, with the cholesteryl esters and triglycerides in the particle core each contributing three methyl groups, and the phospholipids and unesterified cholesterol in the surface shell each contributing two methyl groups. Because the methyl signals from these lipids are indistinguishable from each other, they overlap to produce a bulk lipid particle signal. The amplitude of each lipoprotein subclass signal serves as a measure of the particle concentration of that subclass. The measured amplitudes of lipoprotein subclass NMR signals are directly proportional to the number of particles emitting the signal, even when the amount of lipid or protein per particle varies from person to person. As a result, NMR-derived lipoprotein concentrations may differ from those measured by traditional methods. That said, studies of split samples have demonstrated good agreement between LDL and HDL particle sizes measured by NMR and GGE [47].
NMR spectra are recorded using a dedicated spectrometer over approximately 1 min and then computer deconvolution of the magnetic resonance signal generates a profile of the component lipoprotein particles corresponding to various sizes and concentrations [56]. The only specimens for which freezing may adversely affect NMR results are postprandial samples or samples with fasting triglyceride values greater than approximately 300 mg/dL. Freezing these samples may alter (lower) chylomicron and VLDL subclass concentrations. A representative spectral profile is shown in Fig. 2.3.
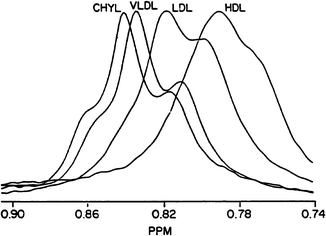
Fig. 2.3
Lipoprotein components separated by nuclear magnetic resonance spectroscopy (NMR). Represented are the magnetic resonances of the methyl groups of cholesterol, phospholipids, cholesteryl esters, and triglycerides contained in the different classes of lipoproteins. The terminal methyl groups of the lipids yield a set of characteristic resonance signals over a defined part of the NMR spectrum. Because the methyl signals from these lipids are indistinguishable from each other, they overlap to produce a bulk lipid particle signal. Each subclass of VLDL, LDL, and HDL has a distinct spectral pattern that is slightly shifted due to the different sizes of the VLDL, LDL, and HDL particles. These signals are deconvoluted to yield both the size and concentration of lipoprotein subclass particle. Reprinted with permission from Otvos [93]
The use of NMR to quantify lipoprotein subclasses has some limitations [2]. When the proton-NMR spectra of 11 lipoprotein subclasses were recorded at physiological temperature, the methyl resonance region commonly used for lipoprotein analyses showed considerable overlap for all lipoprotein subclasses, with an intense distorted triplet-like signal at approximately 0.85 ppm and some cholesterol backbone-related resonances. The average relative errors of the quantifications denote noteworthy differences in the capability of the partial least squares analyses of the spectra to uncover the subclass-specific signal areas. The VLDL and HDL3 subclasses give the most accurate results, with considerably less accurate results for the HDL2, IDL, and the smaller LDL particles. At all noise levels there is an approximately ten-fold difference in the quantification accuracy between the most and least accurate (LDLl) values.
The similarity of the methyl signals, particularly for the LDL and HDL2 subclasses, and the small-sized differences within the LDL subclasses make the decreased quantification accuracy for the IDL, LDL, and HDL2 subclasses understandable. No explanation is apparent for why the accuracy for the LDL2 and LDL3 quantification appears to be three times better than that for the LDLl.
Exemplifying the use of NMR spectroscopy was a report by Freedman et al. [35] based on the Framingham Study, a large community-based epidemiology study spanning decades. There is a gender differential in CHD risk that narrows with advancing age. Freedman et al. [35] investigated the possible influence of lipoprotein subclasses on this phenomenon by measuring lipoprotein particle sizes and concentrations using NMR. They analyzed plasma samples from 1,692 female and 1,574 male participants in the Framingham Offspring Study. When adjusted for age and lipid concentration, women had a lipoprotein subclass profile suggestive of lower CVD risk, consisting of significantly lower concentrations of small LDL particles (median 209 vs. 367 nmol/L) and higher concentrations of large HDL particles (median 8 vs. 3 μmol/L). In addition, women had fewer small LDL particles ≤20.5 nm (11 % vs. 34 % nm) and larger HDL particles (mean 9.4 vs. 8.9 nm). This sex difference is similar to that observed for a GGE-measured LDL peak particle diameter of <25.5 nm (Pattern B) [35]. The female/male difference in HDL particle size decreased with age. There is no proffered evidence that this supports the change in CVD risk as a function of age. Surprisingly, the increased LDL-C concentration found in older women was attributable to higher concentrations of intermediate and large LDL particles, rather than small LDL particles. Despite the gender advantage in CVD risk at younger ages for women in the general population, women with diabetes have slightly greater CVD risk and mortality from myocardial infarctions than do men with diabetes [103], highlighting the dysregulation diabetes introduces into lipid metabolism.
From an analytical perspective, the NMR method used in the Freedman et al. [35] study had several advantages over classical electrophoresis or ultracentrifugation. By avoiding the need for physical fractionation of lipoprotein subclasses, which traditionally required hours-to-days and achieved only partial resolution of lipoprotein subclasses, NMR reduced fractionation to minutes and was completely automated. It also eliminated sources of analytical variability inherent in older separation procedures. In addition, NMR provides a direct measure of lipoprotein subclass particle concentrations, rather than basing quantification on the amount of cholesterol contained within lipoprotein particles or the relative degree of lipid-to-protein staining of separated particles. Counterbalancing these advantages were the measurement variability inherent in NMR determinations and the requirement for expensive equipment and a high level of technical expertise to perform this technique.
Density Gradient Centrifugation
Some of the earliest reports on quantitation of plasma lipoproteins were based on the techniques of analytical and preparative ultracentrifugation [70]. Analytic ultracentrifugation was applied in the 1950s to the separations of lipoproteins by their rates of migration in an intense centrifugal field and remained in use through the end of the twentieth century [130]. It was the gold standard against which other techniques were calibrated [54, 71]. Differences in the density of lipoprotein class and subclasses in salt solutions (1.063 g/mL) cause different rates of separation, termed Svedberg flotation (S f) rates, for VLDL, IDL, LDL, and HDL lipoproteins subclasses [29, 41–43, 62]. DGU flotation rates are controlled by the size, shape, and hydrated density of the particles. Major subclasses within LDL were defined as S f 12–20 (IDL) and S f 0–12; these are the components of total cholesterol that contribute to the standard LDL-C measurement. The HDL fraction is composed of three major subclasses: F 1.2 0–3.5 (HDL3), F 1.2 3.5–9 (HDL2), and F 1.2 9–20 (HDL1). Analytical ultracentrifugation data from small healthy populations could be grouped into subpopulations with common characteristics. One subgroup had levels of small, dense LDL (Sf 0–7) that were positively correlated with VLDL and inversely correlated with HDL2. Other subgroups had larger, more buoyant LDL (S f 7–12) and showed the opposite relationships with VLDL and HDL2. The gold standard method for LDL-C and HDL-C quantitation (beta quantitation) recommended by the US Centers for Disease Control (CDC) and the National Cholesterol Education Program (NCEP) is based on DGU [7].
The original DGU technique was used to demonstrate a predictive relationship between lipoproteins and their subclasses and the subsequent development of cardiovascular and coronary heart disease in large population studies, such as the Framingham Heart Study and the Lawrence Livermore Study [57, 129]. The Framingham Study was the first to show the relationship of total cholesterol and LDL to heart disease. Further, in a 53-year follow-up of the Lawrence Livermore Study, the protective effect of high concentrations of HDL2 was demonstrated.
More recently, the DGU technique has been refined by applying vertical spin ultracentrifugation (Vertical Auto Profile® [VAP] Atherotech Inc, Birmingham, AL) [63]. The original DGU technique is extremely time consuming (days) and required a laborious manual separation of the lipoprotein subclass fractions, followed by an enzymatic cholesterol assay. The VAP technique uses a salt density gradient to separate the lipids in a diluted serum sample. The gradient is subjected to a single, vertical spin, density gradient ultracentrifugation. Unlike most preparative ultracentrifugation methods, the vertical spin method separates all lipoproteins in less than 1 h. The separated lipoprotein classes are then continuously drained from the bottom of the centrifuge tube into the VAP continuous flow analyzer where they sequentially react with a cholesterol-specific enzymatic reagent producing a cholesterol concentration-dependent lipoprotein absorbance profile monitored by a spectrophotometer. The digital output from the spectrophotometer is collected electronically, and the resulting absorbance curve is deconvoluted to quantify individual lipoprotein classes and their respective subclasses using in-house developed software. This technique simultaneously measures cholesterol concentrations of all five lipoprotein classes: HDL, LDL1-4 (LDL without Lp(a) and IDL), IDL, Lp(a), and VLDL and their respective lipoprotein subclasses (HDL2, HDL3; LDL1, LDL2, LDL3, LDL4; VLDL1 + 2, VLDL3) [21, 22]. LDL is directly measured, not calculated as in the standard lipid panel, therefore non-fasting samples can be used for LDL determinations. Lipid subfractionation reveals the direct underlying pathophysiology of the dyslipidemia and may better suggest targeted treatment strategies or response to treatment.
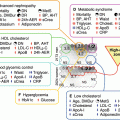
A normal (Pattern A) cholesterol lipoprotein profile from the DGU VAP technique shows the relatively dense HDL separated from the lighter LDL fraction and the very light VLDL fraction (Fig. 2.4a). In sharp contrast, Fig. 2.4b shows the atherogenic phenotype typical of Pattern B in a T2DM patient with poor glycemic control. The LDL level is high and the peak is shifted to the left (more small, dense LDL). The amount of remnant lipoproteins (IDL and VLDL3) is highly elevated as well as that whole VLDL level. Further, as shown in Fig. 2.4c, lipoprotein abnormalities remain in T2DM patients even after restoration of glycemic control. An example of a patient (Fig. 2.4d) with high Lp(a) and normal LDL levels is illustrative of lipoprotein abnormalities that can be missed with the standard lipid panel.
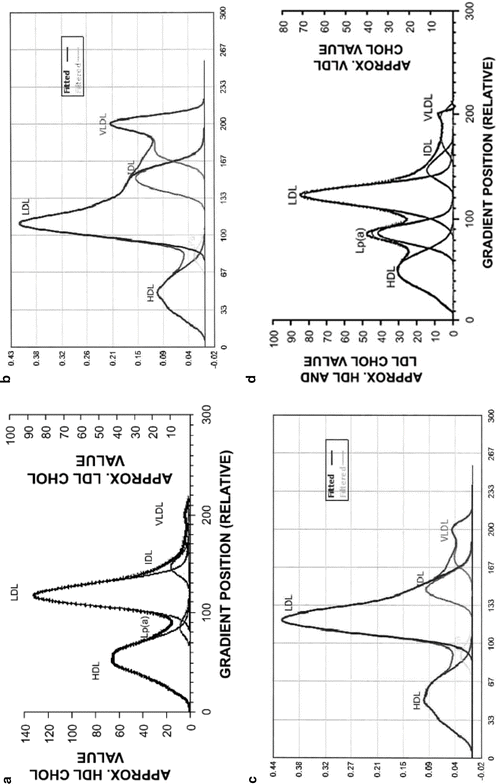
Fig. 2.4
Representative lipoprotein subclass spectrum generated using the DGU VAP technique. (a) Pattern A profile from a healthy adult with no insulin resistance. The x-axis represents decreasing density. The lipoproteins separate from denser (HDL) to lighter (VLDL). The cholesterol profile (dashed line) is deconvoluted to yield the individual lipoprotein classes and subclasses (solid lines). The relative amounts of HDL, Lp(a), LDL, IDL, and VLDL and position of the LDL peak indicate that this is a normal lipid profile (Pattern A). (b) Pattern B profile from a T2DM patient with poor glycemic control (HbA1c 11.0 %; fasting plasma glucose 302 mg/dL). Note the elevated levels of TG, IDL, VLDL, and VLDL3. The HDL, LDL, IDL, and VLDL levels are 40, 145, 36, and 68 mg/dL, respectively; TG 443 mg/dL. The relative shift of the LDL peak compared to the LDL peak indicates small, dense LDL Pattern B. The large IDL and VLDL peaks indicate large amounts of remnant atherogenic lipoproteins. (c) Profile from a T2DM patient with excellent glycemic control (HbA1c 5.8 %; fasting plasma glucose 121 mg/dL). Lipoprotein abnormalities remain even after amelioration of hyperglycemia. The LDL peak is shifted towards the HDL peak and indicates that small, dense LDL is still present. The IDL and VLDL peaks are smaller, but indicate remnant atherogenic lipoproteins are present. The HDL, LDL, IDL, and VLDL levels are 45, 121, 22, and 25 mg/dL, respectively. (d) Profile from a T2DM patient with a normal standard lipid panel, but high levels of Lp(a) when analyzed by DGU (HbA1c 7.2 %; fasting plasma glucose 110 mg/dL). The large peak between the HDL and LDL peaks is the small dense Lp(a) peak. Figures courtesy of Atherotech Labs, Inc., Birmingham, AL
In summary, the great majority of patients with MetSyn/IR and T2DM show the classic atherogenic lipoprotein profile that is distinguished by a relatively small HDL peak, an LDL peak which may be of relatively normal size, and the presence of elevated levels of TG-rich IDL and VLDL.
Clinical Evaluation of Lipoprotein Subclasses in the Insulin-Resistant/Diabetic Population
Correlation with IR/DM or MetSyn
Table 2.1 summarizes key findings from clinical investigations correlating specific changes in lipoprotein subclasses with the MetSyn and IR/DM. Higher LDL particle concentration and small, dense LDL particles, but not LDL-C, were strongly associated with MetSyn in the Framingham Heart Study [58]. Similar results were found in individuals with a wide range of insulin sensitivity/resistance and overt T2DM in the report from Garvey et al. [39]. The strongest relationships with IR/DM were found for large HDL particles (negative), large VLDL particles (positive), total LDL particles (positive), and small LDL particles (positive). Of note, no correlation was found between LDL-C concentration and the degree of insulin sensitivity or resistance. Similar strong subclass associations were found in IR/T2DM subjects in the Insulin Resistance Atherosclerosis Study (IRAS) [33, 40]. Of special interest, high concentrations of large VLDL particles and small HDL particle size predicted diabetes, independent of lipid values and insulin sensitivity. Echoing this finding, a preponderance of large VLDL particles and small HDL particles was selected in stepwise regression as predictors of T2DM in the Melbourne Collaborative Cohort Study [51]. TG concentrations were the only conventional lipid measure that predicted T2DM in a stepwise model that included total cholesterol, HDL-C, LDL-C, and TG. Thus, atherogenic lipoprotein abnormalities are a hallmark of adults who subsequently develop T2DM.
Table 2.1
Overview of epidemiology investigations examining lipoprotein subclasses in patients with IR/DM or the metabolic syndrome (MetSyn)
Publication | Trial name | N | Pop studied | Race (country) | Major findings | Subclass technique |
|---|---|---|---|---|---|---|
Alabakovska [1] | NA | 30 vs. 100 | T1DM vs. NoHG children | NG (Macedonia) | T1DM children had lower HDL-C; 88.5 % had Pattern B dyslipidemia vs. 11 % in healthy children (P < 0.0001). Mean LDL lipoprotein size was 24.6 vs. 26.4 nm, respectively (P < 0.0001). LDL size in T1DM inversely correlated with TG (P < 0.05); positively correlated with HDL-C (P < 0.05) | PAGGE |
Austin [6] | NA | 204 | IR, elderly adults | Finish (Finland) | At 3.5-year follow-up, this study was first to demonstrate that a predominance of small LDL is a risk factor for the future development of T2DM (twofold greater risk), independent of age, gender, IR, and BMI; not independent of fasting insulin or TG concentrations. An increase of 5 Å in LDL diameter was associated with a 16 % decrease in risk of T2DM | PAGGE |
Chu [20] | NA | 21 vs. 23 | IR vs. NoHG adults | NG (US) | IR was associated with lower concentrations of HDL2 (P < 0.001) and HDL3 (P < 0.001); higher TG concentrations (P < 0.01); higher concentrations of all TG-rich lipoprotein classes, including IDL (P < 0.02); large, buoyant TG-rich VLDL1 + 2 (P < 0.01); and small, dense cholesterol-rich VLDL3a + 3b (P < 0.001). Although LDL-C appeared to be higher in the IR individuals (3.44 vs. 3.24 mmol/L; P < 0.39), this effect was partially attributable to the effects of a significantly higher IDL (0.49 vs. 0.39 mmol/L; P < 0.02) in the setting of almost identical Lp(a) (0.19 vs. 0.18 mmol/L; P < 0.85). IR was associated with a small, dense LDL lipoprotein (P < 0.001). A higher proportion of IR individuals had LDL Pattern B (P < 0.001) | DGU |
Feingold [32] | NA | 29 vs. 87 | T2DM vs. NoHG male adults | NG (US) | T2DM associated with increased prevalence of LDL lipoprotein subclass Pattern B: 52 % vs. 24 % in NoHG (P < 0.025). Clearance of TG-rich lipoproteins delayed in Pattern B vs. A in T2DM patients (mean 25 vs. 14 min; P < 0.01) | PAGGE |
Festa [33] | Insulin Resistance Atherosclerosis Study (IRAS) | 513 vs. 830 | IR/T2DM vs. NoHG adults | Caucasian, Black, Hispanic (US) | VLDL particle size and small HDL particle number predicted diabetes, independent of lipids and insulin sensitivity or resistance. The relation of both VLDL size and small HDL to incident diabetes was largely independent of glucose tolerance status at baseline, waist circumference, TG, and HDL-C. There was a linear increase in the incidence of diabetes across quartiles of VLDL size and to a lesser extent across quartiles of small HDL particle concentrations. Insulin sensitivity attenuated the relation to incident diabetes of VLDL size, but not of small HDL particles | NMR |
Friedlander [37] | Jerusalem Diabetes Prevalence Study | 390 | IR/T2DM vs. NoHG adults | Mixed (Israel) | Confirmed high TG, low HDL-C, fasting and postprandial insulin levels significantly associated with LDL lipoprotein subclass phenotypes. LDL-C, HDL-C, and TG were independently associated with LDL lipoprotein size. The addition of IR (insulinemia) and glucose concentration had no independent effects on LDL size. However, on a background of elevated LDL-C and IR, mean LDL size was lower. The association of IR and LDL size is not mediated directly through the level of insulinemia, but via alterations in lipid metabolism | PAGGE |
Garvey [39] | NA | 46/46 vs. 56 | IR, T2DM vs. NoHG adults | 66 % Caucasian (US) | Lipid panel: IS vs. IR, only TG difference achieved statistical significance, elevated in IR (P < 0.03); IS vs. DM, total cholesterol, LDL-C, and TG elevated in DM (all P < 0.05). Subclass masses by NMR: IS vs. IR, total and large VLDL, total and small LDL elevated in IR (all P < 0.05), large HDL lower in IR (P < 0.05); IS vs. DM, total and large VLDL, total, intermediate, and small LDL, small HDL elevated in DM (all P < 0.05); large LDL, total and large HDL lower in DM (all P < 0.05) | NMR |
Goff [40] | Insulin Resistance Atherosclerosis Study (IRAS) | 1,371 | IR/T2DM vs. NoHG adults | Black, Hispanic, non-Hispanic Caucasian (US) | Progressively elevated across categories of increasing glucose intolerance (all P < 0.05): TG concentration, large and intermediate VLDL concentrations; total VLDL particle number and size; small LDL concentration; total LDL particle number. Progressively reduced across categories of increasing glucose intolerance (all P < 0.05): Large and intermediate LDL concentration, LDL particle size, total and large HDL concentration, HDL particle size. Greater concentrations of small, dense LDL particles and lower concentrations of large LDL particles were associated with IR or greater adiposity. IR and adiposity were associated with higher large VLDL particle concentration and a shift to larger VLDL size, low HDL particle concentration | NMR |
Haffner [48] | San Antonio Heart Study | 466 | IR & NoHG male adults | Hispanic, non-Hispanic Caucasian (US) | Mexican Americans: higher BMI, more IR, higher fasting TG, lower LDL lipoprotein size (all P < 0.05). Pattern B trended higher in Mexican Americans (40 % vs. 34 %). In univariate analysis, LDL size significantly associated with glucose, insulin, male gender, total cholesterol, HDL-C, and TG. In multivariate analyses, higher TG, insulin, and glucose concentrations, lower HDL-C, and male gender were independent correlates of small, dense LDL. Pattern B predicted by higher insulin, higher TG, and male gender, independent of ethnicity | PAGGE |
Hodge [51] | Melbourne Collaborative Cohort Study (MCCS) | 754 vs. 59 | NoHG vs. T2DM adults | Born in Australia, UK, Greece, or Italy (Australia) | DM onset at 4years more prevalent in adults with Southern European origin. DM: higher BMI, total cholesterol, TG; lower HDL-C (all P < 0.05). DM NMR subclasses: Higher VLDL size and particle number; large and medium VLDL concentrations; IDL concentration; LDL particles; medium-small and very small LDL concentration; small HDL concentration (all P < 0.05). DM NMR subclasses: Lower LDL size; HDL size; large LDL concentration; large HDL concentration (all P < 0.05). Concentration of VLDL particles (positive) and HDL particle size (negative) was selected by stepwise regression as predictors of T2DM. These associations were independent of other non-lipid risk factors, but not plasma TG. Factor analysis identified a factor from NMR variables, explaining 47 % of their variation, and characterized by a positive correlation with VLDL, particularly large and medium sized; more low-density lipoprotein (LDL) that were smaller and relatively smaller, but not more HDL particles. This factor was positively associated with diabetes incidence, but not independently of TG | NMR |
Kulkarni [64] | NA | 78 | IR vs. NoHG adults | Asian Indian, Caucasian (US)
Related posts: Lipid: Extracellular Matrix Interactions as Therapeutic Targets in the Atherosclerosis of Diabetes Lipid: Extracellular Matrix Interactions as Therapeutic Targets in the Atherosclerosis of Diabetes
 Insulin Resistance and Atherosclerosis
Niacin Therapy: Impact on Dyslipidemia and Cardiovascular Events in Diabetic Patients Insulin Resistance and Atherosclerosis
Niacin Therapy: Impact on Dyslipidemia and Cardiovascular Events in Diabetic Patients
 Lipoproteins and Diabetic Nephropathy Lipoproteins and Diabetic Nephropathy
 Fibrate Therapy: Impact on Dyslipidemia and Cardiovascular Events in Diabetic Patients Fibrate Therapy: Impact on Dyslipidemia and Cardiovascular Events in Diabetic Patients
 Apoproteins and Cell Surface Receptors Regulating Lipoprotein Metabolism in the Setting of Type 2 Diabetes Apoproteins and Cell Surface Receptors Regulating Lipoprotein Metabolism in the Setting of Type 2 Diabetes
Stay updated, free articles. Join our Telegram channel
Full access? Get Clinical Tree
 Get Clinical Tree app for offline access

|