Late Effects and QUANTEC
The modern era of cancer therapy is predicated on the safe intensification of radiation, chemotherapy, and biologic adjuvants. This has resulted in a markedly increased survivorship, which now exceeds 64% overall, and for some malignancies, such as breast and prostate cancer, is much higher. Malignancies resistant to therapy may demand an aggressive treatment approach that often resides at the limit of, or even exceeds, normal tissue tolerance to some “acceptable” degree. Clearly, the potential to ameliorate or prevent such normal tissue damage, or to manage and rehabilitate affected patients, requires an understanding of tissue tolerance to therapy. Because “late effects” manifest months or years after cessation of treatment, therapeutic decisions intended to obviate such effects can be based only on the probability, not the certainty, that such effects will develop. In making such decisions, the balance between efficacy and potential for toxicity should be considered, as well as the influence of host, disease, and treatment-related risk factors.
Historically, radiation therapy fields and doses were selected empirically, based largely on physicians’ clinical experience and judgment. They understood that these empiric guidelines were imprecise and did not completely reflect the underlying anatomy, physiology, molecular biology, and dose distributions. The introduction of three-dimensional (3D) treatment planning offered the promise of quantitative correlates of doses/volumes with clinical outcomes. This promise was partly delivered. When 3D dosimetric information became widely available, guidelines were needed to help physicians predict the relative safety of proposed treatment plans, although only limited data were available.
In 1991, investigators pooled their clinical experience, judgment, and information regarding partial organ tolerance doses and produced the “Emami paper”.1 As discussed later, this paper clearly stated the uncertainties and limitations in its recommendations, and it is rightly admired for addressing a critical clinical need. Over the past two decades, numerous studies have reported associations between dosimetric parameters and normal tissue outcomes. In 2007, a joint task force of physicists and physicians was formed, with the support of the American Society for Therapeutic Radiology and Oncology (ASTRO) and the American Association of Physicists in Medicine (AAPM), to summarize the available data in a format useful to clinicians and to update/refine the estimates provided by Emami et al.
The resulting QUANTEC reviews2 (quantitative analysis of normal tissue effects in the clinic), published in a special issue of the International Journal of Radiation Oncology, Biology and Physics in March 2010, are summarized in this chapter.
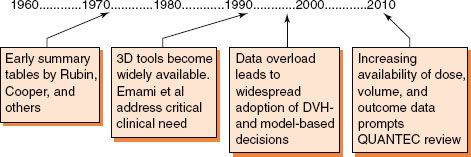
FIGURE 13.1. Key events in the development of dose–volume and normal tissue toxicity relationships in radiation oncology.
 HISTORICAL BACKGROUND
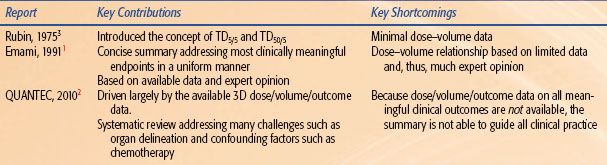
The relationship between dose–volume parameters and outcome has been the focus of numerous investigators for decades. A brief summary of historical landmarks is provided to follow, along with our opinion regarding the key contributions and shortcomings of these reviews (Fig. 13.1 and Table 13.1).
 THE INCORPORATION OF 3D DOSE–VOLUME INFORMATION INTO CLINICAL GUIDELINES
The pre-Emami reports3 were novel in that there were no tools available (to either the authors or clinicians) to accurately quantify the fraction of various organs that were being irradiated. Thus, the dose/volume/outcome information presented consisted largely of estimates based on expert opinion. Similarly, clinicians needed to estimate the partial volumes of different organs that were being irradiated in their patients in order to apply the provided information.
In the late 1980s and early 1990s, 3D planning systems were providing clinicians with a plethora of information. However, systematic dose/volume/outcome data to guide clinical decisions based on this information were limited. There was an urgent need for clinicians to have some guidance in making clinical dose–volume decisions. The report by Emami et al.1 met this critical need. This report was, and remains, a landmark summary of decades worth of data for a wide variety of organs, supplemented with expert opinion where data were lacking. This article remains a required reading for all trainees in our field.
During the 1990s and 2000s, a large number of studies related dose–volume data to clinical outcomes. The QUANTEC review was an attempt to refine the guidelines based on the available 3D dose/volume/outcome data.
 DOSE–VOLUME HISTOGRAMS AND ASSOCIATED FIGURES OF MERIT
Three-dimensional dose–volume data can be difficult for clinicians to readily digest. Visualizing isodose distributions is challenging, and comparing competing distributions is almost impossible. Therefore, dose–volume histograms (DVHs; essentially two-dimensional [2D] representations of the 3D data) were embraced as a rapid way to summarize the dose distribution. Note that DVHs discard information regarding the spatial character of dose as well as (usually) variations in fraction size. However, DVHs can also be challenging for clinicians to consider and compare. Therefore, it has become attractive to extract “figures of merit” from the DVH, such as the Vx (the percent of an organ receiving ≥ x Gy). Thus, DVHs and their associated figures of merit are necessary tools to enable clinicians to readily apply 3D information clinically. They are excellent tools but obviously have their shortcomings.
TABLE 13.1 HISTORICAL OVERVIEW OF SUMMARIES OF DOSE/VOLUME/OUTCOME INFORMATION
 MODEL-BASED ESTIMATES OF OUTCOMES
The Emami et al. report systematically used the same DVH-based construct across many organs, for example, the TD5/5 and TD50/5 for the uniform irradiation of one-third, two-thirds, and the whole volume of an organ. This uniform approach enabled the application of “single unifying models” of dose/volume/outcome across organs. For example, the dose/volume/outcome estimates from Emami et al. were used by Lyman et al.,4 Kutcher et al.,5 and Burman et al.6 to generate a set of organ-specific model parameters. Such a uniform approach is attractive to modelers and busy clinicians.
During the last two decades, many clinical dose/volume/outcome reports computed parameters for these “unifying models” (e.g., Ten Haken et al.7–8,9). Other investigators have suggested alternative models that appeared to be better suited to specific organs (vide infra).
The dose/volume/outcome data available for the QUANTEC review were not of a uniform format. Outcomes across organs were correlated with a diverse array of dose–volume metrics (e.g., threshold volumes [Vx], threshold doses [Dx], mean doses). Therefore, the QUANTEC review included model-based parameters for just a few organs, and not always in a systematic fashion.
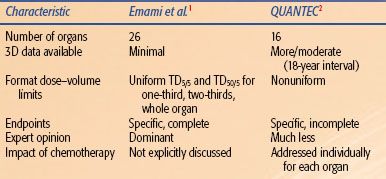
TABLE 13.2 COMPARISON OF THE CHARACTER/CONTENT OF EMAMI ET AL AND QUANTEC
 MAJOR DIFFERENCES BETWEEN THE QUANTEC AND EMAMI REVIEWS
Emami et al.1 provided information for 26 organs, judged necessary to support protocols for “three dimensional treatment planning for high energy photons (RFP #NCI-CM-36716-21).” Conversely, the QUANTEC review was focused on organs for which the steering committee thought that there were meaningful dose/volume/outcome data (Table 13.2).
Emami et al. addressed a wide variety of clinical outcomes and thus provided the reader with a set of dose–volume parameters for essentially all clinical situations. Conversely, the QUANTEC review was focused on endpoints where there were dose/volume/outcome data. In this regard, the Emami tables are more complete. For example, consider the QUANTEC summary for the small bowel. A volume restriction is provided for the endpoint of acute grade ≥3 toxicity. No guidance is provided for late small bowel injury, as the authors did not believe that there was meaningful dose/volume/outcome data for late injury. This is a shortcoming of the QUANTEC review as it is not “complete.” When evaluating a proposed 3D treatment plan, one obviously must consider both acute and late injury.
Emami et al. presented information in a systematic/uniform manner, facilitating interorgan comparisons and model-based parameter estimates. The QUANTEC review presented dose/volume/outcome data in the diverse manner in which they were available in the literature.
 MOLECULAR MECHANISMS OF LATE RADIATION DAMAGE
The design of optimal radiation treatment plans and identification of therapeutic strategies to prevent radiation-induced damage would benefit from an understanding of the underlying late effects from ionizing radiation. Both of these issues are further complicated by the variability in sensitivity to radiation observed across disease types and between patients, as well as the current absence of identifiable factors that predict a propensity for radiation-induced toxicity.10–13 While the initial damage done to the DNA, proteins, and membrane lipids of cells by exposure to ionizing radiation is well known, the mechanisms behind the sustained changes in gene expression and signaling pathways that contribute to latent and permanent tissue injury are less clear. This section will focus on the established mechanisms of radiation-induced tissue injury and identify areas in which further efforts are needed to determine the mechanisms driving tissue injury and prognostic markers for the development of radiation injury.
Early Cellular Effects of Radiation
Exposure to ionizing radiation causes direct DNA damage through linear energy transfer as well as indirect damage by radiolytic cleavage of water, yielding hydroxyl radicals capable of abstracting hydrogen from the backbone of DNA to cause double-stranded breaks.14,15 This damage to genomic DNA causes cell death by apoptosis or mitotic catastrophe. While the ability of hydroxyl radicals to cause DNA damage is significant, the initial increase in hydroxyl radical and other reactive oxygen species (ROS) attributable to radiation exposure is negligible compared to the baseline presence of ROS in the cell.15 Within a few hours of radiation exposure, however, the cell responds by increasing ROS production, creating a cellular environment capable of exacerbating the initial injury by causing oxidative damage to proteins and lipids.16 This is thought to occur via ROS-mediated activation of mitochondria-dependent and -independent metabolic enzymes, including nitric oxide synthases (NOSs) and oxidoreductase enzymes.
Sources of Reactive Oxygen Species
NADPH Oxidases
Nicotinamide adenine dinucleotide phosphate (NADPH) oxidases are a family of broadly distributed oxidoreductase enzymes. Membrane-associated NADPH oxidases are the primary source of ROS in nonphagocytic cells.17 Under normal conditions, NADPH oxidase–derived superoxide anion is a mediator of maintenance and smooth muscle tone of the vasculature.18 When these enzymes are induced to begin pathologic overproduction of ROS, however, they can contribute to the development of oxidative stress, resulting in cell damage and disruption of signaling pathways.19 Nox4, a hydrogen peroxide–producing isoform, is of particular interest, as overproduction of hydrogen peroxide by Nox4 has been shown to be a necessary element of tumor growth factor-β1 (TGF-β1)–mediated cell death.20
Mitochondria
Under normal conditions, electrons from the electron transport chain can leak into the mitochondrial matrix and react with oxygen to form superoxide anion.21 Following radiation, Leach et al. observed that mitochondria in squamous carcinoma cells undergo a permeability transition, causing release of high levels of ROS into the cytoplasm.22 They further showed that inhibition of this transition not only attenuates the increase in cytoplasmic free radicals but also prevents radiation-induced activation of mitogen-activated protein (MAP) kinase, suggesting a causal link between mitochondrial ROS/reactive nitrogen species (RNS) generation and a large group of signal transduction pathways. The role of mitochondrial-generated ROS/RNS in radiation injury is further supported by the radioprotective effect of Mn porphyrin superoxide dismutase (SOD) mimetics, which accumulate preferentially within the mitochondria.23
Augmentation of Reactive Oxygen Species from Other Sources
Superoxide anion from any source can react with nitric oxide to form peroxynitrite (ONOO–), itself a powerful oxidizing species capable of reacting with other molecules and cellular elements to perpetuate free radical overproduction and cause oxidative damage to the cell.24
Free Radicals and the Tissue Response to Radiation
When the increase in ROS production exceeds the antioxidant capacity of the cell, the intracellular environment becomes strongly oxidizing. This change results in altered gene expression as a part of the response to oxidative damage to genomic DNA, modification of redox-sensitive protein activity, and membrane lipid oxidation.25 All of these insults can affect the structure, function, and signaling capacity of the cell. Of particular importance to the radiation response is the persistent up-regulation of transcription factors, including hypoxia-inducible factor-1α (HIF-1α) and nuclear factor κB (NFκB), and cytokines, including TGF-β, which contributes to the development of radiation-induced tissue injury.16,26 These molecules all contribute to the vascular changes, inflammation, and cell death observed in response to radiation, but their roles in complex signaling pathways suggest that early changes in the activity of these molecules may also contribute to the disease process of latent injury. The role of ROS in radiation-induced tissue injury has been confirmed by the finding that SOD overexpression and the use of SOD mimetics can mitigate tissue injury following ionizing radiation exposure.11,23,27–29,30
The Role of Inflammation in the Response to Radiation
Although the manifestations of radiation injury can be divided into early and late effects, irradiated tissues show a dynamic population of different inflammatory cell types throughout the “latency” period, suggesting that, on a cellular level, radiation injury is an ongoing disease process.31 Localization of inflammatory cells is mediated by vascular adhesion markers, and preferentially blocking intercellular adhesion molecule-1 (ICAM-1) does indeed reduce the inflammatory response to radiation in the lungs of C57BL/6 mice.32,33 The resulting reduction in inflammation was, however, not sufficient to suppress development of latent pulmonary damage, suggesting that there are other mechanisms at work during this latent period that contribute to disease processes.32 With the changing inflammatory cell populations come changes in cytokine activity, specifically interleukins, tumor necrosis factor-α (TNF-α), TGF-β, monocyte chemoattractant protein-1 (MCP-1), and keratinocyte chemoattractant (KC).31,34,35 Expression of interleukin-1 (IL-1) messenger RNA (mRNA), together with a two-part up-regulation of TGF-β expression, is known to coincide with the development of fibrosis in C57BL/6J mice, suggesting that the inflammatory response does indeed contribute to the development of latent tissue injury.36 This idea is further supported by the finding that early inhibition of TGF-β reduces radiation-induced pulmonary fibrosis and improves lung function.37,38–39 Further studies indicate that administration of exogenous SOD following thoracic radiation reduced the early up-regulation of IL-1, TNF-α, and TGF-β and extended postradiation survival.40 The apparent link between ROS, inflammatory signaling, and latent injury development suggests that early changes in ROS production do affect delayed tissue damage through ongoing perturbations of signaling pathways.
Radiation-Induced Vascular Changes
Exposure to ionizing radiation causes damage to endothelial cells and vascular structural elements, causing increased vascular permeability.41 This vascular dysfunction results in edema as well as decreased perfusion, which can lead to development of hypoxic regions within the affected tissues.42 Hypoxia exacerbates the initial injury by increasing recruitment of inflammatory cells that, in the process of undergoing the respiratory burst, produce ROS and increase tissue hypoxia by consuming the available oxygen.43 Hypoxia also results in activation of HIFs. HIF-1α is an ROS-stabilized transcription factor that, under hypoxic conditions, forms a heterodimer with HIF-1β. This heterodimer is translocated to the nucleus where it binds the hypoxia response element (HRE), inducing transcription of genes involved in migration proliferation, apoptosis, and angiogenesis.44 This element of the hypoxia response contributes to endothelial cell damage, increasing vascular permeability and, as a result, leakage of fibrin into the extracellular matrix.
Vascular endothelial growth factor (VEGF) is an HIF-mediated growth factor. Under hypoxic conditions, VEGF expression is increased, resulting in aberrant vascular network formation, which leads to irregular perfusion.45 The resulting cycles of hypoperfusion and reperfusion contribute to oxidative stress, further damaging tissue.38
Macrophage accumulation further contributes to the self-perpetuating nature of radiation-induced tissue injury. Accumulation of macrophages is known to occur in areas of low perfusion and inadequate supply of oxygen and is observed in tissues following radiation exposure.46,47 When activated, these cells produce HIF-1α in order to initiate angiogenesis to correct low perfusion.47 This response on the part of macrophages increases the level of oxidative stress, continuing the spread of damage through inappropriate continuation of wound-healing mechanisms.
Possible Metabolic Changes
Carbonic anhydrase-9 (CA-9) is commonly used as a hypoxia marker because CA-9 transcription is dependent on HIF-1α. Because carbonic anhydrases act to catalyze the conversion of metabolically produced carbon dioxide to bicarbonate,48 this increase in CA-9 suggests that cells may also be undergoing a metabolic shift in response to their hypoxic environments. The observed changes in mitochondrial activity would support altered metabolism in postradiation cells, but further work is necessary to determine the nature of such a change.
Implications
Exposure to ionizing radiation disrupts DNA, causing cell death, but it also causes increased production of ROS in viable cells. The oxidizing environment that results from ROS production exceeding the antioxidant capacity of the cell causes further damage by disrupting cell function and signaling pathways. This disturbance results in changes in vascular integrity, an ongoing inflammatory response, and aberrant angiogenesis. Because overproduction of ROS is self-perpetuating, these effects are amplified, increasing the area and severity of damage.
Though many of the mechanisms through which ROS production affects the development of late radiation effects remain unclear, it is likely that these early changes initiate disease processes that progress over time to cause the observed late injury.
 SUMMARY BY ORGAN SYSTEM
To provide a consistent summary of the extensive information in the individual organ reviews, the following outline is utilized:
1. Clinical Significance
2. Endpoints
3. Challenges Defining Volumes
4. Dose/Volume/Toxicity Data
5. Factors Affecting Risk
6. Mathematic/Biologic Models
7. Special Situations
8. Recommended Dose–Volume Limits
9. Future Studies
10. Toxicity Scoring Criteria
Note that the brief summaries for each review do not substitute for reading and understanding the original papers and, as necessary, the underlying literature. In addition, the dose–volume limits described in the QUANTEC reviews are intended to supplement, not supplant, clinical judgment.
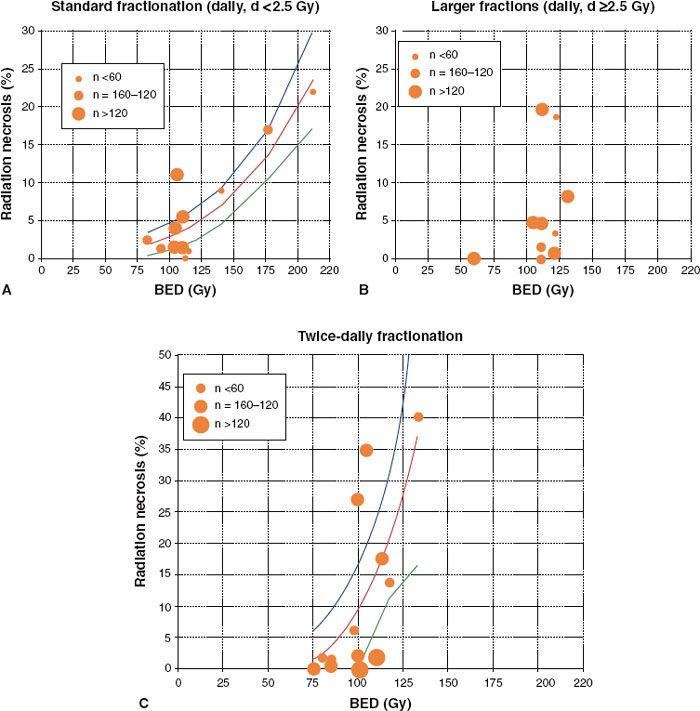
FIGURE 13.2. Incidence of radiation necrosis in brain irradiation from selected studies. Biological equivalent dose (BED) calculated from the linear-quadratic model with α/β = 3 Gy; n = patient numbers as shown. Solid line represents least-squares best fit of data to probit model; dotted lines represent 95% confidence limits. A: Once-daily fractions <2.5 Gy. B: Once-daily fractions ≥2.5 Gy (data too scattered to allow plotting of “best-fit” line). C: Twice-daily radiotherapy. (From Lawrence YR, et al. Radiation dose-volume effects in the brain. Int J Radiat Oncol Biol Phys 2010;76[3 Suppl]:S20–S27.)
 CENTRAL NERVOUS SYSTEM
Brain
Clinical Significance. The acute and late effects of radiotherapy on the brain are common and represent a significant source of morbidity.49 In particular, patients with tumor-related neurocognitive dysfunction may exhibit exacerbated deficits after radiotherapy. In addition, the radiation fields used to treat the upper aerodigestive tract (e.g., sinuses and pharynx) often include a portion of the brain.
Endpoints. The acute side effects of radiation therapy (RT) to the brain include nausea, vomiting, and headache; seizures, visual disturbances, and vertigo are less common.49 These symptoms are typically transient and generally respond well to medication. The endpoints for assessing long-term radiation-induced complications are typically radiation necrosis or asymptomatic radiologic changes as seen on serial magnetic resonance imaging (MRI) scans.49 Other measures have included steroid usage, preservation of performance status, and neurocognitive function.50,51–52
Challenges Defining Volumes. Contouring the entire brain is straightforward, and with appropriate immobilization, there is little intra- or interfraction motion. However, delineation of subregions (e.g., the border between the brainstem and thalamus) and functional segments (e.g., Broca area) of the brain is challenging, and the utility of defining such areas has not yet been proven.49
Dose/Volume/Toxicity Data. For fractionated radiotherapy to the brain, the relationship between dose and radiation necrosis for partial brain irradiation is shown in Figure 13.2 for various fractionation schemes.53–60 Lawrence et al. compared different fractionation schemes by calculating the biologically effective dose (BED),61 with an α/β ratio of 3 Gy.49 For standard fractionation, a dose–response relationship appears to exist, such that an incidence of side effects of 5% and 10% occur at a BED of 120 Gy3 (range, 100 to 140) and 150 Gy3 (range, 140 to 170), respectively (corresponding to 72 Gy [range 60 to 84] and 90 Gy [range, 84 to 102] in 2-Gy fractions). For twice-daily fractionation, a steep increase in toxicity is apparent when the BED exceeds 80 Gy. For daily large fraction sizes (>2.5 Gy), the incidence and severity of toxicity are unpredictable. Lawrence et al. caution against overinterpreting this analysis given the heterogeneity of the data pool (i.e., different target volumes, endpoints, sample sizes, and brain regions).
In children, whole-brain radiotherapy appears associated with neurocognitive decline. With central nervous system prophylaxis for acute lymphoblastic leukemia, the addition of 24-Gy radiation to the whole brain (to a chemotherapy regimen) is associated with a median 13-point intelligence quotient reduction at 5 years after radiotherapy, as well as poorer academic performance and greater psychological distress.62 Reported toxicities have been lower when 14 to 18 Gy was used.63–65 In medulloblastoma, the post-RT intelligence quotients were 10 to 15 points higher for a total whole-brain dose of 23.4 Gy versus 36 Gy.66,67 In adults, the neurocognitive effects of whole-brain irradiation are less clear.
In stereotactic radiosurgery (SRS) of brain lesions, normal tissue toxicity appears to be a function of dose, volume, and location in the brain. The Radiation Therapy Oncology Group (RTOG) conducted a dose-escalation study (RTOG 9005) of radiosurgery to recurrent brain metastases and primary tumors in patients who previously received whole- or partial-brain irradiation.68 The goal of this study was to determine the maximal tolerated dose as a function of maximum diameter of the lesion. Unacceptable toxicity was defined as acute irreversible severe neurologic symptoms, requiring inpatient or outpatient medications, any life-threatening neurologic toxicity, or death. This study found a maximum tolerated prescription dose to the tumor margin of ≥24 Gy, 18 Gy, and 15 Gy for tumors with a maximal diameter of ≤2.0 cm, 2.1 to 3.0 cm, and 3.1 to 4.0 cm, respectively. The rates of acute and late unacceptable toxicities in patients treated at these doses were 0% and 10%, 0% and 14%, and 0% and 20%, respectively. The dose limits appear to be validated by the results of the RTOG 9508, a randomized study of SRS + whole-brain radiation therapy (WBRT) versus WBRT alone in 333 patients with brain metastases.50 Using the dose constraints developed in RTOG 90-05, this study found a 3% and 6% rate of grade 3 and 4 acute and late toxicities, respectively, in the group of 167 patients receiving radiosurgery.
The results of dose–volume studies of the development of “radionecrosis” following single-fraction radiosurgery are shown in Table 13.3.49,69–78 While a common element in many of these studies is the volume receiving a dose of 10 or 12 Gy or more (V10 or V12, respectively), there is a broad variation in the crude rate of radionecrosis as a function of volume irradiated. This is likely due to difference in the definition of radionecrosis, the location irradiated, the proximity to and sparing of critical structures, and the length and intensity of clinical follow-up.
TABLE 13.3 SELECTED STUDIES OF RADIONECROSIS IN PATIENTS RECEIVING BRAIN STEREOTACTIC RADIOSURGERY
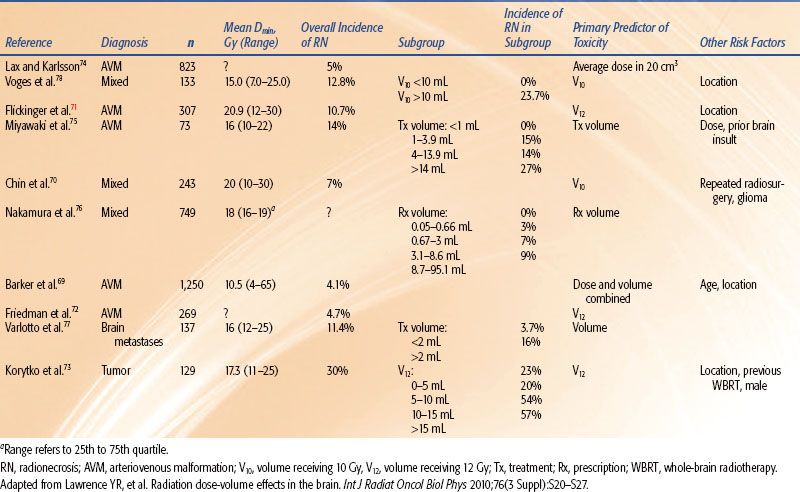
These results suggest that the rate of complications increases rapidly as the V12 increases beyond 5 to 10 cm3. Note, however, that V12 will far exceed these limits for lesions 2 cm or greater in mean diameter when the RTOG guidelines are utilized. For example, assume that spherical lesions 1, 2, 3, and 4 cm in diameter are treated under the RTOG guidelines with single-fraction radiosurgery with the plans yielding V12’s of six, five, four, and three times the lesion volume, respectively. Then, the calculated V12’s are 3, 21, 57, and 101 cm3, respectively.
The location of the lesion is important as the severity of expressed damage is greater in the more eloquent parts of the brain. For example, for a V12 of 10 cm3, Flickinger et al.71 found a <5% symptomatic postradiosurgery injury for arteriovenous malformations (AVMs) in the frontal, temporal, and parietal lobes versus >20% for AVMs in the brainstem, thalamus, and basal ganglia.
Factors Affecting Risk. Younger age is associated with a higher risk of neurocognitive decline in children undergoing cranial irradiation.79,80 Other risk factors include female gender, neurofibromatosis-1 (NF-1) mutation, extent of surgical resection, hydrocephalus, concomitant chemotherapy (especially methotrexate), location, and volume of brain irradiated.81 No evidence has shown that children are at particular risk of radiation necrosis,82,83 however.
Mathematic/Biologic Models. While the linear-quadratic model appears useful in comparing dose/fraction for conventionally fractioned radiotherapy schemes, its utility at high doses per fraction (≥8 Gy) is controversial. In general, quantitative dose/volume/clinical toxicity relationships have not been established for neurocognitive function in partial brain irradiation. The apparent increased risk of radionecrosis in twice-daily partial brain irradiation suggests that the time constant for repair of radiation-induced damage may be longer than the typical interfraction interval, but this has not been modeled for this specific system.
Special Situations. Reirradiation of the whole brain is frequently performed in the setting of recurrent, multiple brain metastases. A meta-analysis of whole-brain reirradiation (interval between courses, 3 to 55 months) found no cases of necrosis when the total radiation dose was <100 Gy (normalized to 2 Gy/fraction with an α/β ratio = 2 Gy).84 In primary central nervous system lymphoma, whole-brain radiotherapy has been associated with an atypically high risk of cognitive decline, especially in those >60 years old.85,86 The heightened sensitivity of this population to irradiation might be explained by the tumor’s highly diffuse, angiocentric growth pattern and that most patients receive high-dose methotrexate, a potent neurotoxin. As a result, up-front full-dose RT is now often avoided in elderly patients with this disease. A lower radiation dose of 23.4 Gy delivered in 1.8-Gy daily fractions appears to be associated with minimal cognitive toxicity, even in older patients.87
Recommended Dose–Volume Limit.49 For partial-brain irradiation at a conventional dose per fraction, there is a predicted 5% and 10% risk of symptomatic radiation necrosis at a BED of 120 Gy3 (range, 100 to 140) and 150 Gy3 (range, 140 to 170), respectively, which corresponds to 72 Gy (range 60 to 84 Gy) and 90 Gy (range 84 to 102 Gy) for 2-Gy daily fractions. This is a less conservative estimate than the 5% risk of radionecrosis for one-third of the brain irradiated to 60 Gy in the Emami paper.1 The authors stress that for most cancers, there is no clinical indication for partial-brain dose above 60 Gy and that, in some scenarios, an incidence of 1% to 5% radiation necrosis at 5 years would be unacceptably high. The brain appears especially sensitive to fraction sizes >2 Gy and, surprisingly, twice-daily irradiation.
For radiosurgery, the available data suggest that it is prudent to minimize the volume of normal brain receiving >12 Gy in a single fraction and to consider both target diameter and anatomic location when prescribing dose. However, the QUANTEC authors admit that “the substantial variation between the reported treatment parameters and outcomes from different centers has prevented [more] precise toxicity risk predictions.”
Future Studies. Key questions that would benefit from systematic study include:
1. What is the dose/volume/location/clinical toxicity relationship for brain metastases and other common lesions treated with single-fraction SRS?
2. What is the rate of local and distant failure for the aforementioned sets of patients as a function of prescribed dose?
3. How does the gross tumor volume (GTV) to planning target volume (PTV) expansion influence the incidence of normal tissue toxicity and failure rates in single-fraction SRS?
4. How is the incidence of normal tissue toxicity affected by previous large-field irradiation to the brain, particularly the combination of WBRT and SRS in the treatment of brain metastases?
5. How do systemic treatments affect the incidence of normal tissue toxicity?
6. What is the time interval for repair of radiation-induced damage in the brain?
Toxicity Scoring Criteria. Studies of brain radiotherapy should report detailed dosimetric and outcome data, including neurocognitive and neurologic dysfunction (e.g., per the Common Terminology Criteria for Adverse Events, version 4.0 [CTCAE v. 4.088]), the prescription dose, dose/fraction, target volume, V12, anatomic location treated, and clinical outcome data (e.g., adverse events, patterns of failure).
Optic Apparatus
Clinical Significance. The optic nerves and chiasm frequently receive a substantial dose during therapeutic irradiation of brain, base of skull, and head and neck targets, and the optic apparatus is frequently the dose-limiting structure in these cases. While rare, damage to the optic apparatus can produce devastating and, at present, irreversible visual deficits.88
Endpoints. The primary endpoint for radiation-induced optic neuropathy (RION) is visual impairment, defined by visual acuity and the size/extent of visual fields.89 Of course, damage to the lens (development of cataracts), retina (retinitis), and lacrimal apparatus and trigeminal nerve (dry eye syndrome) can also produce impaired vision.90 While toxicity may be objectively scored using CTCAE version 491 and late effects of normal tissues, subjective, objective, medical management and analytical evaluation of injury (LENT-SOMA) criteria,92,93 it is important to obtain a comprehensive ophthalmologic examination of patients with suspected RION.
Challenges Defining Volumes. The optic nerve originates roughly at the posterior center of the globe and is bracketed by the rectus muscles as it tracks posteriorly through the orbit to pass through the optic notch, just medially to the anterior clinoid process. The optic nerves join and decussate to form the optic chiasm, an X-shaped structure that sits just superiorly to the sella turcica with the center immediately anterior to the pituitary stalk.94 The optic nerves and chiasm are thin (<5 mm diameter) and visualization is best performed using thin-cut (≤3 mm) T1- or T2-weighted magnetic resonance imaging. Contouring the optic nerves/chiasm is challenging, and it is important to ensure that these structures are drawn in continuity (i.e., there is not a gap in the contours). Appropriate contouring of these structures is facilitated by visualizing this region in multiple planes and using fused imaging modalities (e.g., utilizing the magnetic resonance images in the axial and coronal planes to track the optic nerves/chiasm and sagittal computed tomography [CT] views to see the sella turcica).
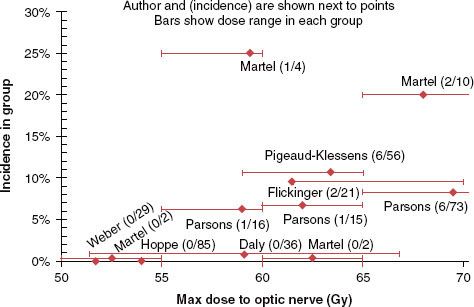
Dose/Volume/Toxicity Data. The data for the incidence of RION with conventional fractionation for selected studies95–96,97–102 are summarized in Figure 13.3. The risk of RION appears to rise steeply past 60 Gy. None of the patients in the study by Parsons et al.95 with a maximum point dose (Dmax) to the optic nerves/chiasm <59 Gy developed RION. In the study by Martel et al.,96 the average maximum chiasm and nerve dose was 53.7 Gy (range 28 to 70 Gy) and 56.8 Gy (range 0 to 80.5 Gy) for patients without RION. The optic nerves had received a Dmax of 64 Gy with 25% of the volume receiving >60 Gy for patients with moderate to severe complications. Jiang et al.97 reported no incidence of ipsilateral RION for a dose <56 Gy and a <5% incidence at 10 years for a dose <60 Gy at ~2.5 Gy/fraction.
The risk of RION appears to be related to the fraction size. Parsons et al.95 reported 15-year actuarial rates of RION for total doses of 60 to <70 Gy of 50% versus 11% at ≥1.9 versus <1.9 Gy dose/fraction, respectively. No patients treated twice daily with 1.2 Gy/fraction developed RION. At total doses of 70 to 83 Gy, the incidence was 33% versus 11% for ≥1.9 versus <1.9 Gy/fraction and 12% for 1.2 Gy twice-daily fractions. Bhandare et al.103 noted reductions in RION rates for twice- versus once-daily treatment.
Results from proton treatments appear consistent with those utilizing photons.102,104–106 Note that the proton doses are reported as cobalt gray equivalent (CGE), reflecting their greater biologic effect, and that photons were often used in combination with protons. Most proton series have reported a very low incidence of RION, and in the few cases of reported RION, a threshold dose in the range of 55 to 60 CGE has been observed, consistent with the photon experience. As with photons, many patients exceeding this threshold did not develop RION. Wenkel et al.,106 Noel et al.,104 Weber et al.,102 and Nishimura et al.105 used a Dmax constraint to the optic structures of 54, 55, 56, and 60 CGE, respectively.
Because of the small size of the optic nerves/chiasm and steep dose gradients in radiosurgery, most studies of RION involving SRS use the Dmax to the optic nerves/chiasm as the critical dose metric.88 As shown in Table 13.2, single-fraction SRS studies describe a range of threshold Dmax for RION. In analyzing their early experience with radiosurgery, Tishler et al.107 reported RION at Dmax as low as 9.7 Gy and recommended 8 Gy as the dose limit for the optic nerves/chiasm in SRS. Stafford et al.108 found RION in four of 215 patients receiving a median Dmax of 10 Gy. The Dmax in the patients ranged from 0.4 to 16 Gy, and three of the four had received previous external beam radiotherapy to this area. They estimated a 1.7%, 1.8%, 0%, and 6.9% incidence of RION for Dmax of <8, 8 to 10, 10 to 12, and >12 Gy, respectively.
Conversely, Pollock et al.109 observed no cases of RION in 62 patients with nonfunctioning pituitary adenomas receiving a median Dmax of 9.5 +/– 1.7 Gy to the optic apparatus during single-fraction SRS, using a 12 Gy Dmax as the dose constraint for the optic apparatus. From a study of 50 patients with benign base-of-skull tumors treated with single-fraction SRS and a median follow-up of 40 months, Leber et al.110 estimated a 0%, 27%, and 78% risk of RION for Dmax of <10, 10 to <15, and ≥15 Gy, respectively. No data for dose–volume and RION were available for hypofractionated stereotactic radiotherapy (4 to 8 Gy/fraction).88
FIGURE 13.3. Incidence of radiation-induced optic neuropathy (RION) in selected studies.95–96,97–102 Points offset from 0% to 1% were shifted to clearly show range bars. The single patients in the studies by Parsons et al.95 and Martel et al.96 with events in the 55–60 Gy range were treated to 59 Gy and 59.5 Gy, respectively. (From Mayo C, et al. Radiation dose-volume effects of optic nerves and chiasm. Int J Radiat Oncol Biol Phys 2010;76[3 Suppl]:S28–S35.)
Factors Affecting Risk. There appears to be an increased risk of RION with increasing age.95 Parsons et al.95 reported that none of the 38 patients in the 20- to 50-year-old range developed RION, even though the reported optic nerve doses were >60 Gy for 58% and >70 Gy for 26%. In contrast, for patients with doses >60 Gy, the incidence was 26% and 56% for the 50- to 70- versus >70-year-old age groups. RION in children is poorly characterized, but treatment of the developing optic apparatus should be approached cautiously. Reports on the effect of other factors such as adjuvant chemotherapy, diabetes mellitus, and hypertension have been inconsistent. Minimal data are available on reirradiation of the optic apparatus and the effect of the interval between courses on RION. Flickinger et al.111 found that one of 10 patients undergoing reirradiation of the optic apparatus developed RION—the affected received an initial 40 Gy, and after a 7.5-year interval, an additional 46 Gy, both at 2 Gy/fraction.
Mathematic/Biologic Models. The original Lyman-Kutcher-Burman normal tissue complication probability volumetric modeling4 estimated TD50 = 65 Gy, n = 0.25, and m = 0.14. The dose–response data from Jiang et al.97 (1.5–2.2 Gy/fraction) suggests TD50  72 to 75 Gy. Martel et al.96 and Brizel et al.112 estimated TD50 at 72 and 70 Gy, respectively. Extrapolation of the Parsons dose–response data95 suggests that TD50 exceeds 70 Gy.
Special Situations. There is a suggestion that RION may occur at lower doses in patients with pituitary tumors, as complications at doses as low as 46 Gy at 1.8 Gy/fraction have been reported.100,113,114 Mackley et al.100 and van den Bergh et al.113 constrained the optic structure Dmax to 46 and 45 Gy, respectively. The RION latency also appeared shorter in patients with pituitary tumors. The average latency was 10.5 and 31 months (range 5 to 168 months) in patients with pituitary targets and nonpituitary targets, respectively.100,114
Recommended Dose–Volume Limits. The estimate by Emami et al.1 of a 5% risk of blindness within 5 years of treatment for a dose of 50 Gy appears inaccurate. The QUANTEC review88 suggests that the incidence of RION was unusual (<2%) for Dmax <55 Gy, particularly for fraction sizes <2 Gy. The risk increases (3% to 7%) in the region of 55 to 60 Gy and becomes more substantial (>7% to 20%) for doses >60 Gy when dose per fraction of 1.8 to 2.0 Gy is used. The patients with RION treated in the 55 to 60 Gy range were typically treated to doses in the very high end of that range (i.e., 59 Gy). For particles, most investigators found that the incidence of RION was low for a Dmax <54 CGE. One exception to this range was for pituitary tumors, in which investigators used a constraint of Dmax <46 to 48 Gy for 1.8 Gy/fraction.
The aforementioned studies suggest that the incidence of RION in single-fraction radiosurgery is rare for Dmax <8 Gy, increases in the range of 8 to 12 Gy Dmax, and becomes >10% when Dmax exceeds 12 Gy. Though the QUANTEC paper presents isoeffect curves for RION over a range of 2 to 12 Gy/fraction using various radiobiologic models, the authors emphasize that there are no data in the hypofractionated range and caution that the curves should not be used to predict toxicity in this regime.
Future Studies. In addition to reporting detailed dose–volume data for patients with and without RION receiving radiation to the optic apparatus, investigators must consistently, completely, and accurately contour the optic apparatus.
Toxicity Scoring Criteria. Visual deficits should be scored using the CTCAE v. 4.0.37
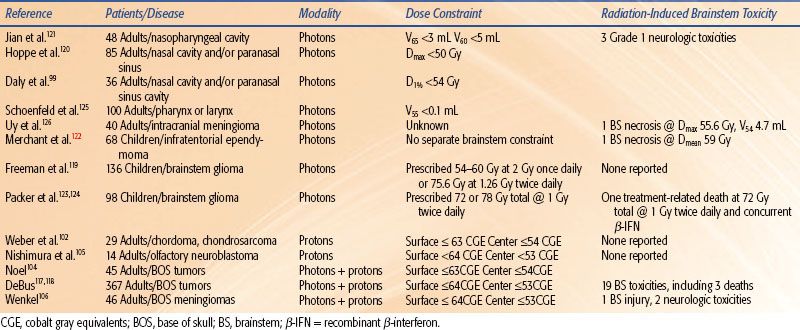
TABLE 13.4 SELECTED STUDIES OF RADIATION-INDUCED BRAINSTEM TOXICITY WITH CONVENTIONAL FRACTIONATION OR HYPERFRACTIONATION
Brainstem
Clinical Significance. As with the optic apparatus, irradiation of the brain, base of skull, and neck can deliver a significant dose to the brainstem, which is frequently the dose-limiting structure.
Endpoints. Radiation-induced damage to the brainstem may be manifest as specific cranial neuropathies; focal motor, sensory, or balance deficits; or mild to life-threatening global dysfunction. This is reflected in the CTCAE,91 which scores brainstem-related toxicity on the basis of symptoms. The study of radiation-induced brainstem injury is challenging because (a) the reported incidence of injury is low, (b) survival time is short for many patients, (c) formal grading of brainstem effects is subjective and is often characterized categorically (i.e., “yes–no”) for cranial neuropathy, and (d) for patients with intracranial tumors, it is often difficult to distinguish between side effects and disease progression.115
Challenges Defining Volumes. Contouring the brainstem on axial MRI is usually straightforward, although it requires special attention to the superior extent and interfaces at the cerebral and cerebellar peduncles where the borders are indistinct. Coronal and sagittal views, in addition to axial images, are frequently helpful in visualizing the brainstem and its interfaces. The adult brainstem volume is on the order of 35 ± 8 mL.116
Dose/Volume/Toxicity Data. Studies of potential radiation-induced brainstem toxicity in conventionally fractionated partial-brain, base-of-skull, or neck irradiation variably report crude radiographic and functional toxicities over typically short follow-up periods.99,102,104–106,117–126 Reported toxicities attributable to radiation of the brainstem and dose constraints are presented in Table 13.4. Uy et al.126 reported brainstem necrosis in one of 40 adult meningioma patients treated with intensity-modulated radiation therapy (IMRT). For this patient, the Dmax was 55.6 Gy, and the absolute volume of brainstem that exceeded 54 Gy was 4.7 mL. Jian et al.121 noted a grade 1 neurologic deficit in three of 48 patients with nasopharyngeal cancer treated with 1.2 Gy twice-daily photons to 74.4 Gy and concomitant chemotherapy.
In the largest study, Debus et al.117,118 reported on 367 patients with base-of-skull tumors with a combination of conformal photon and proton radiation therapy. Nineteen late brainstem-related toxicities were observed, including three deaths. On univariate analysis, significant predictors of toxicity were Dmax >64 CGE, V50 CGE >5.9 mL, V55 CGE >2.7 mL, V60 CGE >0.9 mL, two or more skull-based surgeries, diabetes, and high blood pressure. On multivariate analysis only V60 >0.9 mL, two or more skull-based surgeries, and diabetes were predictive. In a study of 46 patients with recurrent base-of-skull meningiomas, treated to a median brainstem Dmax of 58.0 CGE, Wenkel et al.106 found that one patient developed brainstem injury at a dose that exceeded an unspecified constraint value by 10%. Two others with neurologic toxicities had brainstem doses that exceeded the constraints as shown in Table 13.4.
In pediatric patients with brainstem glioma (treated with opposed lateral fields that encompassed the majority of the brainstem), no toxicity was reported at doses of 54 to 60 Gy at 2 Gy/fraction, 75.6 Gy at 1.26 Gy twice daily,119 or 78 Gy at 1 Gy twice daily.123 The primary limitation of these studies was the short median survival, <12 months. Of 32 patients treated to 72 Gy twice daily in combination with recombinant β-interferon, there was at least one treatment-related death.124
Most pediatric protocols for central nervous system tumors recommend doses >54 Gy, and separate brainstem dose constraints are often absent. Merchant et al. studied 68 patients with infratentorial ependymoma treated with surgery and conformal RT (54 to 59.4 Gy).122 In patients with full recovery, a considerable portion of the brainstem received over 60 Gy (V60 = 7.8 ± 1.4 mL). There was no difference in brainstem recovery based on absolute or percent volume of the brainstem that received more than 54 Gy. Differences in these values for patients without full recovery were not statistically significant. One patient died with autopsy-confirmed residual tumor and focal areas of brainstem necrosis. The mean brainstem dose was 59 Gy, and he also exhibited severe perioperative morbidity after two surgeries.
A limited number of studies report brainstem toxicity in single-fraction SRS or hypofractionated stereotactic radiotherapy (HFSRT).127,128–131 A broad range of prescription isodose levels and dose metrics are reported, making it difficult to develop a predictive dose–volume model for brainstem toxicity.115 In the study with the largest number of patients, Foote et al.127 analyzed the outcome in 149 vestibular schwannoma patients treated with SRS between 1988 and 1998; 41 were treated before 1994, when radiosurgery was primarily based on CT imaging, and 108 after 1994, when planning was MRI based. Large single-fraction doses (10 to 22.5 Gy) were used. Their analysis revealed a “learning curve,” with a 5% and 2% actuarial 2-year rate of facial and trigeminal neuropathies, respectively, for patients treated after 1994 compared with 29% for both neuropathies for the earlier patients. This study found a significant increase, with a 2-year actuarial rate of facial and trigeminal neuropathies of 29% and 7% for patients treated before and after 1994, respectively. The authors ascribe this difference to the use of MRI rather than CT-based imaging and lower prescription doses in the latter years. A univariate analysis showed an incidence of cranial nerve neuropathy of 2% for <12.5 Gy versus 24% for >12.5 Gy (p <.0003). On multivariate analysis, the prescription dose >12.5 Gy, prior surgery, and treatment prior to 1994 were significant variables.
Mathematic/Biologic Models. The Emami review estimates a 5-year, 5% rate of complications, defined in that study as “necrosis/infarct,” at 50, 53, and 60 Gy delivered to the whole, two-thirds of, and one-third of the brainstem, respectively.1 The corresponding Lyman-Kutcher-Berman (LKB) parameters for calculation of the normal tissue complication probability (NTCP) were n = 0.16, m = 0.14, and a tolerance dose for 50% probability of these complications (TD50) equal to 65 Gy.26 These estimates and model parameters appear overly conservative. For example, the LKB model estimates a 12% risk of severe complications for 54 Gy to the whole brainstem or a 3% risk of complications when the proton dose constraints (Table 13.4) are utilized. The clinical data would suggest that a larger TD50, smaller m, or larger m values might produce more reasonable estimates of toxicity. For example, an LKB model with a larger TD50 (72 Gy) or smaller m (0.1) would reduce the predicted risks to <5% or <1%, respectively. However, there are insufficient existing dose/volume/complication data to generate a more accurate model estimate at this time.
Recommended Dose–Volume Limits. The QUANTEC study concludes that the entire brainstem may be treated to 54 Gy using conventional fractionation with limited risk of severe or permanent neurologic effects.115,122 While the precise dose–volume relationship is unclear, partial volumes of the brainstem (1 to 10 mL) may be irradiated to a maximum dose of 59 Gy for dose fractions ≤2 Gy. The risk appears to increase markedly at doses >64 Gy. In radiosurgery, it appears that a maximum brainstem dose of 12.5 to 13 Gy is associated with a low (<5%) risk of cranial neuropathy in patients with vestibular schwannomas treated with single-fraction SRS. The risk appears to increase rapidly when the marginal prescription dose is >15 Gy or when the target volume exceeds 4 mL.115,127,132 However, doses of 15 to 20 Gy have been used to treat brainstem metastases with a low reported rate of complications, potentially because of the limited survival time for these patients.129,133
Future Studies. Uniform, complete reporting of patient-specific dose/volume/outcome data for patients with and without complications are required.
Toxicity Scoring Criteria. Patients should undergo a complete history and physical examination at regular intervals with particular attention to the neurologic exam. Toxicity should be scored and reported using the CTCAE v. 4.0.91
Auditory Apparatus
Clinical Significance. Radiation therapy to brain tumors and head and neck cancers may damage the cochlea and/or acoustic nerve, leading to sensorineural hearing loss (SNHL) and compromised quality of life.134
Endpoints. SNHL following conventionally fractionated radiotherapy is typically measured by a decrease in the bone conduction threshold at 0.5 to 4 kHz,134 the primary range for human speech, using pure-tone audiometry (PTA). While the technique is well established and standardized, a broad range of specific audiometric parameters are used to characterize SNHL, including the frequency (range) used for testing, the threshold chosen for a clinically significant change in the bone conduction threshold (BCT, 10 to 20 dB), and the control/standard used for comparison. In stereotactic radiosurgery, SRS, or HFSRT, hearing status is more commonly evaluated using the Gardner-Robertson scale, which is based on both PTA and speech discrimination. Hearing loss after SRS/HFSRT may be characterized by changes in Gardner-Robertson hearing grade or retention of serviceable hearing (i.e., functional hearing with the aid of a hearing aid) or any measurable hearing. In addition, the length of follow-up will influence reported hearing loss, as deficits may develop more rapidly following single-fraction SRS than HFSRT, and hearing loss increases over time in both situations.
Challenges Defining Volumes. Contouring of the acoustic nerve and brainstem is best accomplished on high-resolution, contrast-enhanced T1-weighted and fast imaging with steady-state precession MRI. The cochlea and associated bony anatomy are better delineated on fine-cut (≤1 mm slice thickness) CT scans. Both the acoustic nerve and cochlea are small structures, and the dose gradient at the latter structure is often quite steep. Moreover, the acoustic nerve anatomy is distorted by the tumor, significantly increasing its apparent diameter. Thus, the dose to these structures is typically characterized by an average or maximum dose, rather than a dose–volume distribution. In many studies, the primary dose metric was the dose to the acoustic neuroma, rather than the normal tissue structures per se, which is not unreasonable as the dose to the tumor appears to be correlated with the dose received by the acoustic nerve.45
Dose/Volume/Toxicity Data. SNHL at key frequencies following radiotherapy for head and neck cancer with conventionally fractionated radiotherapy134–135,136–139,140,141 is summarized in Figure 13.4. Pan et al.135 prospectively studied the BCT in 31 patients after unilateral RT with standard fractionation using changes seen in the contralateral ear as standard (0.25 to 8 kHz). Changes in BCT >10 dB were rarely observed unless the corresponding difference in mean cochlear dose was >45 Gy. The dose to the contralateral cochlea ranged from 0.5 to 31.3 Gy (mean, 4.2 Gy). Honore et al.140 retrospectively estimated mean cochlear doses in 20 patients treated with radiation therapy for head-and-neck cancer.142–144 A dose–response relationship was observed at 4 kHz, but not at other frequencies.
FIGURE 13.4. Mean dose response for sensorineural hearing loss (SNHL) at (A) 4 kHz,135,136–137,139,140 (B) 0.5–2 kHz,135,136–137,139 and (C) all frequencies141 (0.25–12 kHz). (From Bhandare N, et al. Radiation therapy and hearing loss. Int J Radiat Oncol Biol Phys 2010;76[3 Suppl]:S50–S57.)
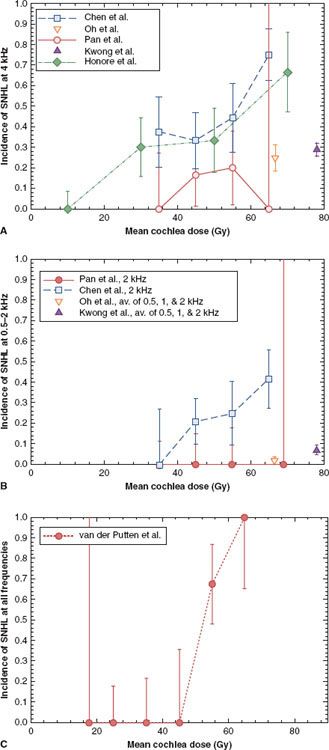
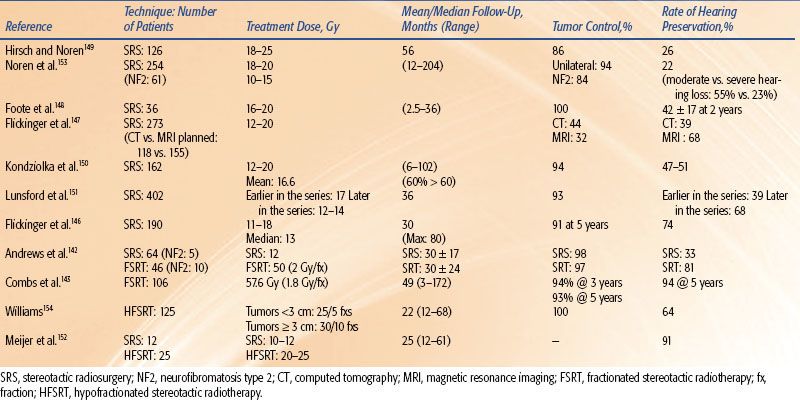
TABLE 13.5 HEARING PRESERVATION IN STEREOTACTIC RADIOSURGERY AND RADIOTHERAPY
Chen et al.136 retrospectively studied 22 patients treated with RT for nasopharyngeal cancer (with fraction sizes from 1.6 to 2.3 Gy and concurrent/adjuvant chemotherapy) and studied BCT 12 to 79 months post-RT. A significant increase in hearing loss (change in BCT of >20 dB at one frequency or >10 dB at two consecutive frequencies) was observed for all frequencies (0.5 to 4 kHz) when the mean dose received by the cochlea exceeded 48 Gy. Van der Putten et al.141 retrospectively evaluated changes in BCT after head and neck radiotherapy in 21 patients with unilateral parotid tumors (fraction sizes 1.8 to 3.0 Gy). Using the contralateral ear as a control, SNHL, defined as a >15 db difference in BCT at three or more frequencies between 0.25 and 12 kHz, was seen when mean doses received by the cochlea were >50 Gy. Oh139 prospectively studied changes in BCT (0.25 to 4 kHz) post-RT in 25 patients with nasopharyngeal cancer (fraction size 2 Gy). In that study, inner ear doses were high (63 to 70 Gy), and hearing loss (a >15 db decrease in BCT from baseline) correlated with total dose received by the inner ear.
Table 13.5 summarizes the reported incidence of hearing loss for single-fraction SRS and fractionated stereotactic radiotherapy (FSRT) in the treatment of vestibular schwannomas.142,143,145–154 The range of hearing loss reported is broad, in part due to the variation in the definition of hearing preservation and the length of follow-up. Nonetheless, several studies suggest that there is a relationship between the volume/length of acoustic nerve irradiated and/or the dose to the nerve and cochlea with hearing loss. In a study of 82 patients treated to a marginal dose of 12 Gy in single-fraction SRS, Massager et al.155 found that increased intracanalicular tumor volume (<100 vs. ≥100 mm3) and volume-averaged intracanalicular dose were significant predictors of increased hearing loss. Pollock et al. reported that hearing preservation was more likely when tumors <3 cm versus >3 cm in diameter were treated with single-fraction SRS.156
Niranjan et al.157 found that the dose extending beyond the intracanalicular tumor volume and the prescription dose were the most important factors adversely affecting hearing. In that study, serviceable hearing was preserved in 100% of patients treated with a marginal tumor dose of ≤14 Gy in single-fraction SRS versus 20% in those receiving >14 Gy. Similarly, Kondziolka et al. and Lunsford et al. reported significantly improved hearing preservation rates when the marginal dose was reduced from 16 to 20 Gy to 12 to 14 Gy.150,151
Several studies suggest that the rate of hearing preservation is improved with FSRT versus single-fraction SRS.142–144 However, there is an issue of selection bias in that patients are frequently selected for fractionated treatment because their hearing is good. Meijer et al.152 found no significant difference in hearing preservation in acoustic neuroma patients treated with four to five fractions of 5 Gy HFSRT vs. 10 to 12.5 Gy single-fraction SRS (61% vs. 75%), though trigeminal nerve preservation was significantly higher with HFSRT (98% vs. 92%).
Factors Affecting Risk. While the mean total dose to the cochlea during fractionated radiation therapy to the head and neck and to the acoustic nerve in SRS for vestibular schwannomas is a dominant factor in affecting hearing loss postradiotherapy (see earlier), the effects of fraction size and twice- versus once-daily treatment are not well characterized. Cisplatin, administered during or after radiotherapy, may exacerbate SNHL.136,158,159
Mathematic/Biologic Models. The results of SNHL in conventionally fractionated radiotherapy of head and neck cancers have been fit using multivariate regression models, as discussed in the QUANTEC paper.134
Special Situations. The QUANTEC analysis applies only to adult patients; hearing loss after radiotherapy may be more problematic in pediatric patients, particularly in combination with chemotherapy.160 In patients with neurofibromatosis type 2, treatment of vestibular schwannomas by SRS appears to result in increased hearing loss, as well as poorer tumor control, compared to patients with sporadic tumors.161–163
Recommended Dose–Volume Limits. For conventionally fractionated RT, the mean dose to the cochlea should be limited to ≤45 Gy (or more conservatively ≤35 Gy) to minimize the risk for SNHL.134 Because a threshold for SNHL has not been established, the dose to the cochlea should be kept as low as possible to prevent hearing loss. To minimize hearing loss while maintaining adequate control of vestibular schwannomas, the QUANTEC authors recommend a marginal dose of 12 to 14 Gy for single-fraction SRS.127,134,164 Though data for hypofractionated regimens are quite limited, the authors speculate that a total dose of 21 to 30 Gy, presumably delivered in three 7-Gy, five 5-Gy, or ten 3-Gy fractions, would provide an acceptable balance of hearing preservation and tumor control.134
Future Studies. The effects of concurrent chemotherapy in radiotherapy for head and neck cancer, of acoustic nerve length irradiated and fractionation in vestibular schwannomas, and of the absolute dose to the cochlea in all settings would benefit from prospective, multi-institutional studies.
Toxicity Scoring Criteria. An audiometric evaluation should be performed for both ears immediately before radiotherapy and biannually thereafter. The QUANTEC authors recommend that a “clinically significant hearing loss” should be defined as an increase in the threshold of 10 dB in postradiotherapy BCT or a decline of 10% in a speech discrimination evaluation.134
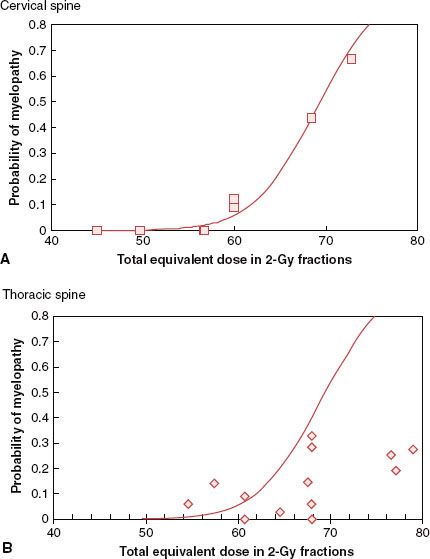
FIGURE 13.5. Incidence of transverse myelopathy from selected studies. A: Cervical cord: data for selected studies168,171–174 shown by  with probability of myelopathy corrected for estimated survival and solid line fit to these data by the method of Schultheiss. B: Thoracic cord: data for selected studies175–186 shown by ◊ with probability of myelopathy corrected for estimated survival. Solid line is the best fit to the cervical cord data, as thoracic cord data were insufficient to permit an adequate fit. (Adapted from Schultheiss TE. The radiation dose-response of the human spinal cord. Int J Radiat Oncol Biol Phys 2008;71(5):1455–1459.)