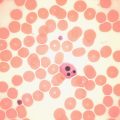
Chapter Outline
Investigation of haemolytic anaemia 215
Plasma haemoglobin 216
Sample collection 216
Peroxidase method 216
Spectrophotometric method 216
Normal range 217
Significance of increased plasma haemoglobin 217
Serum haptoglobin 217
Serum haemopexin 220
Examination of plasma (or serum) for methaemalbumin 220
Demonstration of haemosiderin in urine 221
Method 221
Chemical tests of haemoglobin catabolism 221
Serum bilirubin 221
Urobilin and urobilinogen 222
Qualitative test for urobilinogen and urobilin in urine 222
Porphyrins 222
Demonstration of porphobilinogen in urine 223
Aminolaevulinic acid 223
Demonstration of porphyrins in urine 223
Spectroscopic examination of urine for porphyrins 223
Abnormal haemoglobin pigments 225
Spectroscopic examination of blood for methaemoglobin and sulphaemoglobin 225
Measurement of methaemoglobin 225
Screening method for sulphaemoglobin 226
Demonstration of carboxyhaemoglobin 226
Identification of myoglobin in urine 227
Red cells are typically removed from the circulation at the end of their lifespan of about 120 days. A shortened lifespan due to premature destruction may lead to haemolytic anaemia when bone marrow activity cannot compensate for the erythrocyte loss. The causes can be divided into three groups:
- 1.
Defects within red cells from dysfunction of enzyme- controlled metabolism, abnormal haemoglobins or thalassaemias
- 2.
Loss of structural integrity of red cell membrane and cytoskeleton in hereditary spherocytosis, hereditary elliptocytosis, paroxysmal nocturnal haemoglobinuria (PNH) and immune and drug-associated antibody damage
- 3.
Damage by extrinsic factors such as mechanical trauma, microangiopathic conditions (including thrombotic thrombocytopenic purpura) and chemical toxins.
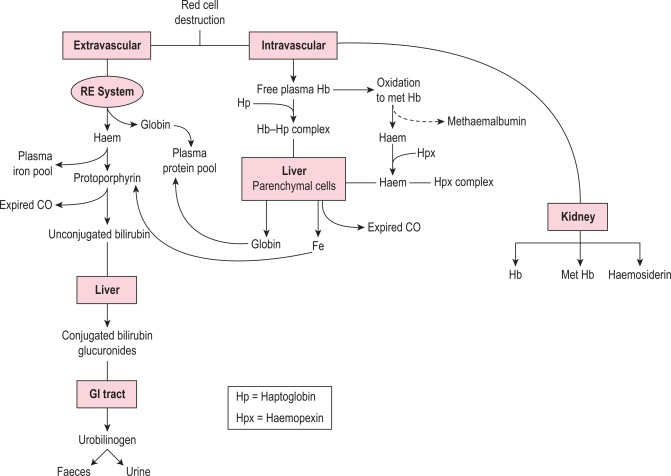
At the end of a normal lifespan, red cells are destroyed within the reticuloendothelial system in the spleen, liver and bone marrow. In some haemolytic anaemias, the haemolysis occurs predominantly in the reticuloendothelial system (extravascular) and the plasma haemoglobin concentration is barely increased. In other disorders a major degree of haemolysis takes place within the bloodstream (intravascular haemolysis), the plasma haemoglobin concentration increases substantially and in some cases the amount of haemoglobin liberated is sufficient to lead to its being excreted in the urine (haemoglobinuria). However, there is often a combination of both mechanisms. The two pathways by which haemoglobin derived from effete red cells is metabolised are illustrated in Figure 11-1 .
Investigation of haemolytic anaemia
The cardinal signs of haemolysis in adults (anaemia, jaundice and reticulocytosis) may also be seen in infants resulting from the shift from γ to β globin production, changes in glycolytic enzyme activities and reduction or absence of haptoglobins during the first month or so of life, and so it is essential to compare results with age-matched sample(s) or age-specific reference values.
The clinical and laboratory associations of increased haemolysis reflect the nature of the haemolytic mechanism, where the haemolysis is taking place and the response of the bone marrow to the resultant anaemia, namely erythroid hyperplasia and reticulocytosis.
The investigation of patients suspected of suffering from a haemolytic anaemia comprises several distinct stages: recognising the existence of increased haemolysis, determining the haemolytic mechanism and making a precise diagnosis. In practice, the procedures are often telescoped because the diagnosis in some instances may be obvious to the experienced observer from a glance down the microscope at the patient’s blood film.
The following practical scheme of investigation is recommended. In each group, tests are listed in order of importance and practicability.
Is there evidence of increased haemolysis?
- 1.
Estimation of haemoglobin concentration (Hb); reticulocyte count; inspection of a stained blood film for the presence of spherocytes, elliptocytes, irregularly contracted cells, schistocytes or agglutination (see Chapters 3 and 5 )
- 2.
Tests for increased unconjugated serum bilirubin and urinary urobilinogen excretion; measurement of haptoglobin or haemopexin
- 3.
Detection of urinary haemoglobin or haemosiderin
What is the haemolytic mechanism?
- 1.
Direct antiglobulin test (DAT) with broad-spectrum antiserum
- 2.
Osmotic fragility and glycerol lysis test
- 3.
Measurement of haemoglobin concentration in urine and plasma; Schumm test
What is the precise diagnosis?
- 1.
If a hereditary haemolytic anaemia is suspected:
- a.
Eosin-5-maleimide (EMA) dye binding test or osmotic-fragility determination after 24 h of incubation at 37 °C; screening test for red cell glucose-6-phosphate dehydrogenase (G6PD) deficiency (or quantitative assay if reticulocytosis is present); red cell pyruvate kinase assay; assay of other red cell enzymes involved in glycolysis; estimation of red cell glutathione (see Chapter 12 )
- b.
Estimation of percentage of haemoglobins A 2 and F; high performance liquid chromatography or electrophoresis for an abnormal haemoglobin; tests for sickling; tests for an unstable haemoglobin; blood count parameters, especially mean cell volume (MCV), mean cell haemoglobin (MCH) and mean cell haemoglobin concentration (MCHC); gene analysis (see Chapter 8 )
- c.
Examination of the proteins of the red cell membrane and cytoskeleton (e.g. spectrin) by gel electrophoresis and by specific radioimmunoassay
- a.
- 2.
If an autoimmune acquired haemolytic anaemia is suspected:
- a.
Direct antiglobulin test using anti-immunoglobulin and anticomplement sera; tests for autoantibodies in the patient’s serum; titration of cold agglutinins; Donath–Landsteiner test; electrophoresis of serum proteins; demonstration of thermal range of autoantibodies; tests for agglutination and/or lysis of enzyme-treated cells by autoantibodies; tests for lysis of normal cells by autoantibodies
- a.
- 3.
If a drug-induced haemolytic anaemia is suspected:
- a.
Screening test for red cell G6PD; glutathione stability test; staining for Heinz bodies; identification of methaemoglobin (Hi) and sulphaemoglobin (SHb); tests for drug-dependent antibodies
- a.
- 4.
If mechanical stress is suspected:
- a.
Red cell morphology; platelet count; renal function tests; coagulation screen; fibrinogen assay; test for fibrinogen/fibrin degradation products (see Chapters 5 and 18 )
- a.
- 5.
In obscure cases:
- a.
Investigations for PNH, such as acidified serum test (Ham test), sucrose lysis test, flow cytometric immunophenotyping for erythrocyte and neutrophil glycosylphosphatidylinositol (GPI)-linked antigens (see Chapter 13 )
- b.
Measurement of lifespan of patient’s red cells (see Chapter 17 )
- c.
If splenectomy is contemplated, determination of sites of haemolysis by radionuclide imaging (see Chapter 17 )
- a.
Plasma haemoglobin
Methods for estimation of plasma haemoglobin concentration are based on (1) a peroxidase reaction and (2) direct measurement by spectrometry. In the peroxidase method, the catalytic action of haem-containing proteins brings about the oxidation of tetramethylbenzidine by hydrogen peroxide to give a green colour, which changes to blue and finally to reddish violet. The intensity of reaction may be compared using a spectrometer with that produced by solutions of known concentration. Methaemoglobin and haemoglobin are measured together.
A pink tinge to the plasma is detectable by eye when the concentration is higher than 200 mg/l. When the concentration is > 50 mg/l, it can be measured as haemiglobincyanide (HiCN) or oxyhaemoglobin by a spectrometer at 540 nm (p. 21). Lower concentrations can also be measured reliably provided that the spectrometer plots of concentration/absorbance give a linear slope passing through the origin. This facility is provided by the Low Hb HemoCue (Hemocue Ltd, www.hemocue.com ), which can reliably measure plasma haemoglobin at a concentration of 100 mg/l or higher.
Sample collection
Every effort must be made to prevent haemolysis during the collection and manipulation of the blood. For this, it may be preferable to use a syringe rather than an evacuated tube system. A clean venepuncture is essential; a plastic syringe and relatively wide-bore needle should be used. When the required amount of blood has been withdrawn, the needle should be detached with care and 9 volumes of blood should be added to 1 volume of 32 g/l sodium citrate.
Peroxidase method
The test is now rarely performed and readers are referred to previous editions of this book.
Spectrophotometric method
Red cells from a normal ethylenediaminetetra-acetic acid (EDTA)-anticoagulated blood sample should be washed three times in isotonic saline (0.15 mol/l). Lyse 1 volume of washed packed red cells in 2 volumes of water. Alternatively, lyse by freezing and thawing. Centrifuge the haemolysate at 3000 rpm (1200 g ) for 30 min and transfer the clear solution to a clean tube. Adjust the haemoglobin concentration to 80 g/l.
Dilute 1 in 100 with phosphate buffer, pH 8, to obtain a concentration of 800 mg/l. By six consecutive double dilutions with phosphate buffer, make a set of seven lysate standards with values from 800 to 12.5 mg/l.
Read the absorbance of each solution at 540 nm, with water as a blank. Prepare a calibration graph by plotting the readings of absorbance (on y axis) against haemoglobin concentration (on x axis) on arithmetic graph paper and draw the slope. Check that the slope is linear.
Read the absorbance of the plasma directly at 540 nm with a water blank and read the haemoglobin concentration from the calibration graph. If absorbance is greater than the maximum value plotted on the graph, repeat the reading with a sample diluted with buffer.
When using the Low Hb HemoCue haemoglobinometer, fill the special cuvette with plasma and carry out the test in accordance with the instructions that are provided.
Normal range
The normal range is 10 to 40 mg/l.
Significance of increased plasma haemoglobin
Haemoglobin liberated by the intravascular or extravascular breakdown of red cells interacts with plasma haptoglobin to form a haemoglobin–haptoglobin complex, which, because of its size, does not undergo glomerular filtration, but it is removed from the circulation by – and is degraded in – reticuloendothelial cells. Haemoglobin in excess of the capacity of haptoglobin to bind it passes into the glomerular filtrate; it is then partly excreted in the urine in an uncomplexed form, resulting in haemoglobinuria, and partly reabsorbed by the proximal glomerular tubules where it is broken down into haem, iron and globin. The iron is retained in the cells and eventually lost in the urine (as haemosiderin). The haem and globin are reabsorbed into the plasma.
The haem complexes with albumin forming methaemalbumin and with haemopexin (p. 220); the globin competes with haemoglobin to form a complex with haptoglobin. Plasma haemoglobin concentration is further increased in haemolytic anaemias when haemolysis is sufficiently severe for the available haptoglobin to be fully bound. The highest levels are found when haemolysis is predominantly intravascular. Thus marked haemoglobinaemia, with or without haemoglobinuria, may be found in PNH, paroxysmal cold haemoglobinuria, cold-haemagglutinin syndromes, blackwater fever, march haemoglobinuria and other mechanical haemolytic anaemias (e.g. that after cardiac surgery). In warm autoimmune haemolytic anaemia, sickle cell anaemia and severe β thalassaemia, the plasma haemoglobin concentration may be slightly or moderately increased, but in hereditary spherocytosis, in which haemolysis occurs predominantly in the spleen, the levels are normal or only very slightly increased.
Haem within the proximal tubular epithelium undergoes further degradation to bilirubin with liberation of iron, some of which is retained intracellularly and incorporated into ferritin and haemosiderin. When haemolysis is severe, the haemoglobin that appears in the glomerular filtrate leads to an accumulation of intracellular haemosiderin in the glomerular tubular cells; when these cells slough, haemosiderin appears in the urine (p. 221).
The presence of excess haemoglobin in the plasma is a reliable sign of intravascular haemolysis only if the observer can be sure that the lysis has not been caused during or after the withdrawal of the blood. It is also necessary to exclude colouring of the plasma from certain foods and food additives.
Increased levels may occur as a result of violent exercise, as well as occurring in runners and joggers as a result of mechanical trauma caused by continuous impact of the soles of the feet on hard ground.
Serum haptoglobin
Haptoglobin is a glycoprotein that is synthesised in the liver. It consists of a pair of α chains and a pair of β chains. Following haemolysis, free haemoglobin readily dissociates into dimers of α and β chains; the α chains bind avidly with the β chains of haptoglobin in plasma or serum to form a complex that can be differentiated from free haemoglobin by column chromatographic separation or by its altered rate of migration in the α 2 position on electrophoresis.
Direct measurement of haptoglobin is also possible by turbidimetry or nephelometry and by radial immunodiffusion. The methods described below are cellulose acetate electrophoresis and radial immunodiffusion.
Electrophoretic method ,
Principle
Known amounts of haemoglobin are added to serum. The haemoglobin–haptoglobin complex is separated by electrophoresis on cellulose acetate; the presence of bound and free haemoglobin is identified in each sample and the amount of haptoglobin is estimated by noting where free haemoglobin appears.
Reagents
Buffer (pH 7.0, ionic strength 0.05)
Na 2 HPO 4 .H 2 O 7.1 g/l, 2 volumes; NaH 2 PO 4 .H 2 O 6.9 g/l, 1 volume. Store at 4 °C.
Haemolysates
Red cells from a normal EDTA-anticoagulated blood sample are washed three times in isotonic saline (0.15 mol/l). Lyse 1 volume of washed packed red cells in 3 volumes of water. Alternatively, lyse by freezing and thawing. Centrifuge the haemolysate at 3000 rpm (1200 g ) for 30 min and transfer the clear solution to a clean tube. Adjust the Hb to 30 g/l with water and dilute this preparation further with water to obtain a batch of solutions with Hb of 2.5, 5, 10, 20 and 30 g/l. These solutions are stable at 4 °C for several weeks.
Stain
Dissolve 0.5 g of o -dianisidine (3,3′-dimethoxybenzidine) in 70 ml of 95% ethanol; prior to use, add together 10 ml of acetate buffer, pH 4.7 (sodium acetate 2.92 g, glacial acetic acid 1 ml, water to 1 litre), 2.5 ml of 3% (10 volumes) H 2 O 2 and water to 100 ml.
Clearing solution
Glacial acetic acid 25 ml, 95% ethanol 75 ml.
Acetic acid rinse
Glacial acetic acid 50 ml/l.
Method
Serum is obtained from blood allowed to clot undisturbed at 37 °C. As soon as the clot starts to retract, remove the serum with a pipette and centrifuge it to rid it of suspended red cells. The serum may be stored at − 20 °C until used.
Mix well 1 volume of each of the diluted haemolysates with 9 volumes of serum. Allow to stand for 10 min at room temperature.
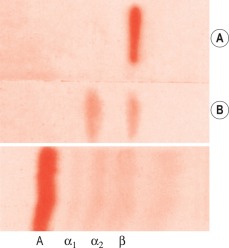
Impregnate cellulose acetate membrane filter strips (12 × 2.5 cm) in buffer solution and blot to remove all obvious surface fluid. Apply 0.75 ml samples of the serum–haemolysate mixtures across the strips as thin transverse lines. As controls, include strips with serum alone and haemoglobin alone. Electrophorese at 0.5 mA/cm width. Good separation patterns about 5–7 cm in length should be obtained in 30 min (see Fig. 11-2 ).
After electrophoresis is completed, immerse the membranes in freshly prepared o -dianisidine stain for 10 min. Then rinse with water and immerse in 50 ml/l acetic acid for 5 min. Remove the membranes and place in 95% ethanol for exactly 1 min. Transfer the membranes to a tray containing freshly prepared clearing solution and immerse for exactly 30 s. While they are still in the solution, position the membranes over a glass plate placed in the tray. Remove the glass plate with the membranes on it, drain the excess solution from the membranes, transfer the glass plate to a ventilated oven preheated to 100 ° C and allow the membranes to dry for 10 min.
Interpretation
The patterns of free haemoglobin and haemoglobin–haptoglobin complex migration are shown in Figure 11-2 . The complex appears in the α 2 globulin position. When there is more haemoglobin than can be bound to the haptoglobin, the free haemoglobin migrates in the β globulin position. The amount of haptoglobin present in the serum is determined semiquantitatively as between the lowest concentration of haemoglobin, which shows only a free haemoglobin band, and the adjacent strip, which shows a band of haemoglobin–haptoglobin complex. In the total absence of haptoglobin, a haemoglobin band alone will be seen, even at 2.5 g/l. In severe intravascular haemolysis with depleted haptoglobin, some of the haem may bind in the β globulin position to haemopexin (see below) and some to serum albumin to form methaemalbumin.
The concentration of haptoglobin can be determined quantitatively with a densitometer. The test is carried out as described earlier, but only one haemolysate is required with an Hb of 30–40 g/l. After the plate has cooled, the membranes are scanned by a densitometer at 450 nm with a 0.3-mm slit width. The density of the haptoglobin band is calculated as a fraction of the total Hb in the electrophoretic strip:
Haptoglobin g / 1 = Haptoglobin fraction × Hb g / 1
Radial immunodiffusion method
Principle
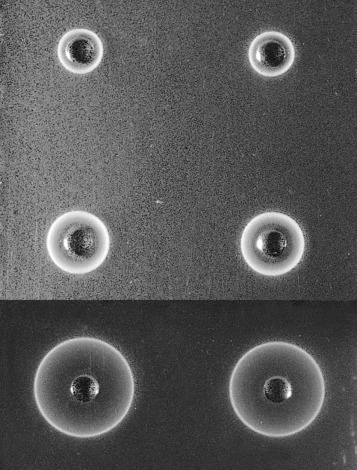
The test serum samples and reference samples of known haptoglobin concentration are dispensed into wells in a plate of agarose gel containing a monospecific antiserum to human haptoglobin. Precipitation rings form by the reaction of haptoglobin with the antibody; the diameter of each ring is proportional to the concentration of haptoglobin in the sample.
Reagents
Phosphate buffer, iso-osmotic, pH 7.4:
(A) NaH 2 PO 4 ·2H 2 O (150 mmol/l) − 23.4 g/l
(B) NaH 2 PO 4 (150 mmol/l) − 21.3 g/l.
Add 18 ml reagent A to 82 ml reagent B.
Single diffusion plates *
* Gel plates containing the antiserum are available commercially (e.g. The Binding Site Group Ltd, www.thebindingsite.com/radial-immunodiffusion .
Dissolve agarose (20 g/l) in boiling phosphate buffered water, pH 7.4. Allow to cool to 50 °C. Add 5% sheep or goat antihuman haptoglobin antiserum diluted in buffered water, pH 7.4. Mix well but without creating bubbles. Pour the gel onto thin plastic trays (plates) to a thickness of < 1 mm. After the gel has set, cut out a series of wells about 2 mm in diameter, about 2 cm apart. Extract the core by using a pipette tip with a negative pressure pump. Cover the plates with fitted lids and store in sealed packets at 4 °C until used.
Reference sera
Preparations of human serum with stated haptoglobin concentration are available commercially (e.g. from www.thermofisher.com/uk/en/home/brands/invitrogen.html or www.sigmaaldrich.com ). They should be stored at 4 °C.
Test serum
Test serum can be kept at 4 °C for 2–3 days, but if it is not used within this time, store at − 20 °C. Thaw completely and mix well immediately before use.
Method
Allow the plate (in its sealed packet) and the sera to equilibrate at room temperature for 15 min. Remove the lid from the plate. Check for moisture; if present, allow to evaporate. Add 5 μl of each serum into one of the wells in the plate. Stand for about 10 min to ensure that the serum is completely absorbed into the gel. Then cover the plate, return it to its container and reseal the packet. Leave on a level surface at room temperature for 18 h. From measurements of the reference sera, construct a reference curve on log-linear graph paper by plotting haptoglobin concentration on the vertical axis (logarithmic scale) and the diameter of the rings on the horizontal scale (linear scale). Measure the diameter of the precipitation ring formed by the test serum and express concentration in g/l ( Fig. 11-3 ).
Normal ranges
By direct measurement results are expressed as haptoglobin concentration; slightly different reference values have been reported for the different methods:
RID: 0.8 to 2.7 g/l
Nephelometry: 0.3 to 2.2 g/l
Turbidimetry: 0.5 to 1.6 g/l
When measured as haemoglobin-binding capacity, in normal sera, haptoglobin will bind 0.3–2.0 g/l of haemoglobin. With this wide range of values there are no obvious sex differences, but in both men and women levels increase after the age of 70 years.
Significance
Haptoglobin begins to be depleted when the daily haemoglobin turnover exceeds about twice the normal rate. This occurs irrespective of whether the haemolysis is predominantly extravascular or intravascular; but rapid depletion, often with the formation of methaemalbumin, occurs as a result of small degrees of intravascular haemolysis, even when the daily total turnover is not increased appreciably above normal. Low concentrations of haptoglobin, in the absence of increased haemolysis, may be found in hepatocellular disease and are characteristic of congenital anhaptoglobinaemia, which is uncommon except in populations of African origin. Low concentrations may also be found in megaloblastic anaemias, probably because of increased haemolysis and ineffective erythropoiesis, and following haemorrhage into tissues.
The haptoglobin–haemoglobin complex is cleared by the reticuloendothelial system, mainly in the liver. The rate of removal is influenced by the concentration of free haemoglobin in the plasma: at levels < 10 g/l, the clearance T 1/2 is 20 min; at higher concentrations, clearance is considerably slower.
Increased haptoglobin concentrations may be found in pregnancy, chronic infections, malignancy, tissue damage, Hodgkin lymphoma, rheumatoid arthritis, systemic lupus erythematosus and biliary obstruction and as a consequence of steroid therapy or the use of oral contraceptives. Under these circumstances, a normal haptoglobin concentration does not exclude haemolysis.
Serum haemopexin
Haemopexin is a β 1 glycoprotein of molecular weight 70 000, synthesised in the liver. It has a transport function. Haem derived from haemoglobin, which fails to bind to haptoglobin, complexes with either haemopexin or albumin. The former has a much higher affinity and only when all the haemopexin has been used up will the haem combine with albumin to form methaemalbumin. The haem–haemopexin complex is eliminated from the circulation (e.g. by the liver Kupffer cells) over a period of several hours, depleting the haemopexin.
Haem binds in a 1:1 molar ratio to haemopexin; 6 μg/ml of free haem is required to saturate the normal binding levels of haemopexin. In normal adults of both sexes, its concentration is 0.5–1.15 g/l (by nephelometry) or 0.5–1.5 g/l (by electrophoresis); there is a lower concentration in newborn infants, about 0.3 g/l, but adult levels are reached by the end of the first year of life. In severe intravascular haemolysis, when haptoglobin is depleted, haemopexin is low or absent and plasma methaemalbumin is elevated. With less severe haemolysis, although haptoglobin is likely to be reduced or absent, haemopexin may be normal or only slightly lowered. Haemopexin seems to be disproportionately low in thalassaemia major, and low levels may be found in certain pathological conditions other than haemolytic disease, namely renal and liver diseases. The concentration is increased in diabetes mellitus, infections and carcinoma.
Haemopexin can be measured by the same methods as for haptoglobin with radial immunodiffusion or electrophoresis.
Examination of plasma (or serum) for methaemalbumin
A simple but not very sensitive method is to examine the plasma using a hand spectroscope.
Free the plasma from suspended cells and platelets by centrifuging at 1200–1500 g for 15–30 min. Then view it in bright daylight with a hand spectroscope using the greatest possible depth of plasma consistent with visibility. Methaemalbumin gives a rather weak band in the red (at 624 nm) ( Fig. 11-4 ). Because oxyhaemoglobin is usually present as well, its characteristic bands in the yellow–green may also be visible. The position of the methaemalbumin absorption band in the red can be readily differentiated from that of Hi by means of a reversion spectroscope.

Presumptive evidence of the presence of small quantities of methaemalbumin, giving an absorption band too weak to recognise, can be obtained by extracting the pigment by ether and then converting it to an ammonium haemochromogen, which gives a more intense band in the green (Schumm test).
Schumm test
Method
Cover the plasma (or serum) with a layer of ether. Add a one-tenth volume of saturated yellow ammonium sulphide and mix it with the plasma. Then view it with a hand spectroscope. If methaemalbumin is present, a relatively intense narrow absorption band at 558 nm will be seen in the green.
Significance of methaemalbuminaemia
Methaemalbumin is found in the plasma when haptoglobin is absent in haemolytic anaemias in which lysis is predominantly intravascular. It is a haem–albumin compound formed subsequent to the degradation of haemoglobin liberated into plasma. It remains in the circulation for several days or until the haem is transferred from albumin to the more highly avid haemopexin.
Quantitative estimation by spectrometry
To 2 ml of plasma (or serum) add 1 ml of iso-osmotic phosphate buffer, pH 7.4. Centrifuge the mixture for 30 min at 1200–1500 g and measure its absorbance in a spectrophotometer at 569 nm. Add about 5 mg of solid sodium dithionite to the diluted plasma. Shake the tube gently to dissolve the dithionite and leave for 5 min to allow complete reduction of the methaemalbumin. Remeasure the absorbance. The difference between the two readings represents the absorbance due to methaemalbumin; its concentration can be read from a calibration graph.
Calibration graph
Prepare solutions containing 10 to 100 mg/l methaemalbumin by dissolving appropriate amounts of haemin (bovine or equine) ( www.sigmaaldrich.com ) in a minimum volume of 40 g/l human serum albumin. Measure the absorbance of each solution in a spectrophotometer at 569 nm and draw a graph from the figures obtained.
Demonstration of haemosiderin in urine
Method
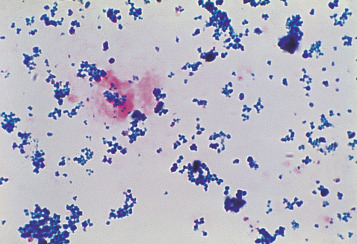
Centrifuge 10 ml of urine at 1200 g for 10–15 min. Transfer the deposit to a slide, spread out to occupy an area of 1–2 cm and allow to dry in the air. Fix by placing the slide in methanol for 10–20 min and then stain by the method used to stain bone marrow films for haemosiderin (p. 313). Haemosiderin, if present, appears in the form of isolated or grouped blue-staining granules, usually from 1 to 3 μm in size ( Fig. 11-5 ); they may be both intracellular and extracellular. If haemosiderin is present in small amounts and especially if distributed irregularly on the slide or if the findings are difficult to interpret, the test should be repeated on a fresh sample of urine collected into an iron-free container and centrifuged in an iron-free tube. (For the preparation of iron-free glassware: wash thoroughly in a detergent solution, then soak in 3 mol/l HCl for 24 h; finally, rinse in deionised, double-distilled water.)
Significance of haemosiderinuria
Haemosiderinuria is a sequel to the presence of haemoglobin in the glomerular filtrate. It is a valuable sign of intravascular haemolysis because the urine will be found to contain iron-containing granules even if there is no haemoglobinuria at the time. However, haemosiderinuria is not found in the urine at the onset of a haemolytic attack even if this is accompanied by haemoglobinaemia and haemoglobinuria because the haemoglobin has first to be absorbed by the cells of the renal tubules. The intracellular breakdown of haemoglobin liberates iron, which is then lost in the urine. Haemosiderinuria may persist for several weeks after a haemolytic episode.
Chemical tests of haemoglobin catabolism
Measurement of serum or plasma bilirubin, urinary urobilin and faecal urobilinogen can provide important information in the investigation of haemolytic anaemias. In this section, their interpretation and significance in haemolytic anaemias will be described, but because currently the tests are seldom performed in a haematology laboratory, for details of the techniques readers are referred to textbooks of clinical chemistry.
Serum bilirubin
Bilirubin is present in serum in two forms: as unconjugated prehepatic bilirubin and bilirubin conjugated to glucuronic acid. Normally, the serum bilirubin concentration is < 17 μmol/l (10 mg/l) and mostly unconjugated. As illustrated in Figure 11-1 , when there is increased red cell destruction, the protoporphyrin gives rise to an increased amount of unconjugated bilirubin and carbon monoxide. The bilirubin is then conjugated in the liver and this bilirubin glucuronide is excreted into the intestinal tract. Bacterial action converts bilirubin glucuronide to urobilin and urobilinogen. In haemolytic anaemias, the serum bilirubin usually lies between 17 and 50 μmol/l (between 10 and 30 mg/l) and most is unconjugated. Sometimes the level may be normal, despite a considerable increase in haemolysis. Levels > 85 μmol/l (50 mg/l) and/or a large proportion of conjugated bilirubin suggest liver disease or posthepatic obstruction.
In haemolytic disease of the newborn (HDN), the bilirubin level is an important factor in determining whether an exchange transfusion should be carried out because high values of unconjugated bilirubin are toxic to the brain at this age and can lead to kernicterus. In normal newborn infants, the level often reaches 85 μmol/l, whereas in infants with HDN, levels of 350 μmol/l are not uncommon and need to be urgently reduced by phototherapy or exchange transfusion. Moderately raised serum bilirubin levels are frequently found in dyserythropoietic anaemias (e.g. pernicious anaemia). Although part of the bilirubin comes from red cells that have circulated, a major proportion is derived from red cell precursors in the bone marrow that have failed to complete maturation (ineffective erythropoiesis).
Total bilirubin can be measured by direct reading spectrophotometry at 454 (or 461) and 540 nm; the former are the selected wavelengths for bilirubin, whereas the latter automatically corrects for any interference by free haemoglobin. The instrument can be calibrated with bilirubin solutions of known concentration or with a coloured glass standard. Another direct reading method is by reflectance photometry on a drop of serum that is added to a reagent film.
An alternative ‘wet chemistry’ method is by the reaction with aqueous diazotised sulphanilic acid. A red colour is produced, which is compared in a photoelectric colorimeter with that of a freshly prepared standard or read in a spectrophotometer at 600 nm. Only conjugated bilirubin reacts directly with this aqueous reagent; unconjugated bilirubin, which is bound to albumin, requires either the addition of ethanol to free it from albumin or an accelerator such as methanol or caffeine to enable it to react. A positive urine spot test indicates a condition in which there is an elevated serum conjugated bilirubin. There is also a simple optical method, the Lovibond Comparator (Tintometer Group, www.lovibond.com ), in which the colour produced by reaction with sulphanilic acid is matched against graded colour scales.
Bilirubin is destroyed by exposure to direct sunlight or any other source of ultraviolet (UV) light, including fluorescent lighting. Solutions are stable for 1–2 days if kept at 4 °C in the dark.
Urobilin and urobilinogen
Urobilin and its reduced form urobilinogen are formed by bacterial action on bile pigments in the intestine. The excretion of faecal urobilinogen in health is 50–500 μmol (30–300 mg) per day. It is increased in patients with a haemolytic anaemia. Quantitative measurement of faecal urobilinogen should, in theory, provide an estimate of the total rate of bilirubin production. This is, however, a crude method of assessing rates of haemolysis, and minor degrees are more reliably demonstrated by red cell lifespan studies. Urobilinogen excretion is also increased in dyserythropoietic anaemias such as pernicious anaemia because of ineffective erythropoiesis.
The amount of urobilinogen in the urine in health is up to 6.7 μmol (4 mg) per day. However, these measurements are method dependent, and laboratories should establish their own reference values. This is not a reliable index of haemolysis, as excessive urobilinuria can be a consequence of liver dysfunction as well as of increased red cell destruction.
For estimation in the faeces, the bile-derived pigments (stercobilin) are reduced to urobilinogen, which is extracted with water. The solution is then treated with Ehrlich’s dimethylaminobenzaldehyde reagent to produce a pink colour, which can be compared with either a natural or an artificial standard in a quantitative assay.
Qualitative test for urobilinogen and urobilin in urine
Schlesinger zinc test
The test is now rarely performed and readers are referred to previous editions of this book.
Urobilinogen can also be detected in freshly voided urine by commercially available reagent strip methods.
Porphyrins
Haem synthesis is initiated by succinyl coenzyme A and glycine, activated by the rate-limiting enzyme δ-aminolaevulinic (ALA)-synthase. ALA is the precursor of the porphyrins ( Fig. 11-6 ). The porphyrins of clinical importance in man are protoporphyrin, uroporphyrin and coproporphyrin together with their precursor ALA. Protoporphyrin is widely distributed in the body, and in addition to its main role as a precursor of haem in haemoglobin and myoglobin, it is a precursor of cytochromes and catalase. Uroporphyrin and coproporphyrin, which are precursors of protoporphyrin, are normally excreted in small amounts in urine and faeces. Red cells normally contain a small amount of coproporphyrin (5–35 nmol/l) and protoporphyrin (0.2–0.9 μmol/l). Deranged haem synthesis (e.g. in sideroblastic anaemias or lead toxicity) and iron deficiency anaemia result in an increased concentration of protoporphyrin in the red cells.
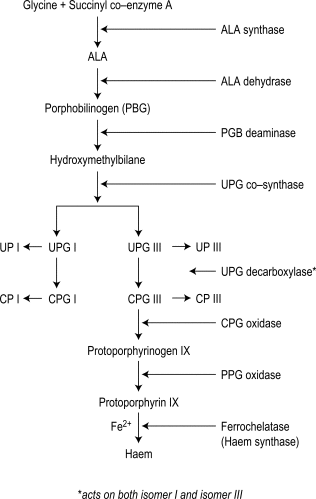
Appropriate tests are usually performed in clinical chemistry laboratories, including sophisticated methods for measuring red cell porphyrins, as described in an Association of Clinical Pathology Best Practice document. Simple qualitative screening tests for urinary porphobilinogen and urinary porphyrin are described later. Urinary porphobilinogen will help to diagnose the acute forms of porphyria, particularly when the patient is symptomatic and this test can lead to a definite diagnosis in a critical clinical situation.
Demonstration of porphobilinogen in urine
Principle
Ehrlich’s dimethylaminobenzaldehyde reagent reacts with porphobilinogen to produce a pink aldehyde compound, which can be differentiated from that produced by urobilinogen by the fact that the porphobilinogen compound is insoluble in chloroform.
Ehrlich’s reagent
Dissolve 0.7 g of p -dimethylaminobenzaldehyde in a mixture of 150 ml of 10 mol/l HCl and 100 ml of water.
Method
Specimens must be protected from light, and the test is best carried out on freshly passed urine. Mix a few ml of urine and an equal volume of Ehrlich’s reagent in a large test tube. Add 2 volumes of a saturated solution of sodium acetate. The urine should then have a pH of about 5.0, giving a red reaction with Congo red indicator paper.
If a pink colour develops in the solution, add a few ml of chloroform and shake the mixture thoroughly to extract the pigment. The colour due to urobilinogen or indole will be extracted by the chloroform, whereas that owing to porphobilinogen will not and remains in the supernatant aqueous fraction. A kit is available for a semiquantitative test using anion-exchange resin (Microgenics, ThermoFisher Scientific, www.thermofisher.com ). When present, the concentration of porphobilinogen in the urine can be measured quantitatively by a test kit method (Bio-Rad Laboratories, www.bio-rad.com/en-cn/sku/1876001-pbg-column-testporphobilinogen ) or by spectrophotometry at 555 nm.
Aminolaevulinic acid
When ALA is present in the urine, it can be concentrated with acetyl acetone. It then reacts with Ehrlich’s reagent in the same way as porphobilinogen to give a red solution with an absorbance maximum at 553 nm. It can be separated from porphobilinogen by ion-exchange resins and estimated quantitatively by a spectrometric method.
Demonstration of porphyrins in urine
Principle
Porphyrins exhibit pink-red fluorescence when viewed by UV light (at 405 nm). Uroporphyrin can be distinguished from coproporphyrin by the different solubilities of the two substances in acid solution.
Method
Mix 25 ml of urine with 10 ml of glacial acetic acid in a separating funnel and extract twice with 50 ml volumes of ether. Set the aqueous fraction (Fraction 1) aside. Wash the ether extracts in a separating funnel with 10 ml of 1.6 mol/l HCl and collect the HCl fraction (Fraction 2). View both fractions in UV light (at 405 nm) for pink-red fluorescence. Its presence in Fraction 1 indicates uroporphyrin; its presence in Fraction 2 indicates coproporphyrin. The presence of the porphyrins should be confirmed spectroscopically (described later).
If uroporphyrin has been demonstrated, the reaction can be intensified by the following procedure. Adjust the pH of Fraction 1 to 3.0–3.2 with 0.1 mol/l HCl and extract the fraction twice with 50 ml volumes of ethyl acetate. Combine the extracts and extract three times with 2 ml volumes of 3 mol/l HCl. View the acid extracts for pink-red fluorescence in UV light and spectroscopically for acid porphyrin bands.
Spectroscopic examination of urine for porphyrins
Spectroscopic examination of urine for porphyrins is carried out on extracts, made as described earlier, or on urine that is acidified with a few drops of 10 mol/l HCl. If porphyrins are present, a narrow band will appear in the orange at 596 nm, and a broader band will appear in the green at 552 nm (see Fig. 11-4 ). Qualitative tests are adequate for screening purposes. Accurate determinations require spectrophotometry or chromatography. Porphyrins are stable in EDTA-anticoagulated blood for up to 8 days at room temperature if protected from light. Urine should be collected in a brown bottle or, if in a clear container, kept in a light-proof bag. If the urine is rendered alkaline to pH 7–7.5 with sodium bicarbonate, porphyrins will not be lost for several days at room temperature.
Significance of porphyrins in blood and urine
Normal red cells contain < 650 nmol/l of protoporphyrin and < 64 nmol/l of coproporphyrin. Increased amounts are present during the first few months of life. At all ages, there is an increase in red cell protoporphyrin in iron deficiency anaemia or latent iron deficiency, lead poisoning, thalassaemia, some cases of sideroblastic anaemia and the anaemia of chronic disease. Zinc protoporphyrin is also elevated in these conditions (p. 179).
Normally, a small amount of coproporphyrin is excreted in the urine (< 430 nmol/day). This is demonstrable by the qualitative test described earlier, the intensity of pink-red fluorescence being proportional to the concentration of coproporphyrin. The excretion of coproporphyrin is increased when erythropoiesis is hyperactive (e.g. in haemolytic anaemias and polycythaemia), in pernicious anaemia and in sideroblastic anaemias. It is high in liver disease; renal impairment results in diminished excretion. In lead poisoning, there is an increase in red cell protoporphyrin and coproporphyrin, with excretion of exceptionally high levels of urinary ALA, coproporphyrin III and uroporphyrin I.
Normally, porphobilinogen cannot be demonstrated in urine and only traces of uroporphyrin (< 50 nmol/day), not detectable by the qualitative test described earlier, are present. ALA excretion is normally < 40 mmol/day; it is increased in lead poisoning.
The increase in urinary coproporphyrin excretion occurring in the previously mentioned conditions is known as porphyrinuria. There is no increase in uroporphyrin excretion. The porphyrias, however, are a group of disorders associated with abnormal porphyrin metabolism.
There are several forms of porphyria, caused by specific enzyme defects, each with a different clinical effect and pattern of excretion of porphyrin and precursors ( Table 11-1 ). The most common type is acute intermittent porphyria, in which the defect in the enzyme porphobilinogen deaminase presents in one of three ways:
Type 1: Decreased enzyme activity together with reduced amount of the enzyme in the red cells
Type 2: Decreased enzyme activity in lymphocytes and liver cells but normal red cell activity
Type 3: Reduced red cell enzyme activity but normal amount of enzyme in the red cells.
| Disease | Clinical Effect | Enzyme Defect * | Red Cells | Urine | Faeces |
|---|---|---|---|---|---|
| ALA dehydratase deficiency porphyria | (a) | ALA dehydratase (porphobilinogen synthase) | ZnP ALA | CPIII | – |
| Acute intermittent porphyria | (a) | PBG deaminase | – | PBG ALA | – |
| Congenital erythropoietic porphyria | (b) | UPG III cosynthase | UP I C PI ZnP | UP I CP I | UP I CP I |
| Acquired cutaneous hepatic porphyria (symptomatic) | (b) | UPG decarboxylase | – | UP I CP III | – |
| Hereditary coproporphyria | (a), (b) | CPG oxidase | – | CP III | CP III |
| Variegate porphyria (South African genetic) | (a), (b) | PPG oxidase | – | PBG † ALA † | CP III PP |
| Erythropoietic protoporphyria | (b) | Ferrochelatase | PP | – | PP |
* See Figure 11-6 .
The different mutations of the porphobilinogen deaminase in the three types can be identified by deoxyribonucleic acid (DNA) hybridisation using specific oligonucleotides. Other acute forms are variegate porphyria and coproporphyria.
The most common hepatic type is porphyria cutanea tarda, which results in photosensitivity, dermatitis and often hepatic siderosis; it is the result of a defect in uroporphyrinogen decarboxylase. In this and other porphyrias associated with photosensitive dermatitis (see Table 11-1 ) plasma porphyrins are elevated. There are two erythropoietic types: congenital erythropoietic porphyria, caused by defective uroporphyrinogen cosynthase, and erythropoietic protoporphyria, caused by defective ferrochelatase. In the former, uroporphyrin and coproporphyrin are present in red cells and urine in increased amounts; in the latter, increased protoporphyrin is found in the red cells, but the urine is normal. In erythropoietic porphyria, haemolytic anaemia can occur.
Abnormal haemoglobin pigments
Methaemoglobin (Hi; also called MetHb), sulphaemoglobin (SHb) and carboxyhaemoglobin (HbCO) are of clinical importance and each has a characteristic absorption spectrum demonstrable by simple spectroscopy or, more definitely, by spectrometry. If the absorbance of a dilute solution of blood (e.g. 1 in 200) is measured at wavelengths between 400 and 700 nm, characteristic absorption spectra are obtained ( Fig. 11-7 and Table 11-2 ). In practice, the abnormal substance represents usually only a small fraction of the total haemoglobin (except in carbon monoxide poisoning) and its identification and accurate measurement may be difficult. Hi can be measured more accurately than SHb.
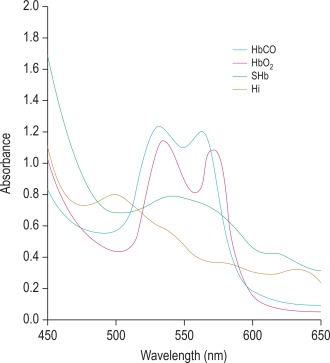
| Oxyhaemoglobin | 541, 576 |
| Deoxyhaemoglobin | 431, 556 |
| Carboxyhaemoglobin | 538, 568 |
| Methaemoglobin | 500, 630 |
| Sulphaemoglobin | 620 |
| Methaemalbumin | 624 |
| Haemochromogen (Schumm test) | 558 |
Stay updated, free articles. Join our Telegram channel

Full access? Get Clinical Tree


