Chapter Outline
Methodologies 127
DNA extraction 127
Polymerase chain reaction 127
Amplification refractory mutation system (ARMS) 130
Gap-PCR 130
Fusion gene analysis 131
Restriction enzyme digestion 131
Allele-specific oligonucleotide hybridisation 132
DNA sequencing by Sanger sequencing technology 132
High resolution melt curve analysis 133
Clinical applications 134
Investigation of haemoglobinopathies 134
Coagulopathies 136
Leukaemia and lymphoma 137
Tyrosine kinase domain mutation analysis 149
The lymphoproliferative disorders 150
Myeloproliferative neoplasms 152
Fusion gene analysis in acute leukaemia 156
Acute myeloid leukaemia, FLT3 and NPM1 analysis 157
Host-donor chimaerism studies 159
Emerging technologies 160
Digital PCR 161
Acknowledgements
We would like to thank Dr Tom Vulliamy and other previous authors for their past contribution in the preparation of this chapter and we refer to past editions for a full extent of their work.
Our understanding of the molecular basis of both inherited and acquired haematological disorders is now considerable and there are several ways in which this knowledge is being applied in diagnostic haematology. These include the identification of genetic defects in haemoglobinopathies allowing the provision of early prenatal diagnosis, the assessment of genetic risk factors in thrombophilia, the diagnosis and characterisation of leukaemias, the monitoring of minimal residual disease and the study of host-donor chimaerism following bone marrow transplantation.
In this chapter we shall describe some of the methods that can be applied in these situations, although this cannot be exhaustive and will reflect both the specific interests of our laboratory and the clinical practice of our institution.
The ability to manipulate deoxynucleic acid (DNA) as recombinant molecules followed from the discovery of bacterial DNA-modifying enzymes. This allowed genes to be isolated as cloned recombinant DNA molecules and their DNA to be sequenced. The sequence of the human genome is now virtually complete. , It has been extensively annotated and is accessible through a number of genome browsers. The ability to amplify specific DNA fragments from small amounts of starting material using the polymerase chain reaction (PCR) is now the cornerstone of most routine DNA analysis. Because this technique is relatively simple, rapid and inexpensive and requires only some basic laboratory equipment, it has made molecular genetic analysis readily accessible in many laboratories.
Guidelines from the American Association for Molecular Pathology address the choice and development of appropriate diagnostic assays, quality control, validation and implementation of molecular diagnostic tests. ,
The development, validation and implementation of quality control methods and assurance standards are established in the UK and elsewhere and guidelines for validation of molecular genetic tests have been published. At national and international levels, several groups have agreed on standardisation of molecular methodologies applied to fusion gene quantification ( BCR-ABL1 and PML-RARA among others) in myeloid malignancies as well as the molecular monitoring of residual disease using antigen receptor targets in acute and chronic lymphoid malignancies. ,
In this chapter, some of the applications of PCR in a diagnostic haematology laboratory are described. For the reasons just mentioned, the analysis of PCR products has largely superseded other techniques, including Southern blot analysis, and capillary electrophoresis has replaced polyacrylamide gel electrophoresis. For situations in which these are still appropriate, the reader is referred to previous editions of this book.
Methodologies
DNA extraction
DNA can be extracted from a blood or tissue sample. The quality and quantity of the DNA obtained will vary depending on the size, time from collection and cell count of the sample. As a rule, 5–10 ml of blood in ethylenediaminetetra-acetic acid (EDTA) will suffice. The DNA is extracted from all nucleated cells and is called genomic DNA.
In the nucleus, the DNA is tightly associated with many different proteins as chromatin. It is important to remove these as well as other cellular proteins to extract the DNA. This is achieved through the use of organic solvents, salt precipitation or DNA-affinity columns. An aqueous solution of DNA is obtained, from which the DNA is further purified by precipitation. Currently, there are a number of commercially available DNA extraction kits for general and specialist applications. They all produce good quality DNA from various starting materials. These kits, as well as being reliable, are also cost effective. In addition, automation, which can achieve simultaneous extraction of a large number of samples, can significantly reduce the amount of time required for DNA extraction, bypass the use of organic solvents and provide good quality control of the reagents used. Automation is highly suited to high throughput laboratories and some of these procedures will be described below.
DNA extraction kits
We are currently using two different types of DNA extraction kits, depending essentially on the quantity of DNA required. The first – the Qiagen system – is a robust method for obtaining ≈ 5 μg of DNA from 200 μl of whole blood ( www.qiagen.com ). This method utilises a high-affinity DNA binding matrix in a spin column, which can be used in a microcentrifuge or in an automated platform, such as the Qiacube. The DNA obtained is generally of high quality and sufficient in amount for most routine analyses.
When a larger amount of DNA is required – perhaps for storage and more extensive analysis of critical samples – we use from 3–10 ml of blood with the Gentra Puregene blood extraction kit (Qiagen), which can yield upward of 100 μg of DNA. This method depends on a salting-out of proteins after sequential red cell and then white cell lysis, followed by an isopropanol precipitation of the DNA. Other nucleic acid high throughput systems also exist such as MagNA Pure 96 System (Roche, http://lifescience.roche.com ) and the Maxwell® rapid sample concentrator (RSC) Instrument ( www.promega.com ).
Protocols will be provided in the latter part of this chapter. For preparation of reagents and a protocol for the manual extraction of DNA from blood using organic solvents, the reader is referred to previous editions of this book.
Polymerase chain reaction
Development of PCR has had a dramatic impact on the study and analysis of nucleic acids. Through the use of a thermostable DNA polymerase, Taq polymerase extracted from the bacterium Thermus aquaticus, PCR results in the amplification of a specific DNA fragment such that it can be visualised using intercalating SYBR Safe ( www.thermofisher.com ) added to agarose gels. Ethidium bromide, a mutagenic product, is no longer in use for health and safety reasons. The procedure can take as little as an hour and requires only a small amount of starting material.
Principle
A DNA polymerase will synthesise the complementary strand of a DNA template in vitro. A stretch of double- stranded DNA is required for synthesis to be initiated. This double-stranded sequence can be generated by annealing an oligonucleotide (‘oligo’), which is a short, single- stranded DNA molecule usually between 18 and 25 bases in length, to a single-stranded DNA template. These oligos, which are synthesised in vitro, will prime the DNA synthesis and are therefore referred to as ‘primers’.
In PCR, two oligo-primers are used. Each primer will generate a copy of the complementary strand. For instance, the sense primer will anneal to the antisense sequence and prime it in a 5′ to 3′ direction and in doing so generate a new sense strand. The antisense primer will anneal to the sense strand and prime it generating a new antisense strand. The other components of the reaction are the DNA template from which the DNA fragment will be amplified, the four deoxynucleotide triphosphates (dATP, dTTP, dCTP and dGTP) required as the building blocks of the newly synthesised DNA, a salt buffer containing MgCl 2 and the thermostable DNA polymerase (Taq polymerase).
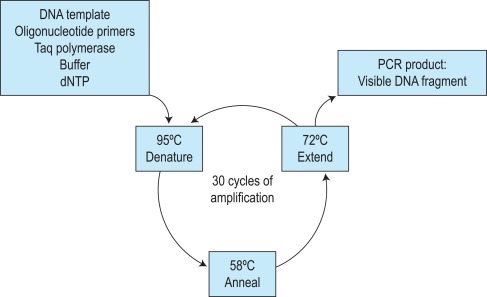
The first step of the reaction is to denature the DNA, generating single-stranded templates, by heating the reaction mixture to 95 °C. The reaction is then cooled, usually to a temperature between 50 °C and 68 °C, which permits the annealing of the oligos to the DNA template but only at their specific complementary sequences. The temperature is then raised to 72 °C, at which temperature the Taq polymerase efficiently synthesises DNA, extending from the oligo in a 5′ to 3′ direction. Cyclical repetition of the denaturing, annealing and extension steps, by simply changing the temperature of the reaction in an automated heating block, results in exponential amplification of the DNA that lies between the two primers ( Fig. 8-1 ). So-called fast-cycling Taq kits are now available, often with highly modified cycling conditions that can bring the time of a PCR reaction down to below an hour.
The specificity of the DNA fragment that is amplified is therefore determined by the sequences of the primers used. A sequence of 18–25 base pairs (bp) is theoretically unique in the human genome, and so primers of this length and longer will anneal at only one specific place on a template of genomic DNA, or at least one combination within an amplifiable distance (typically no more than 2–3 kilobases for standard cycling conditions). One general requirement of PCR is therefore some knowledge of the DNA sequence of the gene that is to be amplified. The relative positioning of the two primers is another important consideration. They must prime DNA synthesis in opposite directions but pointing toward one another and each must anneal to one of the complementary strands. There is also an upper limit to the distance apart that the oligos can be placed; fragments of several kilobase (kb) pairs in length can be amplified, but the process is most efficient for fragments of several hundred base pairs. Long-range PCR kits are available, which in combination with optimised cycling conditions can amplify fragments of 10–20 kb.
Methodology
Reagents
Taq polymerase and oligonucleotide primers
These can be purchased from a variety of different companies. The oligos are usually 18–25 bases in length.
PCR buffers
These are usually supplied along with the Taq polymerase and consequently manual preparation may no longer be required. Three different buffers can be prepared as follows:
- •
× 10 PCR buffer I: 100 mmol/l Tris-HCl, pH 8.3, 500 mmol/l KCl, 15 mmol/l MgCl 2 , 0.1% (w/v) gelatine, 0.5% (v/v) NP40, and 0.5% (v/v) Tween 20.
- •
× 10 PCR buffer II: 670 mmol/l Tris, pH 8.8, 166 mmol/l (NH 4 ) 2 SO 4 , 25 mmol/l MgCl 2 , 670 μmol/l Na 2 EDTA, 1.6 mg/ml bovine serum albumin (BSA), and 100 mmol/l β mercaptoethanol. This buffer is used in conjunction with 10% dimethyl sulphoxide (DMSO) in the final reaction mixture.
- •
× 10 PCR buffer III: 750 mmol/l Tris, pH 8.8, 200 mmol/l (NH 4 ) 2 SO 4 , 0.1% (v/v) Tween 20. A solution of 25 mmol/l MgCl 2 is also prepared and added separately to the PCR reaction.
- •
dNTP, 10 mmol/l. Take 10 μl of 100 mmol/l dATP, 10 μl of 100 mmol/l dTTP, 10 μl of 100 mmol/l dCTP, 10 μl of 100 mmol/l dGTP and 60 μl of water to make 100 μl of 10 mmol/l dNTP.
Agarose, Type II medium electroendosmosis.
- •
× 10 Tris–borate–EDTA (TBE) buffer . Add 216 g of Trizma base, 18.6 g of EDTA, and 110 g of orthoboric acid to 1600 ml water. Dissolve and top up to 2 litres; dilute 1 in 20 for use as × 0.5 TBE buffer.
- •
SYBR Safe DNA Stain ( www.thermofisher.com) (× 10 000 concentrated). Add 5 μl to every 50 ml of agarose gel preparation
- •
Tracking dye . Weigh 15 g of Ficoll (type 400), 0.25 g of bromophenol blue and 0.25 g of xylene cyanol. Make up to 100 ml with water, cover, and mix by inversion; it will take a considerable amount of mixing to get the solution homogeneous. Dispense into aliquots.
Method
Optimal conditions for the reaction have to be derived empirically, with the magnesium concentration and annealing temperature being the most important parameters. The choice of buffer depends on the enzyme being used, and the company will usually supply the most appropriate one. For genes with a high GC content, buffer II in combination with 10% DMSO may give better amplification. In most cases, a 25-μl reaction volume suffices. A no template control (NTC) should always be included (i.e. a reaction without any DNA or complementary DNA [cDNA]: the template) to control for contamination. If the NTC yields a product, the analysis is invalid. A DNA sample that is known to amplify can also be included and this sample may then be used as a positive control.
The risk of contamination cannot be over emphasised. This can be minimised by using plugged tips and having dedicated micropipettes and areas for each step of the analysis. The optimum cycling conditions need to be determined for each thermocycler. Specificity is often improved by ‘hot start’ PCR. This is achieved by setting up all the PCR tests on wet ice and transferring the tubes to the thermocycler once it reaches 95 °C or by using an enzyme that only becomes activated when heated at 95 °C for several minutes. In preparing a group of reactions, a premix solution is prepared that can be dispensed into microcentrifuge tubes, tube strips or PCR reaction 96-well plates to which the template DNA is added. When a particular PCR is to be performed repetitively over a period of time, it is helpful to prepare a large volume (e.g. 10 ml) of the reaction mixture (without DNA or Taq polymerase), aliquot it in amounts sufficient for 20 reactions and store it at − 20 °C.
- 1.
Prepare a PCR mixture for 20 reactions (with a final volume of 25 μl for each DNA sample) as follows:
Stock Solution
Vol (μl)
Final Concentration
× 10 PCR buffer III
50
× 1
25 mmol/l MgCl 2
40
2.0 mmol/l
10 mmol/l dNTP
10
0.02 mmol/l
10 μmol/l Primer (1)
20
0.04 μmol/l
10 μmol/l Primer (2)
20
0.04 μmol/l
5 u/μl Taq polymerase
2
0.02 μ/ml
Water
358
Final volume
500
Add the Taq polymerase last, mix well and pulse-spin in a microcentrifuge to bring down the contents of the tube.
- 2.
Aliquot 24 μl of the PCR reaction mix into each tube. Add 1 μl of template DNA at approximately 0.05 mg/ml into all bar one (the NTC) of the reaction tubes.
- 3.
Place the tubes in a PCR machine, using a heated lid, programmed for the following conditions: an initial step of 5 min at 95 °C and then 30 cycles of 95 °C for 45 sec, 58 °C for 45 sec, and 72 °C for 1 min in sequence followed by a final extension step at 72 °C for 10 min. These conditions are suitable for many primer pairs, although some will require different annealing temperatures or longer extension times. These two parameters need to be optimised in advance.
- 4.
While the PCR program is running, a 1.5% agarose minigel is prepared: add 0.75 g of agarose to 50 ml of × 0.5 TBE buffer and heat until completely dissolved. Add 2 μl of Sybr Green, allow the agarose to cool slightly and pour with the appropriate comb in position.
- 5.
To check if the amplification has been successful, add 1 μl of tracking dye to a 10-μl aliquot of the PCR reaction mixture, being careful not to pipette the mineral oil overlaying the PCR reaction.
- 6.
Load the gel and run at a constant voltage of 100 V for 1 hour in × 0.5 TBE buffer. A molecular size marker should be included to establish the size of the amplified fragment; these are commercially available.
- 7.
Visualise the DNA on an ultraviolet (UV) transilluminator and take a photograph.
Modifications and developments
The procedure described above is a guide for setting up and checking a standard PCR amplification. As the test dictates, modifications can be used, such as the following:
- •
Radiolabelling. A PCR can be labelled with 32 P by adding 0.1 μl of [α- 32 P]dCTP per tube to the reaction mixture (rarely used).
- •
Multiplex. More than one fragment can be amplified in the same tube simply by adding in further primer pairs. It is important that the different pairs all work equally well under the same conditions.
- •
Nested PCR. This involves successive rounds of amplification using two pairs of primers; the second pair, located within the sequence amplified by the first, allows products to be generated from as little as a single cell.
- •
Long-range amplification. Fragments upward of 10 kb can now be generated by PCR using modified polymerases.
- •
Automation. High throughput PCR amplification is being achieved through the use of robots and 96-well plate technology.
- •
Automated fragment analysis. The method of gel electrophoresis is modified for the detection of fluorescently labelled PCR products on DNA fragment analysers (e.g. the ABI 3700 DNA analyser, www.thermofisher.com ).
Interpretation
If the amplification has been successful, a discrete fragment of the expected size is seen in a SYBR Safe-stained agarose gel in all samples, except in the NTC lane. If a product is seen in the NTC, then one of the solutions has been contaminated and the results cannot be relied on. All the working solutions must be discarded and the micropipettes must be cleaned. Cleaning micropipettes and work surfaces prior to the start of each run is highly recommended. To avoid contamination, making up a stock master mix of all reagents is recommended before DNA samples are added to each tube. If possible the use of separate pre- and post-PCR laboratories is highly recommended. This reduces the risk of contamination significantly. At a minimum the use of distinct areas of the laboratory for each activity is recommended.
Problems
The absence of a fragment in all tracks, including the positive control, indicates that the PCR has failed. This can occur for a number of reasons, including poor quality template or omission of one of the essential reagents. The reaction may also fail if the magnesium concentration is too low (standard concentration 1.5 mM) or if the annealing temperature is too high. However, DNA quality and amount in the reaction is often one of the major reasons for failure. If one particular DNA sample repeatedly fails to amplify, then the sample should be re-extracted using Proteinase K ( www.thermofisher.com ) and phenol/chloroform and re-precipitated, adding in one-tenth of the total volume of 3 M sodium acetate (pH 4.8) followed by the addition of 2.5 volumes of − 20 °C cold ethanol.
We have also found that using the Gentra blood extraction kit (Qiagen) or passing the DNA through a Qiagen column substantially improves DNA quality and PCR efficiency.
Another problem is the presence of nonspecific fragments or just a smear of amplified product. This can occur if the magnesium concentration is too high or if the annealing temperature is too low.
Presence or absence of a PCR product and sizing PCR products
Initially, PCR products were commonly visualised by agarose gel electrophoresis or using a fast automated system such as Qiaxcel equipment (Qiagen). However, it has also become commonplace to visualise PCR products directly on DNA analysers – in particular the Applied Biosystems 3130xl, 3500 or similar models ( www3.appliedbiosystems.com ). These read fluorescently labelled DNA fragments as they exit from the gel and enable single-base resolution from around 50–800 bp. If appropriate primers and controls are included in an experiment, the actual presence of a product can be highly informative.
Deletions and insertions can be easily identified when the size of the PCR product significantly differs from the size in the normal control. An example of this analysis is given for α globin gene Gap analysis on page 136.
Higher resolution of fragment sizes is obtained by capillary electrophoresis, which is particularly appropriate in the analysis of short tandem repeat (STR) sequences, which can be highly variable in length and therefore useful as genetic markers of different individuals. High resolution sizing of DNA fragments is now often performed on DNA analysers as mentioned above. Several examples of these applications are given in this chapter, in particular in the section describing chimaerism analysis on page 159.
Amplification refractory mutation system (ARMS)
Principle
Point mutations and small insertions or deletions can be identified directly by the presence or absence of a PCR product using allele-specific primers. , Two different oligos are used that differ only at the site of the mutation (the amplification refractory mutation system, or ARMS, primers) with the mismatch distinguishing the normal and mutant base located at the 3′ end of the oligo. An oligo with a mismatch at its 3′ end will fail to prime the extension step of the reaction. Each test sample is amplified in two separate reactions containing either a mutant ARMS primer or a normal ARMS primer. The mutant primer will prime amplification in combination with one common primer from DNA with this mutation but not from a normal DNA. A normal primer will do the opposite. To increase the instability of the 3′ end mismatch, and so prevent the failure of the amplification, it is sometimes necessary to introduce a second nucleotide mismatch three or four bases from the 3′ end of both oligos. A second pair of primers located at a distance from the ARMS primers is also included in the reactions as an internal control for the efficient amplification of DNA. This is essential because a failure of the ARMS primer to amplify is interpreted as a significant result and must not be the result of suboptimal amplicon reaction.
Interpretation
The fragment produced by amplification with the internal control primers must be seen in all the samples, except for the NTC. Then the presence or absence of a mutation is simply determined by the presence or absence of the amplification with the mutant ARMS primer. Similarly, the presence or absence of the normal allele is determined in the same way with the normal ARMS primer. In this way, heterozygous, homozygous normal, and homozygous mutant genes can be distinguished. An example of the application of this technique will be presented with the diagnosis of β thalassaemia mutations on page 135.
Gap-PCR
Large deletions can be detected by Gap-PCR. Primers located 5′ and 3′ to the breakpoints of a deletion will be too far apart on the normal chromosome to generate a fragment in a standard PCR. When the deletion is present, these primers will be brought closer together, enabling them to give rise to a product. An example of this is given for the detection of deletions in α 0 thalassaemia on page 136.
Fusion gene analysis
Primers can be brought together by chromosomal translocation, giving rise to a diagnostic product. Breakpoints may be spread over too large a region for genomic DNA to be amplified. However, translocations in leukaemic cells can give rise to fusion genes, which lead to the formation of new fusion proteins with oncogenic effect. Primers for the different genes (generally corresponding to the exons flanking the breakpoint) are then juxtaposed in a hybrid messenger ribonucleic acid (mRNA) molecule and can give rise to a product generated through reverse transcription from the fusion mRNA or product, using a reverse transcriptase polymerase chain reaction (RT-PCR). Examples of this are given for the analysis of minimal residual disease in chronic myeloid leukaemia (CML) and other leukaemias on pages 142 and 156.
Restriction enzyme digestion
Principle
Restriction enzymes (REs) cleave DNA at short specific sequences. Because many REs are available, it is not uncommon for a single point mutation to coincidentally create or destroy an RE recognition sequence. If this is the case, digestion of the appropriate PCR product prior to agarose gel electrophoresis enables the mutation to be identified. A difference in the size of the restriction fragments seen in normal and mutant samples can be predicted from a restriction map of the amplified fragment and the site of the mutation that changes a restriction site. The observed fragments should be consistent with either the mutant or the normal pattern. An example of this technique is shown in Figure 8-2 .

Methodology
Reagents
A number of companies now supply a comprehensive range of restriction enzymes (REs), but they may vary greatly in their cost. Those that are in regular use are generally quite inexpensive compared with the more specialised enzymes that are used only occasionally and that may be 10–100 times more expensive. RE buffers are now almost always supplied with each RE. Buffer compositions are always given and will vary from enzyme to enzyme. Many commonly used REs cut perfectly well in a single ‘universal’ buffer. This is prepared using the following stock solutions:
- 1.
Tris-acetate, 2 mol/l, pH 7.5. Dissolve 24.2 g of Trizma base in 60 ml of water, adjust the pH to 7.5 with glacial acetic acid and make up to 100 ml.
- 2.
Potassium acetate, 2 mol/l. Weigh out 19.62 g, make up to 100 ml with water and dissolve.
- 3.
Magnesium acetate, 2 mol/l. Weigh out 42.89 g, make up to 100 ml with water and dissolve.
- 4.
BSA fraction V (molecular biology grade), 20 mg/ml .
- 5.
Dithiothreitol (DTT), 0.5 mol/l. Weigh out 0.771 g, make up to 10 ml with water, dissolve and store at − 20 °C.
- 6.
Spermidine (N-(3-aminopropyl)-1,4-butane-diamine), 1 mol/l. Weigh out 1.273 g, make up to 10 ml with water, dissolve and store at − 20 °C.
- 7.
× 10 RE buffer. For a × 10 concentrated buffer, prepare a solution that is 300 mmol/l Tris-acetate, pH 7.5, 660 mmol/l potassium acetate, 100 mmol/l magnesium acetate, 1 mg/ml BSA, 10 mmol/l DTT, and 30 mmol/l spermidine; aliquot into microcentrifuge tubes and store at − 20 °C.
Method
- 1.
To a 20-μl aliquot of a PCR product add 2.5 μl of × 10 restriction enzyme buffer, 2 μl of double-distilled water, and 2–5 units of the appropriate RE (usually 0.5 μl), giving a final volume of 25 μl. In preparing more than one digestion with the same restriction enzyme, sufficient buffer, enzyme, and water can be premixed and dispensed into the PCR products.
- 2.
Incubate at 37 °C (or other temperature as specified by the manufacturer) for a minimum of 4 h.
- 3.
Pour a 2.5% agarose minigel in a taped casting tray with the appropriate comb. The gel is made up of 1:1 mixture of type II medium electroendosmosis agarose and NuSieve agarose ( www.thermofisher.com ) (i.e. 0.675 g of agarose and 0.675 g of NuSieve agarose in 50 ml of half-strength [× 0.5] TBE buffer).
- 4.
After the incubation period, add 2 μl of tracking dye to the digests and load the samples on to the gel. The electrophoresis is continued until a clear separation of all the expected fragments is achieved, which may be checked at intervals by placing the gel on a UV transilluminator.
Allele-specific oligonucleotide hybridisation
Principle
Under appropriate conditions, short oligonucleotide probes will hybridise to their exact complementary sequence but not to a sequence in which there is even a single base mismatch. A pair of oligos is therefore used to test for the presence of a point mutation: a variant oligo complementary to the variant sequence and a reference oligo complementary to the reference sequence, with the sequence difference placed near the centre of each oligo.
The stability of the duplex formed between the oligo and the target DNA being tested (the PCR product) depends on the temperature, the base composition and length of the oligo, and the ionic strength of the washing solution. For allele-specific oligonucleotide hybridisation (ASOH) studies, an empirical formula has been derived for the dissociation temperature ( T d ), the temperature at which half of the duplexes are dissociated. This value is used as a guide; the exact temperature at which only perfect base pairing is maintained is usually determined by trial and error.
This methodology has been widely applied for the detection of single nucleotide variations (SNVs) using fluorescently labelled hydrolysis probes (such as TaqMan probes) that distinguish the two alleles. Two short allele-specific probes are used, one of which will hybridise only to the wild-type allele and one of which will hybridise only to the mutant allele. The two probes are labelled with different fluorophores, which are quenched (preferably using a non-fluorescent quencher) while the probes remain intact, but are released if and when the probe hybridises to its perfectly complementary sequence during the reaction, as it will then be broken up by the exonuclease activity of the Taq polymerase.
Interpretation
The oligos will hybridise to their perfectly complementary DNA sequence, such that the variant oligo gives a signal only when the mutant allele is present, and similarly for the wild-type allele. When this is the case, the interpretation of the result is straightforward; a positive signal from a particular oligo indicates the presence of that allele in the test sample. Heterozygotes and homozygotes are distinguished by using the variant and reference oligos in tandem. With the two fluorescent colours of the hydrolysis probes, the heterozygote is identified as the sum of the two fluorochromes.
Other non-radioactive probes, with detection systems involving horse-radish peroxidase, have also been quite widely used in this procedure. The technique has also been modified such that the allele-specific oligonucleotides are immobilised onto nylon membranes and the patient-specific PCR product is used as the probe – the reverse dot blot procedure. This allows several different mutations to be analysed simultaneously and has proved particularly useful in the diagnosis of β thalassaemia mutations.
DNA sequencing by Sanger sequencing technology
Principle
The Sanger chain termination method for direct DNA sequencing has become a standard diagnostic tool. In many laboratories this procedure has superseded targeted mutation detection as it provides a robust and relatively rapid method to identify all sequence changes that may be present in a particular DNA fragment. This approach is particularly relevant where multiple different mutations may underlie a particular disorder. This is the case for β thalassaemia and for glucose-6-phosphate dehydrogenase (G6PD) deficiency, so it is not surprising that DNA sequencing has often become the method of choice for the molecular diagnosis of these disorders.
The method involves the de novo synthesis of DNA strands in one direction from a PCR-derived template amplicon. The chain is lengthened by a thermostable DNA polymerase using deoxynucleotide triphosphates in the normal way. However, included in the reaction mixture is a small proportion of fluorescently labelled dideoxynuclotide triphosphates (ddNTPs), which when incorporated will prevent any further extension of the chain. This process happens millions of times along a relatively short piece of DNA (typically 30–400 and no more than 800–1000 bases), which means that chain-termination will occur many times at each position along the fragment. In the ABI BigDye system (Life Technologies, www.thermofisher.com ), each of the ddNTPs is labelled with a different fluorochrome, and so the products of the sequencing reaction will consist of single-stranded DNA fragments, each differing in size by one base pair and each labelled with a different colour. These fragments can then be separated by capillary electrophoresis according to size, and the order with which the different colours exit from the capillary will correspond to the sequence of the DNA template.
Methodology
Reagents and equipment
- •
ExoSapIt, a mixture of exonuclease and shrimp alkaline phosphatase ( www.affymetrix.com )
- •
BigDye Terminator v3.1 cycle sequencing kit ( www.thermofisher.com )
- •
125 mM EDTA
- •
MicroAmp optical plates ( www.thermofisher.com )
- •
100% and 70% ethanol
- •
HiDi formamide ( www.thermofisher.com )
- •
Method
The PCR product that requires to be sequenced is firstly mixed with 2 μl of ExoSapIt and is incubated at 37 °C for 45 min and then at 80 °C for 15 min. Then cool to 4 °C until ready for use. Prepare 10-μl sequencing reactions by mixing 1–4 μl of the ExoSapIt-treated PCR product, 2 μl of the relevant oligonucleotide primer (diluted to 0.8 pmol/μl), 1 μl of the 5X reaction buffer and 2 μl of the BigDye dideoxy NTP terminator mix (both supplied with the kit), made up to 10 μl with water. Transfer the reaction to a PCR machine and run the sequencing reaction, with the following cycling conditions: 96 °C for 10 s, 50 °C for 5 s and 60 °C for 4 min for 25 cycles. Then cool samples to 4 °C. Add 2.5 μl of 125 mM EDTA to each sample and mix well and then add 30 μl of ice-cold ethanol and mix again. Incubate on ice for 10 min in a sealed MicroAmp plate. Centrifuge at 2000 g for 20 min to pellet the DNA. Carefully remove the seal, invert the plate onto some absorbent tissue and centrifuge the plate upside down for ≈ 10 sec to remove all residual liquid. Again add 125 μl of 70% ethanol and centrifuge at 2000 g for 5 min. Invert and briefly spin the plate upside down again. Place on a preheated 95 °C block for 10 s to remove any residual ethanol. Resuspend in 10 μl of HiDi formamide, cover with the grey septa mat, heat to 95 °C for 5 min, snap-cool on ice and place in the DNA sequence analysis platform and run, using the appropriate DNA fragment analysis protocol for sequencing.
Interpretation
Reading the DNA sequence from a trace – known as an electrophoretogram – is relatively straightforward as long as the quality of the trace is satisfactory: an A is shown as a green peak, T as a red, C as a blue and G as a black. Free software packages are available for viewing these traces, and indicate the DNA sequence in the file. Simple alignment of this sequence to the GenBank reference sequence can be performed at the National Center for Bioinformatics (NCBI) ( www.ncbi.nlm.nih.gov ) using the Blast program, and will identify any sequence changes. Heterozygous point mutations will be seen as double peaks, with two colours overlaid. Small heterozygous insertions or deletions (indels) are harder to decipher, as the sequence 3′ of the mutation will be a double sequence, with the reference and indel-variant allele superimposed on one another: the extent of the indel can be defined by subtracting from the expected normal sequence.
High resolution melt curve analysis
Principle
High resolution melt (HRM) curve analysis is a post-PCR analytical methodology used for identifying genetic variants in suitable regions of interest in candidate genes. Once optimised, it is simple and fast with no post-PCR manipulation. Analysis is performed using Applied Biosystems High Resolution Melt Software ( www.appliedbiosystems.com ).
HRM analysis is performed on double-stranded (ds) DNA samples. Firstly the DNA is amplified using a real-time platform prior to the HRM melt phase. The HRM process is a slow denaturation of the dsDNA from 50–95 °C in conjunction with an intercalating fluorescent dye, SYTO9 ( www.thermofisher.com ). When the melting temperature of the ds DNA is reached, the two strands ‘melt’ apart. The midpoint of the melt curve is described as the point when 50% of the DNA is double stranded and 50% is single stranded. The shape of the curve is dependent upon the characteristics of the ds DNA, which relate to whether it is homozygous wild-type, homozygous mutant or heterozygous wild-type and mutant. When the two strands ‘melt’ apart the fluorescence level drops. As the HRM is monitored in real-time, this curve gives a real time picture of the characteristics of the DNA being tested.
The lower limit sensitivity of HRM, as determined by our laboratory using the ABI3100 instrument ( www.appliedbiosystems.com ), is approximately 10%. However, this is dependent upon the mutation being tested as sensitivity is partly determined by the base change. The greater the temperature shift, the more sensitive the test will be.
Methodology
Reagents
- •
HRM Melt Doctor Reagent Kit ( www.thermofisher.com )
- •
AmpliTaq Gold 360 Buffer 10X and AmpliTaq Gold polymerase ( www.thermofisher.com )
- •
25 mM magnesium chloride
- •
GeneAmp dNTP blend 10 mM ( www.thermofisher.com )
- •
Melt Doctor HRM Dye 20X (Syto9) ( www.thermofisher.com )
- •
Invitrogen Molecular biology grade H 2 O ( www.thermofisher.com )
- •
Oligonucleotides
All primers are diluted to 100 pmol/ml once received and are then set up at 5 pmol/ml. These are made by preparing a 1:20 dilution from the master stock of 100 pmol/ml and storing it at − 20 °C.
When setting up a mixture, calculate that for each reaction you will require a final volume of 20 μl per test. Calculate the number of tests to be performed and add an extra 2 tubes to allow for wastage.
Equipment
ABI3100 Instrument. The ABI3100 machine needs to be calibrated for HRM using the relevant plate and dye using a calibration plate ordered through Applied Biosystems (Fast 96-well MeltDoctor calibration plate, catalogue number 4425618; www.appliedbiosystems.com ).
Clear Polyolefin StarSeal StarLabs (catalogue number E2796-9793; www.starlab.co.uk ). Pipettes, tips and bijou tubes, 1.5-ml Eppendorf tubes ( www.eppendorf.com ).
All DNA should be quantified and diluted to 100 ng/μl. DNA samples for testing are stored at − 20 °C. DNA for HRM is subsequently diluted to 20 ng/μl by preparing a 1:5 dilution in water.
Method
- 1.
All samples including control samples and negative controls are tested in triplicate or at least in duplicate.
- 2.
The controls used are dependent upon the test in question but must include at least one positive control, one wild-type control and a no template (water) control.
- 3.
Working in the clean room, referring to the worksheet, prepare all the reagents required and thaw them.
- 4.
Make up an appropriate volume of the master mix. If making up master mix for a full 96-well plate, use a bijou not an Eppendorf due to the total volume required.
- 5.
Add the appropriate volume, 0.2 μl per reaction of Platinum AmplTaq 360 DNA polymerase, mix well and aliquot 19 μl to each well.
- 6.
Take the 96-well plate to the set-up room and place in the PCR hood.
- 7.
Take out all DNA samples to be tested and place in worksheet order
- 8.
These DNA samples will be at a concentration 100 ng/μl.
- 9.
Make up a 20 ng/μl dilution by adding 1 μl of DNA to 4 μl of H 2 O. This is sufficient for 3 tests. Discard after use.
- 10.
Wild-type control DNA, cell line DNA or appropriate positive controls are stored at 20 ng/μl dilutions in the control DNA box. Add 1 μl to each relevant tube.
- 11.
Seal the plate using plate adhesive film and the rubber sealer. Take care not to leave fingerprints on the film by wearing protective gloves.
- 12.
Run the reaction in the ABI3100 by using the appropriate programme.
- 1.
All appropriate controls must be used in each run. This includes a positive control (preferably a cell line or a previously identified positive patient), a negative control (usually DNA wild-type) and water as a non template control (NTC).
Interpretation
Homoduplexes, whether wild-type or mutant, will display the same curve shape but will be distinguished primarily by the shift on the temperature axis ( x axis). Heteroduplexes are discriminated by a change in the shape of the curve.
Clinical applications
Investigation of haemoglobinopathies
Sickle cell disease
The presence of haemoglobin S and thus the presence of the sickle cell gene can be determined by haemoglobin cellulose acetate electrophoresis, high performance liquid chromatography (HPLC) or a ‘sickling test’. However, there are occasions when it is beneficial to make a diagnosis by DNA analysis (e.g. in prenatal diagnosis, which can be performed at 10 weeks of pregnancy, with the aim of identifying sickle cell anaemia and haemoglobin S/β thalassaemia, or to confirm the diagnosis of sickle cell anaemia in a neonate). For the type of specimens collected for prenatal diagnosis, refer to page 310.
The sickle cell mutation, c.20A > T; p.Glu7Val in codon 7 of the β globin gene, HBB, results in the loss of a Bsu36 I (or Mst II, Sau I, OxaN I or Dde I) restriction enzyme site that is present in the normal HBB gene. It is therefore possible to detect the mutation directly by restriction enzyme analysis of a DNA fragment generated by PCR. A pair of primers are used to amplify exons 1 and 2 of the β globin gene and the products of the PCR are digested with Bsu36 I. The loss of a Bsu36 I site in the sickle cell gene gives rise to an abnormally large restriction fragment that is not seen in normal individuals ( Fig. 8-2 ). This mutation can also be detected by ARMS PCR using two reactions per sample, one specific for the mutant allele and the other for the wild-type allele. The 3′-end nucleotide of the mutation-specific primer should be specifically complementary to the mutation, while the primer specific for the wild-type sequence should contain a nucleotide complementary to the wild-type sequence at this end. A common reverse primer allows the production of an amplification band similar in size in the two reactions, hence the use of two reaction tubes per sample. Primers specifically used for this analysis are listed below.
Homozygosity for the mutation will produce amplification in the mutation PCR reaction, while the absence of the mutation will result in amplification in the wild-type PCR only. Heterozygous samples will have amplification in both reactions. An extra pair of primers amplifying another part of the gene should be used to produce control bands. The primers used for this method are Haemoglobin S Forward, Wild-Type (WT) Forward, Common Reverse, Control Forward, and Control Reverse and are listed here: Haemoglobin S Forward Mutant: 5′-CCC ACA GGG CAG TAA CGG CAG ACT TCT GCA 3′; Haemoglobin S Forward WT: 5′-CCC ACA GGG CAG TAA CGG CAG ACT TCT GCT 3′; Common Reverse: 5′-ACC TCA CCC TGT GGA GCC AC 3′; Control Forward: 5′-GAG TCA AGG CTG AGA GAT GCA GGA 3′; Control Reverse: 5′-CAA TGT ATC ATG CCT CTT TGC ACC 3′.
β thalassaemia
The ethnic groups with the highest incidence of β thalassaemia are the Mediterranean populations, Indian subcontinent populations, Chinese and Africans. Although more than 100 β thalassaemia mutations are known, each of these groups has its own subset of mutations, so that as few as five different mutations may account for more than 90% of the affected individuals in a population. This makes the direct detection of β thalassaemia mutations a reasonable possibility, and it has become the method of choice where it is most important – in prenatal diagnosis. ,
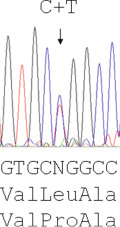
The majority of mutations causing β thalassaemia are point mutations affecting the coding sequence or splice sites and nowadays they are detected by direct DNA sequence analysis. Unstable and other unusual haemoglobins may also cause disease, and can similarly be identified by direct DNA sequence analysis. An example of such a case is shown in Figure 8-3 , where a picture of moderate anaemia is seen in the heterozygote due to the highly unstable and electrophoretically silent variant HBB Durham-N.C.
α thalassaemia
In contrast to the β thalassaemias, the most common α thalassaemia mutations are large deletions. Two categories exist: those that remove only one of the two α globin genes on one chromosome (α + thalassaemia) and those that remove both of the α genes from one chromosome (α 0 thalassaemia). Although PCR amplification around the α globin locus has proved to be rather difficult, the common deletions can now be identified by a reasonably robust Gap-PCR. In these reactions dimethyl sulphoxide (DMSO) (see Buffer II, p. 128 ) and betaine are added. Two different multiplex PCR reactions are set up: one for the common α + thalassaemias (α − 3.7 and α − 4.2 ) and one for the common α 0 thalassaemias (– – SEA , – – MED , – – FIL and α − 20.5 ). The fragment generated by these primers across the deletion breakpoint is different in size from the fragment generated from the normal chromosome. The primers that flank the deletion breakpoint are too far apart to generate a fragment from the normal chromosome in the PCR. Only when these are brought closer together as a result of the deletion, can a fragment be produced. Primer sequences used in this analysis are given in Table 8-1 and an example of their application in the detection of α 0 thalassaemias is shown in Figure 8-4 .
| Primer Name | Sequence, 5′ → 3′ | Concentration (μmol/l) |
|---|---|---|
| α 0 | Multiplex PCR | Clark and Thein (2004) |
| 20.5(F) | GGGCAAGCTGGTGGTGTTACACAGCAACTC | 0.1 |
| 20.5(R) | CCACGCCCATGCCTGGCACGTTTGCTGAGG | 0.1 |
| α/SEA(F) | CTCTGTGTTCTCAGTATTGGAGGGAAGGAG | 0.3 |
| α(R) | TGAAGAGCCTGCAGGACCAGGTCAGTGACCG | 0.15 |
| MED(F) | CGATGAGAACATAGTGAGCAGAATTGCAGG | 0.15 |
| MED(R) | ACGCCGACGTTGCTGCCCAGCTTCTTCCAC | 0.15 |
| SEA(R) | ATATATGGGTCTGGAAGTGTATCCCTCCCA | 0.15 |
| FIL(F) | AAGAGAATAAACCACCCAATTTTTAAATGGGCA | 1.6 |
| FIL(R) | GAGATAATAACCTTTATCTGCCACATGTAGCAA | 1.6 |
| α + | Multiplex PCR | From JM Old (pers. comm.) |
| 3.7 F | CCCCTCGCCAAGTCCACCC | 0.4 |
| 3.7/20.5R | AAAGCACTCTAGGGTCCAGCG | 0.4 |
| 4.2 F | GGTTTACCCATGTGGTGCCTC | 0.6 |
| 4.2R | CCCGTTGGATCTTCTCATTTCCC | 0.8 |
| α2R | AGACCAGGAAGGGCCGGTG | 0.1 |
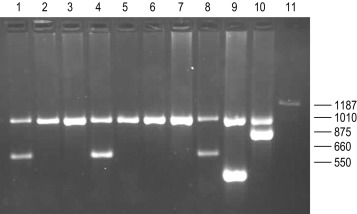
Recently, with the development of new and better PCR reagents, it has been possible to perform a multiplex PCR for the detection of the common α globin gene deletions in one reaction tube. These reagents do not need the addition of DMSO or betaine. More than 30 non-deletional forms of α thalassaemia have been described. Of these, haemoglobin Constant Spring and the α HphI mutation are relatively common in Southeast Asian and Mediterranean populations, respectively. These can be detected by ASOH, ARMS, restriction enzyme digestion or direct sequencing of the appropriate PCR product. Unlike the β thalassaemias, α thalassaemias are not easily diagnosed using routine haematological techniques. The diagnosis of α thalassaemia is often made following exclusion of β thalassaemia and iron deficiency. Because the vast majority of cases of α thalassaemia are of the clinically benign type (i.e. α + thalassaemia), it is debatable whether molecular analysis is justified to reach a diagnosis in these individuals. However, it is important that individuals with α 0 thalassaemia are identified and the only definitive diagnostic test is DNA analysis. The α 0 thalassaemias are almost entirely restricted to certain ethnic groups, namely, those of Chinese, Southeast Asian and Mediterranean origin; and so it is most efficient to target these groups specifically. The diagnosis of α 0 thalassaemia is particularly relevant if prenatal diagnosis is to be offered to a couple who are at risk of having a foetus with hydrops, since there is an increased risk of maternal death at delivery. Guidelines derived from the UK experience as to how and when DNA analysis should be implemented are available. Primers used for this analysis are listed in Table 8-1 and an example is illustrated in Figure 8-4 .
Coagulopathies
Thrombophilia screening
Considerable advances have been made in our understanding of the genetic risk factors found in patients with venous thromboembolism (VTE). Among these are the diverse mutations causing protein C, protein S and anti-thrombin deficiency. An increased factor VIII level is also a risk factor for VTE, but the genetic determinants of this are unclear. Homozygosity for the common C677T mutation of the methylenetetrahydrofolate reductase gene (MTHFR), which gives rise to a thermolabile variant of this protein, has been reported to be a risk factor for VTE, although other studies have not supported this claim and we no longer provide this test as it appears to have no clinical impact.
A point mutation in the 3′ UTR of the prothrombin gene ( FII ) associated with elevated protein levels has been identified as a genetic risk factor for VTE. The most common of the known genetic risk factors for VTE is a resistance to the anticoagulant effect of activated protein C caused by the Arg506Gln substitution in the factor V gene ( FV ). Around 20% of subjects of north European origin presenting for the first time with thromboembolism are heterozygous for this mutation, designated factor V Leiden (FVL). Because of their prevalence and because the tests have become relatively simple, there is a tendency toward indiscriminate testing for these genetic risk factors in thrombophilia, but without careful and informed counselling this may often be inappropriate. (See also Chapter 19 .)
Methodology
A variety of different methods have been used to detect these mutations, but we have recently adopted a hydrolysis probe (TaqMan) based assay. The reagents are provided by Thermo Fisher ( www.thermofisher.com ) and the protocol provided has been adapted as described here. Differentially labelled, but quenched, TaqMan probes hybridise specifically to the reference and variant alleles in a given patient’s sample. Detection of the fluorescent signal, which is emitted as the probes are hydrolysed and the reporter fluorophore dequenched during the PCR amplification, is used to discriminate between the presence of normal and mutant alleles in the sample.
Reagents and equipment
Requirements are a 96-well optical PCR plate, optical adhesive lid, pipettes and tips, TaqMan Genotyping Master Mix, FVL genotyping assay (C_11975250_10), PTM genotyping assay (C_8726802_20), ddH 2 O, Applied Biosystems ( www.appliedbiosystems.com ) 3100HT Fast, Step-One-Plus or equivalent Real-Time PCR apparatus.
Method
Defrost the genotyping assay mixes on ice. In each experiment, include a normal, heterozygous and homozygous control for both the factor V Leiden and the prothrombin mutations. Also include three blanks to which no template DNA is added. In the remaining wells, aliquot 2 μl of test DNA into the bottom of the appropriate well. Prepare a PCR mix for each test using 0.5 μl of the relevant genotyping assay, 10 μl of water and 12.5 μl of the TaqMan Genotyping master mix per sample to be analysed. Aliquot 23 μl of this PCR mix into each well, seal the plate with the optical adhesive lid and spin briefly. Use the ‘Allele Discrepancy Assay’ on the computer associated with the Applied Biosystems 3100HT Real-Time PCR System. Thermocycling conditions are a denaturation at 95 °C, for 10 min for 1 cycle followed by denaturation at 92 °C for 15 sec, and annealing/extension at 60 °C for 60 sec, repeated for 40 cycles.
Interpretation
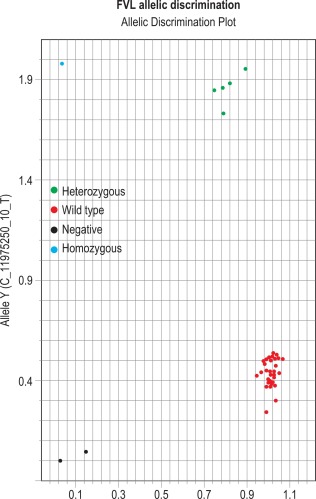
The results can be evaluated using the allelic discrimination plots for the individual genotyping test. Each data point represents one sample and they can be seen to fall into four clusters according to the genotype of the sample or the absence of the signal (NTC) ( Fig. 8-5 ). If the assay has worked, these clusters should be clearly distinct. An automatic genotype annotation is then based on this clustering. Some points will not be automatically identified by the software: these data points can be annotated manually by assigning them to the appropriate cluster.
Clotting disorders
Diverse mutations underlie haemophilia A and haemophilia B and these are usually identified in specialised laboratories by screening exons for mutation by single-strand conformation polymorphism analysis (SSCP), denaturing HPLC or direct DNA sequence analysis. It may still be relevant to determine carrier status and offer prenatal diagnosis through genetic linkage analysis. Problems with this include the number of sporadic cases, lack of informative markers, unavailable family members and the possibility of recombination.
Of particular diagnostic significance is the fact that from between one third and one half of all patients with severe haemophilia A have a large genomic inversion mutation involving recombination between a region in intron 22 of the factor VIII gene and telomeric homologous sequences. These inversions are readily detected by Southern blot analysis applying the p482.6 probe to Bcl I digests of genomic DNA. A method has also recently been described using long-distance PCR, enabling identification of these deletion mutations in a single tube reaction. (See Chapter 18 for more information on bleeding disorders.)
Leukaemia and lymphoma
Cytogenetic analysis
Principles and Terminology
Cytogenetic analysis is usually carried out by specially trained scientists in a separate laboratory that often has no specific relationship to the routine haematology laboratory. For this reason no details of techniques will be given. However, cytogenetic analysis is so crucial to the diagnosis and management of haematological neoplasms that it is necessary for haematologists to understand the principles and be able to understand the reports that are received. In addition, haematologists are often involved in collection of appropriate samples.
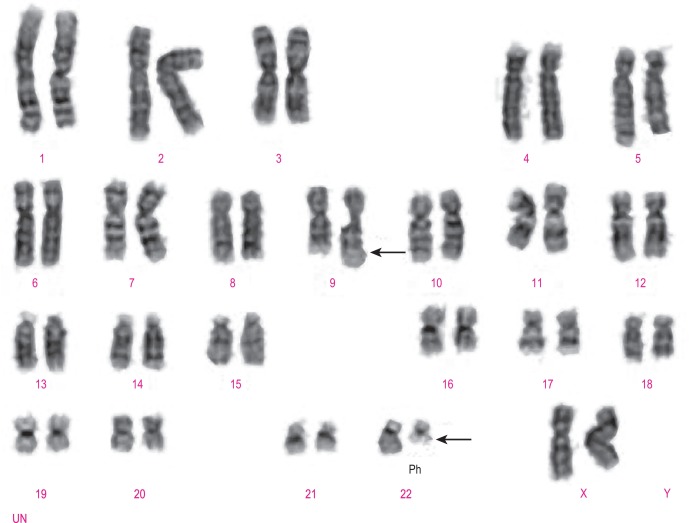
Classical cytogenetic analysis is carried out on cells that have entered mitosis and have been arrested in metaphase so that individual chromosomes can be recognised by their size and their banding pattern following staining (e.g. Giemsa staining [G-banding] or staining with a fluorescent dye). Alternating dark and light bands are numbered from the centromere toward the telomere to facilitate description of any abnormalities detected. An example showing the balanced translocation t(9;22)(q34;q11.2) in CML is shown in Figure 8-6 . The standard terminology applied to chromosomes is shown in Table 8-2 .
| Term | Abbreviation | Explanation |
|---|---|---|
| Centromere | cen | The junction of the short and long arms of a chromosome |
| Telomere | ter | The termination of the short or long arm of a chromosome, pter or qter |
| Long arm | q | The longer of the two arms of the chromosome that are joined at the centromere |
| Short arm | p | The shorter of the two arms of the chromosome that are joined at the centromere |
| Diploid | Having the full complement of 46 chromosomes, 44 paired autosomes, and two sex chromosomes in a cell or clone | |
| Haploid | Having 23 chromosomes, a single copy of each autosome, and either an X or a Y chromosome in a cell or clone | |
| Tetraploid | Having a total of 92 chromosomes, four of each autosome and four sex chromosomes in a cell or clone | |
| Aneuploid | Having a chromosome number that is neither diploid nor a fraction or a multiple of the diploid number, in a cell or clone | |
| Pseudodiploid | Having 46 chromosomes in a cell or clone but with either structural abnormalities or with loss and gain of different chromosomes so that not all chromosomes are paired | |
| Hyperdiploid | The presence of more than 46 chromosomes in a cell or clone | |
| Hypodiploid | The presence of fewer than 46 chromosomes in a cell or clone | |
| Monosomy | − (a minus sign before the chromosome number, e.g. − 7) | Loss of one of a pair of chromosomes |
| Trisomy | + (a plus sign before the chromosome number, e.g. + 13) | Gain of a chromosome so that there are three rather than two copies |
| Deletion | del or a minus sign after the number and the designation of the arm of a chromosome, e.g. del(20q) or 20q − | Loss of part of the long or the short arm of a chromosome |
| Translocation | t | Movement of a chromosomal segment or segments between two or more chromosomes; a translocation can be reciprocal or nonreciprocal |
| Reciprocal translocation | Exchange of segments between two or more chromosomes | |
| Nonreciprocal translocation | Movement of a segment of a chromosome from one chromosome to another but without reciprocity | |
| Balanced translocation | A translocation that occurs without loss of chromosomal material, or at least without loss of sufficient chromosomal material to be detectable by microscopic examination of chromosomes | |
| Unbalanced translocation | A translocation that is associated with gain or loss of part of a chromosome | |
| Inversion | inv | The inversion of a part of a chromosome, either pericentric or paracentric |
| Pericentric inversion | An inversion that follows breaking of both the long and short arms so that the part of the chromosome that is inverted includes the centromere | |
| Paracentric inversion | An inversion that follows the occurrence of two breaks in either the long or the short arm of a chromosome so that the part of the chromosome that is inverted does not include the centromere | |
| Insertion | ins | The insertion of a segment of one chromosome into another chromosome or into a different position on the same chromosomes. Can be direct or inverted |
| Isochromosome | i | A chromosome with two long arms or two short arms joined at the centromere, e.g. i(17q) |
| Derivative | der | A chromosome that is derived from another; a derivative chromosome derived from two or more chromosomes carries the number of the chromosome that contributed the centromere |
| Duplication | dup | The duplication of part of a chromosome |
| Clone | A population of cells derived from a single cell; in cytogenetic analysis a clone is considered to be present if two cells share the same structural abnormality or extra chromosome or if three cells have lost the same chromosome | |
| Marker | mar | An abnormal chromosome of uncertain origin that ‘marks’ a clone |
| Constitutional | c | A chromosomal abnormality that is part of the constitution of an individual rather than being acquired, e.g. + 21c in Down syndrome |
Stay updated, free articles. Join our Telegram channel

Full access? Get Clinical Tree


